Reports
Reports Quantifying antibody binding on protein microarrays using microarray nonlinear calibration Xiaobo Yu, Garrick Wallstrom, Dewey Mitchell Magee, Ji Qiu, D. Eliseo A. Mendoza, Jie Wang, Xiaofang Bian, Morgan Graves, and Joshua LaBaer Virginia G. Piper Center for Personalized Diagnostics, Biodesign Institute, Arizona State University, Tempe, Arizona BioTechniques 54:257-264 (May 2013) doi 10.2144/000114028 Keywords: microarray nonlinear calibration; nucleic acid programmable protein arrays; nn vitro transcription/translation; tuberculosis Supplementary material for this article is available at www.BioTechniques.com/article/114028.
We present a microarray nonlinear calibration (MiNC) method for quantifying antibody binding to the surface of protein microarrays that significantly increases the linear dynamic range and reduces assay variation compared with traditional approaches. A serological analysis of guinea pig Mycobacterium tuberculosis models showed that a larger number of putative antigen targets were identified with MiNC, which is consistent with the improved assay performance of protein microarrays. MiNC has the potential to be employed in biomedical research using multiplex antibody assays that need quantitation, including the discovery of antibody biomarkers, clinical diagnostics with multi-antibody signatures, and construction of immune mathematical models. Protein microarrays are useful tools for simultaneously assessing antibody reactivity against a large number of targets using only a minute amount of sample. This multiplex capability makes microarrays attractive for evaluating antibody specificity and sensitivity, measuring antibody response to vaccination or immunotherapy, screening disease-related antibody biomarkers in a high-throughput manner, and–potentially–early diagnosis and treatment of cancer and infectious diseases with a signature comprising multiple antibody biomarkers (1–5). Binding is usually detected with a fluorescent dye-conjugated secondary antibody that binds the query antibody on the array. Current data assessments rely on direct comparison of signal intensities, which dramatically limits the ability to quantify the relationship between the fluorescent signal and the binding antibodies. Unlike traditional ELISA, which employs an independent standard curve to quantify the concentration of target antibodies, there is no common standard for the detection of antibodies binding to different targets on an array. Antibody affinities for their targets in
serum vary, but currently, no method exists for objectively quantifying independent antibody concentrations. Improvements in the sensitivity and linearity of the dynamic range are also needed to aid in detecting low-abundance antibodies in clinical serum samples. The availability of such improvements would broaden the applicability and acceptance of protein microarrays as routine biomedical research tools (6–8). To address these concerns, we used nonlinear calibration to directly quantify the amount of query antibody binding the surface of protein microarrays using a newly developed microarray nonlinear calibration (MiNC) method. We validated this approach using the nucleic acid programmable protein array (NAPPA) developed in our laboratory (9–10). NAPPA uses a method for producing protein microarrays in which cDNAs encoding proteins are printed on the array and then converted to proteins by in vitro transcription/translation (IVTT). Translated proteins are captured to the surface by virtue of an epitope tag appended to the protein and a corresponding capture agent.
Materials and methods
Sera samples The human serum was obtained from a healthy donor in the lab. The sera from guinea pig tuberculosis (TB) models were kindly provided by Dr. David McMurray, Texas A&M University, and included non-vaccinated/non-infected samples (n = 6) and recombinant BCG (rBCG) vaccinated samples (n = 7). All sera were collected five weeks after respiratory challenge of the guinea pigs with M. tuberculosis H37Rv in an aerosol chamber. Plasmid repository and high-throughput DNA preparation Sequence-verified, full-length cDNA expression Mtb plasmids in flexible donor vector systems were obtained from the J. Craig Venter Institute. Publicly available p53, c-jun, CYR AB, and PRDX4–3 plasmids were obtained from the DNASU Plasmid Repository (http://dnasu.asu.edu/ DNASU/). These genes were subcloned into the T7-based mammalian expression vector pANT7_GST using LR recombinase (Invitrogen, Carlsbad, CA). High-throughput
Method summary:
Here we present a microarray nonlinear calibration (MiNC) method for quantifying antibody binding to the surface of protein microarrays. Calculated antibody binding is highly proportional to the antibody concentration in solution. When compared to previously described methods, MiNC significantly improved the linear dynamic range and reduced assay variation. More importantly, Vol. 54 | No. 5 | 2013
257
www.BioTechniques.com
Reports
preparation of high quality supercoiled DNA for cell free protein expression was performed as previously described (9). Briefly, expression plasmids were transformed into E.coli DH5α and grown in 1.5 mL terrific broth (Sigma-Aldrich, St. Louis, MO) with 100 µg/mL ampicillin. DNA was purified with the NucleoPrepII anion exchange resin (Macherey-Nagel Inc., Bethlehem, PA) using a Biomek FX (Beckman Coulter, Inc., Fullerton, CA) automated laboratory workstation. Automated addition of all solutions was accomplished using a Matrix WellMate (Thermo Scientific, Hudson, NH) rapid bulk liquid dispensing instrument. Purified DNA was precipitated by addition of 40 µL NaOAc and 240 µL isopropanol followed by centrifugation at 4000× g for 30 min. The DNA pellet was washed with 300 µL 80% ethanol, centrifuged at 4000× g for 30 min, dried, and resuspended in distilled water. For the p53 and multiplexed antibody assays, large quantities of p53, c-jun, CYRAB, and PRDX4–3 DNA were prepared using standard Nucleobond preparation methods (Macherey-Nagel Inc., Bethlehem, PA). All IgG standards and DyLight549-conjugated secondary antibody were purchased from Jackson ImmunoResearch Labs (West Grove, PA). Mouse anti-p53 antibody was obtained from Santa Cruz Biotech (Santa Cruz, CA). Mouse anti-c-jun antibody was obtained
from Invitrogen. Mouse anti-CYRAB and anti-PRDX4–3 antibodies were obtained from SAIC-Frederick, Inc. (Frederick, MD). Influence of zone effects and serum on IgG standards To examine zone effects, mouse IgG standards were printed at four different locations on the amine-coated glass slide. The array was incubated with DyLight549-conjugated rabbit anti-mouse IgG antibody (10 µg/mL) for 1 h, followed by washing with PBST (PBS, 0.2% Tween) three times, then washing with water, and air drying. To examine the influence of serum on IgG standards, guinea pig IgG standards were printed on the slide and incubated with serum from ten guinea pigs (1:300 dilution) for 1 h. The resulting array was incubated with DyLight549 conjugated rabbit anti-guinea pig IgG antibody (10 µg/ mL) for 1 h, followed by washing with PBST 3 times, washing once with water, and drying with air. Anti-p53 antibody assay and multiplexed antibody assay with protein microarrays Varying amounts of mouse IgG (0, 3, 10, 30, 89, and 266 fmol) were printed on the aminomodified slide along with different concentrations of p53 plasmid (316, 474, 711, 1067, 1600, and 2400 ng/µL) (9–10). Briefly, the
SurModics In Vitro Diagnostics Prevent non-specific binding. Increase signal and stability.
Customized Surfaces for DNA, RNA, and Proteins • CodeLink® Activated Slides • CodeLink HD Activated Slides • TRIDIA™ EP Microarray Slides
Visit us at ASM Booth 215 and AACC Booth 1434
• Custom In Vitro Diagnostic Surfaces • Microarray Stabilizers • In Vitro Diagnostic Reagents
[email protected] | 952-500-7200 | www.surmodics.com
plasmid DNA was mixed with a master mix composed of capture antibody (50 µg/mL, anti-GST antibody, GE Healthcare Biosciences, Piscataway, NJ), protein crosslinker (2 mM, BS3, Pierce, Rockford, IL), and BSA (3 mg/mL, Sigma-Aldrich). All samples were printed using a Genetix QArray2 (Genetix, Hampshire, UK) with 300 µm solid tungsten pins on amine-treated glass slides. With this approach, the anti-GST antibody, BSA, and plasmid DNA can be cross-linked to the amino groups on microarray spots. Arrays were protected from light and stored in an air-tight container at room temperature. The printed DNA was transcribed and translated in situ using previously published protocols (9–10). After IVTT and blocking with 5% milk with 0.2% Tween 20, the resulting p53 array was incubated with different concentrations of anti-p53 antibody (0, 3, 8, 24, 74, 222, 667, and 2000 ng/mL) for 1 h and DyLight549conjugated rabbit anti-mouse IgG antibody (10 µg/mL) for 1 h separately. Then the slides were washed with PBST three times, once with water, and air-dried. To perform multiple antibody assays, 1500 ng/µL of c-jun, CYRAB, and PRDX4–3 plasmids were printed on a slide parallel to mouse IgG standards. After IVTT, the resulting protein array was incubated with the antibody mixes comprising eight concentrations of spiked mouse anti-c-jun, anti-CYRAB, and anti-PRDX4–3 antibodies in 1:300 diluted human serum. The spiked anti-c-Jun antibody concentrations were 0, 55, 165, 494, 1481, 4444, 13333, and 40000 ng/mL The spiked anti-PRDX4–3 antibody concentrations were 0, 27, 82, 247, 741, 2222, 6667, and 20000 ng/mL. The spiked anti-CRYAB antibody concentrations were 0, 3, 8, 25, 74, 222, 667, and 2000 ng/mL. Detection was performed with DyLight549-conjugated rabbit anti-mouse IgG antibody (10 µg/mL). Analysis of guinea pig TB model serological response using protein microarrays The serological response of guinea pig TB models was analyzed using high density microarrays consisting of 849 TB proteins and graded quantities of guinea pig IgG standards (0, 1.6, 5, 15, 44, and 133 fmol). To control the quality of TB NAPPA microarrays, the immobilized DNA plasmids were examined using PicoGreen stain (Invitrogen) diluted 1:1800 in Superblock solution (Pierce). The protein expression was examined using anti-GST monoclonal antibody (Cell Signaling, Danvers, MA) diluted 1:200 in 5% PBST milk. The immobilization of guinea pig IgG standards was examined with DyLight549 conjugated donkey anti-guinea pig antibody (10 µg/mL). For the detection of antibodies in serum, the arrays were incubated with 2.5 mL www.BioTechniques.com
Reports
8.5 (OriginLab Corp., Northampton, MA). The nonlinear standard curve was either a four-parameter power curve
f (x)=axb +cxd or a three-parameter logistic curve
f (x)=a(1-e-bx)c
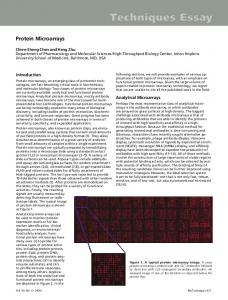
Figure 1. The detection of antibody using protein microarrays. (A) Schematic illustration of an antibody assay using microarray nonlinear calibration (MiNC). It consists of adding a series of different known amounts of IgG standards to an array. The IgG should match the species from which the primary antibody came (lower graph, brown). The IgG standards are used to construct a nonlinear standard curve (upper graph, left) to interpolate the amount of IgG antibodies that bind to the surface of each protein spot after antibody incubation (upper graph, right), which is calculated and represented in fmol (red). The detection is performed with fluorescent-dye conjugated secondary antibody. SFI is the sum of fluorescent intensity within each protein spot (black). (B) Fluorescent images of the detection of different concentrations of mouse anti-p53 antibody. The left sub-array shows the mouse IgG standards (0, 3, 10, 30, 89, 266 fmol) and the right sub-array comprises different concentrations of p53 DNA plasmids (316, 474, 711, 1067, 1600, and 2400 ng/µL) in six replicates used to express proteins by the nucleic acid programmable protein array (NAPPA) method. The detection was performed with DyLight549conjugated rabbit anti-mouse IgG secondary antibody.
Figure 2. Influence of zone effect and serum on IgG standards. (A) Fluorescent image of mouse IgG standards at different locations of the slide; (B) Comparison of fluorescent signal intensity of four IgG standards; (C) and (D) are the comparisons of the signal intensity and calibration curve of guinea pig IgG standard after incubation with sera from each of ten guinea pigs. The detection was performed with DyLight549-conjugated rabbit anti-mouse IgG antibody and rabbit anti-guinea pig IgG secondary antibody, respectively.
pooled sera from guinea pig TB models with and without rBCG vaccination, which was diluted 1:300 in 5% PBST milk. All incubations were carried out at 4°C for 16 h. Detection of the array was carried out using DyLight549conjugated donkey anti-guinea pig antibody (10 µg/mL). This experiment was repeated three times using the same sera samples. Vol. 54 | No. 5 | 2013
Data analysis All slides were scanned with Tecan’s PowerScanner (Männedorf, Switzerland) and the images were quantitated using Array-Pro Analyzer, version 6.3 (Media Cybernetics, Bethesda, MD). All graphs were drawn using Excel 2007 (Microsoft Corp. Redmond, Washington) and OriginLab
259
fit according to the least-squares principle using XLfit 5.0 software (IDBS, Alameda, CA). We computed intra-coefficient of variance (CV) coefficients for 6 proteins (p53 at concentrations of 711, 1067, and 1600 ng/µL, and jun, CYRAB, and PRDX4), for each of 2 replicated experiments and 8 antibody concentrations. The differences between MiNC and non-MiNC intra-CV coefficients for each protein were analyzed using a t-test to examine overall differences, and one-way ANOVA with a concentration factor to examine differences by concentration. For each protein and concentration, we computed the inter-CV coefficient by calculating the CV of the means for the two experiments. We examined differences between the MiNC and non-MiNC inter-CV coefficients using a paired t-test. To identify potential antibodies induced by rBCG vaccination, we first normalized raw signal intensities and the predicted antibody binding (fmol) by subtracting the background signal attributable to non-specific binding of TB antibodies, which was estimated by the first quartile of the nonspot control, and divided the result by the median background-adjusted value of proteins on the array. These values were then averaged over duplicate spots to obtain a single normalized value for each protein. To perform statistical analysis, the log-transformed data were analyzed using Significance Analysis of Microarrays (SAM) to select antibodies with higher levels in the rBCG group. SAM is a statistical method originally used for selecting genes with significant changes in expression from DNA microarray data. SAM uses modified t-statistics to compare antibody levels and permutation analysis to estimate false discovery rates (11). To perform the hierarchical analysis and draw the heat maps, the normalized data were transformed as previously described (12–13) and the analyses were performed using MultiExperiment Viewer 4.1 software (www.tigr.org).
Results and discussion
A general scheme for analyzing antibody assays with MiNC is shown in Figure 1. DNA plasmids encoding a relevant set of targets were printed on the array and expressed by IVTT in the usual fashion (Figure 1A, lower graph, green). In parallel, features containing purified IgG (from the same animal species as the primary antibody) were printed in measured and graded amounts on the array (Figure 1A, lower graph, left, brown). The resulting protein www.BioTechniques.com
Reports
A
B
C
D
curve will fit the data well, be smooth enough to be insensitive to experimental errors, and retain the true zero point. Visual inspection of the calibration curves is crucial to assess both fit and smoothness. Findlay and Dillard discuss several important issues with calibration, including different calibration models, methods to fit models, and methods to assess model fit and array design (17). Retention of the true zero point is critical to ensure that the calibrated data remain on a ratio scale, which is a required property in order for the CV to be an appropriate measure of error. In our experiments we have found that power and logistic functions, parameterized using three to four parameters and estimated according to the least-squares principal, typically yield smooth curves that fit the data well. Specifically, in this work we have used both a four-parameter power curve
f (x)=axb +cxd
E
F
and a three parameter logistic curve
f (x)=a(1-e-bx)c .
Figure 3. Comparison of antibody assays with and without MiNC. (A) and (B) The detection of anti-p53 antibody using p53 DNA plasmid concentrations of 1067 and 1600 ng/µL to produce p53 protein locally. The y-axis and x-axis are the signal intensity (black) and the fmol (red) from the blank controls, respectively. (C) and (D) The comparison of intra-CV and inter-CV using raw signal intensity (black) and microarray nonlinear calibration (MiNC)-calibrated intensity (red), respectively. Each boxplot represents the distribution of coefficient of variance (CV) values across three p53 plasmid concentrations (711, 1067, and 1600 ng/µL) in which the bottom edge, top edge, and middle line correspond to the minimum, maximum, and median values, respectively. (E) and (F) Multiplex detection of antibodies in human serum without and with MiNC. The graphs were drawn using raw signal intensity (E) and MiNCcalibrated intensity (F). The error bars represent the standard deviations. The R2 was calculated to show the linear relationship of antibody concentration to calibrated antibody levels using MiNC.
microarrays were probed with either antibodies or serum expected to recognize one or more of the protein targets on the array (Figure 1A, lower graph, right, brown). These were then visualized using the appropriate secondary anti-IgG antibody coupled to a fluorescent dye. In addition to binding any primary antibodies captured by target antigens, the secondary antibody also bound to the series of IgG molecules. Then we fit a nonlinear curve to the signals from the labeled secondary antibody to the IgG standards (Figure 1A, upper graph, brown). By comparing the target feature signals (black) with the nonlinear IgG calibration curve, we interpolated the amount of antibody that bound to the surface of each spot, which was calculated and represented as fmol of bound antibodies (red). Linear calibration using IgG standards has been used previously as an indirect fluorescent Vol. 54 | No. 5 | 2013
detection method for antigen microarrays in infectious disease testing. However, the use of a linear standard curve limited the range of detection to approximately one order of magnitude; signals outside this range were not reliably quantified (14–15). The use of a nonlinear curve may ameliorate this limitation significantly (16), but optimally fitting a nonlinear curve to data is a non-trivial problem, with solutions depending not only on the data themselves (e.g., number of points, number of unique x values, variability), but also on the desired shape, smoothness, and intended use of the curve. Thus, no single approach to curvefitting will be appropriate for all applications. In the context of calibration, fixed-form methods using logistic and power curves are commonlyused (17–19). Alternative methods based upon flexible splines or hierarchical models have also been proposed (20–21). The ideal calibration
260
However, we caution that other experimental data and experimental conditions may require different approaches to generate appropriate calibration curves, and that calibration curves should always be inspected visually to ensure adequate fit and smoothness. We first investigated the quality of the IgG calibration features on the NAPPA platform. We examined whether the IgG standard was affected by the printed slide position and found that all of the spots on the slide exhibited excellent feature morphology with an average variation of 14% (range: 3%–27%) (Figure 2, A and B). We also compared the IgG standard following incubation with serum from ten Mtb challenged guinea pigs individually and found an average variation of 10% (range: 6%–14%) (Figure 2, C and D). To evaluate quantitative performance, we chose p53 and mouse anti-p53 antibody as a model. Figure 1B exhibits an increase in the fluorescent signals of both the IgG standards at the left and expressed p53 proteins at the right side of each array as antibody concentration increases. The signal intensities at eight anti-p53 antibody concentrations were measured against DNA plasmids encoding p53 at concentrations of 711, 1067, and 1600 ng/µL (Figure 3, A and B, Supplementary Figure S1), which covers the typical range of DNA plasmids printed. The graphs show that the raw signal intensity (black) increased with increasing anti-p53 antibody concentration in a nonlinear fashion. Although the dynamic ranges of fluorescent-based antibody assays typically cover three orders of magnitude, the linear dynamic range of the raw signals, within which changes in antibody concentration can www.BioTechniques.com
Reports
B
A
MiNC ranged from 0.14 to 0.30 ng/mL, which was almost no different from the LOD without MiNC. To further expand these results and to test whether the presence of serum affected the outcome, we spiked eight different concentrations of mouse anti c-jun, anti-CYRAB, and anti-PRDX4–3 antibodies in 1:300 diluted human serum (22). Using the same method, we found that predicted antibody binding was proportional to the change of antibody levels with R2 values of 0.99 for all 3 antibodies (Figure 3, E and F). The average intra-CV decreased from 10% to 4% and the inter-CV had no change: 10% before and after calibration with MiNC, respectively (Table 2). The LOD also did not change. From this equation describing antibody-antigen interaction
C
D
[AgAb]=(
Figure 4. Quality control of NAPPA microarrays with 849 TB genes. Expression clones encoding the target proteins fused to a C-terminal GST tag were printed along with a polyclonal anti-GST antibody in duplicate on the nucleic acid programmable protein array (NAPPA) surface. (A) DNA capture was confirmed by PicoGreen (PG) staining (DNA). (B) In situ protein expression and capture were assessed by GST detection using a monoclonal antibody (protein). The correlation of duplicate spots within one slide (C) and between two different slides (D) is 0.96 and 0.81, respectively (GST color code: red>orange>yellow>green>blue).
be accurately measured, was only about one order of magnitude. Thus, changes in antibody concentration outside of this range were not readily measured by raw fluorescence intensity. However, after estimating the amount of bound antibody (red color) by calibrating with a fourparameter power curve
f (x)=axb +cxd we found a linear relationship over 2.5–3.0 orders of magnitude for the assay (red) with an R2 of 0.99. We also compared the signal variation for raw intensity (Figure 3, C and D, black) and
[Ag] )[Ab] kd
we know that the amount of antibody-antigen complexes formed on the microarray spots is proportional to the antibody concentration because the reaction volume and number of antigens are fixed and the Kd is dependent on the affinity of the antibodies. This is consistent with our results and shows the feasibility of antibody quantification with MiNC on protein microarrays. In comparison with previously developed methods to improve the assay performance of protein microarrays and antibody microarrays, such as two-color Fab labeling or internally controlled systems (23–24), MiNC not only significantly improved the linear dynamic range, but also reduced assay variation. More importantly, it has the ability to quantify hundreds of antibodies binding to the protein microarray simultaneously. To demonstrate the feasibility of using MiNC with high density protein microarrays
calibrated intensity (Figure 3, C and D, red) within a single experiment (intra-CV) and between different experiments on different days (inter-CV). The results showed that MiNC improved both the intra-CV (Figure 3C) and inter-CV (Figure 3D) at all concentrations of anti-p53 antibody from 0 ng/mL to 2000ng/mL. With MiNC, the average intra-CV decreased from 9% to 4%, and the average inter-CV decreased from 18% to 8% (Table1). We also calculated the lowest concentration of detection limit (LOD) for the anti-p53 antibody based on the mean value of negative controls plus three standard deviations. The results showed that the LOD with
Table 1 Comparison of the performance of anti-p53 antibody assay without and with MiNC p53 DNA Plasmids (ng/µL)
LOD (ng/mL)
Dynamic range (ng/mL)
Intra-CV(%)*
MiNC
MiNC
MiNC -
Inter-CV(%)* MiNC
+
-
+
-
+
p-value
-
+
p-value
711
0.41
0.30
0.41 - 667
0.30 - 667
10
4