American Mineralogist, Volume 97, pages 1685–1699, 2012
Quantifying crystallization and devitrification of rhyolites by means of X-ray diffraction and electron microprobe analysis Michael C. Rowe,* Ben S. Ellis, and Abbie Lindeberg School of the Environment, Washington State University, Pullman, Washington 99164, U.S.A.
Abstract Devitrification of silicic volcanic rocks is a relatively common process, resulting in the production of microcrystalline silica and feldspar components. Here we investigate how the products of pervasive devitrification may be characterized using the combined techniques of X‑ray powder diffraction, electron microprobe analysis, and X‑ray fluorescence analysis to provide a new calibrated approach to calculating the crystallinity and mineral modes in both glassy vitrophyre and devitrified volcanics. Using the integrated areas of the X‑ray diffraction peaks associated with both the crystalline and amorphous components, the relative proportions of groundmass crystallites and amorphous material from both glassy and devitrified material can be calculated. A detailed calibration indicates a linear relationship among the ratio of the integrated counts and bulk crystallinity. Mineral proportions are also calculated from X‑ray fluorescence measurements of whole-rock and groundmass separates and are well correlated to crystallinities calculated from both X‑ray diffraction and electron microprobe image analysis for vitrophyre samples. Devitrification products in a pervasively devitrified sample are tridymite, quartz, sanidine, and a Ca-rich aluminosilicate component. Mineral analysis and X‑ray mapping by electron microprobe analysis indicates that the Ca-rich aluminosilicate component appears to be the dominant metastable or amorphous phase in the devitrified sample with proportions calculated from X‑ray mapping (~32%) in reasonable agreement with the calculated proportion of amorphous material determined by means of X‑ray diffraction (~38%). These results demonstrate the robustness of this combined X‑ray diffraction and electron microprobe imagery technique for quantifying and characterizing crystallization in complex samples. Keywords: Rhyolite, devitrification, X‑ray diffraction, electron microprobe analysis, tridymite, crystallinity, feldspar, amorphous
Introduction Glasses are a ubiquitous product of both effusive and explosive volcanic eruptions from all tectonic settings and have been produced from at least the Archean (Yamagishi and Dimroth 1985) to the recent (Swanson et al. 1989; Castro and Dingwell 2009). Volcanic glasses record the full spectrum of erupted compositions from basaltic (e.g., Pick and Tauxe 1993) to rhyolitic (e.g., Ross and Smith 1955) and more alkaline compositions (Pantellerite; Noble 1968). The products of explosive volcanic eruptions may accumulate significantly rapidly such that the pyroclasts remain hot (and thus ductile), as later-erupted material is added to the top of the deposit. In response to this load, the deposit develops a foliation (eutaxitic fabric) as the originally rounded to sub-rounded pumice clasts are flattened, in a process termed “load welding” (Wolff and Wright 1981; Freundt 1998). In cases where the pyroclasts are exceptionally hot, and accumulation sufficiently rapid, welding occurs synchronously with deposition (Branney et al. 2004; Andrews and Branney 2011) and the individual particles manage to fully coalesce at some distance from the vent and begin flowing like a silicic lava in a process referred to as rheomorphism (Wolff and Wright 1981). Intensely welded ignimbrites have a characteristic profile of glassy (predominantly amorphous groundmass with occasional * E-mail:
[email protected] 0003-004X/12/0010–1685$05.00/DOI: http://dx.doi.org/10.2138/am.2012.4006
phenocrysts and microphenocrysts) margins at the bottom and top of the ignimbrite where the hot pyroclasts chilled rapidly against the ground and air, respectively, and a microcrystalline groundmass (consisting of crystalline phases predominantly 550 °C for a rhyolite) for as much as two years following deposition (Andrews and Branney 2011), promoting devitrification. In many cases, devitrification may be incipient, occurring radially from point sources to produce spherulites (e.g., Watkins et al. 2009). Where this occurs, the expulsion of water from the crystallizing anhydrous phases has subsequent effects not only on the distribution of water throughout the material (e.g., Castro et al. 2008) but also on the oxidation state of the surrounding glass (Castro et al. 2009). Spherulites are commonly found at transitional zones between rapidly chilled vitrophyric material and pervasively devitrified microcrystalline centers of large silicic
1685
1686
ROWE ET AL.: DEVITRIFICATION OF RHYOLITES
bodies, and their origin and nature has been much studied (e.g., Smith et al. 2001; Seaman et al. 2009; Watkins et al. 2009). In this work we consider the generation of the volumetrically major microcrystalline pervasively devitrified portion of a deposit, hereafter just “devitrified,” which has received significantly less attention. In this paper, we use the term devitrified to refer to the microcrystalline interior of a welded tuff, irrespective of whether this material was ever a solid glass on the surface. The purpose of this study is to construct a methodology for characterizing the products of pervasive devitrification in rhyolites. Included, is a verification of a new approach for quantifying both whole-rock and groundmass crystallinity. Crystallinity in volcanic rocks is routinely inferred from scanning electron microscopy (SEM) and electron microprobe analysis (EMPA) using X‑ray and/or backscatter electron (BSE) imaging (e.g., Cashman and McConnell 2005; Cashman et al. 2008; Riker et al. 2009). Importantly, these two-dimensional imaging techniques are fundamentally based on variations in chemistry, not crystalline structure, to distinguish different potential crystalline components from an otherwise glassy matrix. We therefore propose that these more commonly utilized approaches to estimating crystal content are insufficient for characterizing crystallinity in samples where the groundmass does not contain an easily identifiable glassy component. It is for this reason that we have pursued a structural, bulk analysis approach through powder X‑ray diffraction to characterize crystallinity in devitrified volcanic material. While largely descriptive, this detailed assess-
ment of the technique for characterizing devitrification products is a critical step toward being able to utilize this technique in further interpretations related to cooling rates of rheomorphic ignimbrites and lavas.
Geologic setting Central Snake River Plain The central Snake River Plain (CSRP) of southern Idaho (Fig. 1) represents a portion of the Columbia River-Yellowstone volcanic province, generally thought to be formed in response to the presence of the Yellowstone hotspot (Pierce and Morgan 1992; Geist and Richards 1993; Wolff et al. 2008). The CSRP is a bimodal basalt-rhyolite province where the silicic volcanic products exhibit an association of lithofacies so different to those found in other rhyolitic provinces that it has been termed “Snake River (SR)-type” volcanism (Branney et al. 2008). The ignimbrites produced by SR-type volcanism exhibit a bimodality of welding, with the majority intensely welded and “lava-like” in hand specimen, whereas a few are non-welded. Where intensely welded, the CSRP ignimbrites are off the top of the welding scale of Quane and Russell (2005); moderately welded, eutaxitic ignimbrites do not exist in the CSRP. Commonly, the intensely welded ignimbrites are rheomorphic as characterized by folding present in various styles and on various scales (from microscopic to tens to meters), and lineation and foliation (e.g., Andrews and Branney 2011). Welding and rheomorphism are pervasive in the
Figure 1. Map showing the location of the Tuff of Knob used in this study and its relative stratigraphic position. Upper inset illustrates the location of the Snake River Plain within the contiguous U.S.A. The lower inset illustrates the bulk composition of the Tuff of Knob (data from Bonnichsen et al. 2008).
ROWE ET AL.: DEVITRIFICATION OF RHYOLITES
CSRP despite the fact that these rhyolites are metaluminous to weakly peraluminous (compared to metaluminous rocks, peraluminous rocks are more likely to be rheomorphic; e.g., Branney et al. 2008). Welded ignimbrites are exposed to the north and south of the plain, with up to 13 ignimbrites stacked vertically in fault scarps separated by poorly exposed slope-forming material variously composed of non-welded pyroclastic deposits, reworked fluvio-lacustrine sediments and palaeosols. This study uses the ca. 10.6 Ma Tuff of Knob, located in the East Bennett Mountains to the north of the CSRP (Fig. 1). The Tuff of Knob For this investigation, we focused on a single ignimbrite, the Tuff of Knob. This locality was selected because: (1) it is locally thick with a high-eruption temperature, similar to other CSRP units; and (2) prior chemical characterization of glass and phenocryst compositions provides a good initial framework in which to build this new approach. The Tuff of Knob is a typical Snake River-type ignimbrite, intensely welded throughout with black, glassy basal and upper vitrophyres and a red to brown crystalline interior (Fig. 2). Within the CSRP, the Tuff of Knob
1687
has relatively low bulk SiO2 (71.1–72.6 wt% anhydrous, n = 31) and high TiO2 (0.6–0.7 wt%). Compositions of samples used in this study are provided in Table 1. Like all CSRP rhyolites, it has an anhydrous phenocryst assemblage containing quartz (rare), sanidine (rare), plagioclase, augite, pigeonite, ilmenite, magnetite, and accessory zircon and apatite. Mineral geothermometry indicates that the Tuff of Knob had high magmatic temperatures 932 ± 11 °C (two pyroxene thermometry, Andersen et al. 1993) and 884 ± 10 °C (two feldspar thermometry, Putirka 2008), typical of CSRP ignimbrites (Cathey and Nash 2004; Ellis et al. 2010; Ellis and Wolff 2012).
Samples and methodology This work investigates how devitrification may be quantified in natural rhyolitic samples using X‑ray diffraction (XRD) and elemental mapping by EMPA. Specifically, this study aims to provide a means to calculate crystallinity in devitrified rhyolites. In addition, this study provides detailed mineral analysis, mineral proportions, and groundmass textures through both field-emission (FE)-EMPA and XRD techniques. Because the primary objectives of this study are to provide a methodology for examining the products of devitrification in conjunction with crystallinity calculations, this study focuses on a relatively small number of samples from the basal vitrophyre, lithoidal interior, and upper vitrophyre from the Tuff of Knob. We analyzed both bulk samples (indicated by WR) and separated groundmass
Figure 2. Field and thin section appearance of typical Snake River-type rhyolites (a) densely welded, glassy flow-banded vitrophyre containing phenocrysts (pen for scale). (b) Red to brown, lithoidal rhyolite from the slowly cooled interior of an ignimbrite (scale divisions on ruler = 1 cm). (c) Thin section photomicrograph of glassy flow-banded vitrophyre similarly observed in outcrop (a) (Sample 09-013; field of view ~2.5 × 1.7 cm). (d) Thin section photomicrograph of devitrified sample 09-012 with a “felty” texture similar to that observed in b (field of view ~1.5 cm).
1688
ROWE ET AL.: DEVITRIFICATION OF RHYOLITES
Table 1. Whole-rock, groundmass, and glass analysis by XRF* and EMPA Sample 09-013 09-012 09-023 09-013 09-012 09-023 BOF 09-013 Unit Tuff of Knob Tuff of Knob Tuff of Knob Tuff of Knob Tuff of Knob Tuff of Knob Tuff of Knob Avg. Glass Location Basal vit Devitrified Upper vit Groundmass Groundmass Groundmass vit EMP n=10 Major elements (wt%) SiO2 72.15 71.98 71.41 74.9 74.73 75.05 72.9 76.0(2) TiO2 0.6 0.61 0.62 0.44 0.49 0.39 0.44 0.31(3) Al2O3 12.98 12.97 13.18 12.09 12.09 12.04 12.09 12.0(2) FeOT 3.81 4.39 4.36 2.7 3.26 2.67 2.29 2.1(2) MnO 0.06 0.04 0.07 0.04 0.03 0.04 0.06 0.04(2) MgO 0.35 0.29 0.4 0.16 0.16 0.16 0.23 0.09(2) CaO 1.86 1.56 2.01 1.04 0.84 0.94 0.96 0.8(1) Na2O 2.89 3.17 2.93 2.69 2.91 2.55 5.21 2.7(2) K2O 5.19 4.84 4.91 5.87 5.37 6.09 4.01 5.6(4) P2O5 0.11 0.15 0.13 0.07 0.12 0.06 0.04 – Total 96.25 97.88 96.42 95.22 97.9 95.15 99.62 96.92 Normalized major elements (wt%) SiO2 74.96 73.54 74.06 78.66 76.33 78.88 73.18 78.42 TiO2 0.62 0.62 0.64 0.46 0.50 0.41 0.44 0.32 Al2O3 13.49 13.25 13.67 12.70 12.35 12.65 12.14 12.38 FeOT 3.96 4.49 4.52 2.84 3.33 2.81 2.30 2.17 MnO 0.06 0.04 0.07 0.04 0.03 0.04 0.06 0.04 MgO 0.36 0.30 0.41 0.17 0.16 0.17 0.23 0.09 CaO 1.93 1.59 2.08 1.09 0.86 0.99 0.96 0.83 Na2O 3.00 3.24 3.04 2.83 2.97 2.68 5.23 2.79 K2O 5.39 4.94 5.09 6.16 5.49 6.40 4.03 5.78 P2O5 0.11 0.15 0.13 0.07 0.12 0.06 0.04 – Trace elements (XRF ppm) Ni 3 3 4 3 3 4 2 Cr 4 4 4 3 3 1 4 Sc 7 7 7 4 6 6 6 V 21 25 23 5 13 7 9 Ba 1199 1225 1334 1167 1213 1126 862 Rb 167 174 161 195 199 210 113 Sr 111 114 128 56 67 46 55 Zr 564 581 566 510 550 478 350 Y 64 69 65 63 54 66 46 Nb 39 40 39 43 44 43 21 Ga 21 22 21 19 19 20 19 Cu 5 7 6 3 5 4 8 Zn 90 95 88 65 80 59 55 Pb 24 26 25 27 27 27 16 La 77 87 80 84 90 85 32 Ce 149 152 151 161 121 156 61 Th 28 27 27 32 29 31 11 Nd 60 66 63 62 67 59 28 U 7 7 6 10 7 9 3 * All major and trace element concentrations are determined by XRF except where indicated. Error and reproducibility of XRF measurements at Washington State University are reported by Johnson et al. (1999). Parentheses indicate 1 s.d. of repeat microprobe analysis. in addition to using a young Holocene Oregon Cascade obsidian as a glassy end-member (BOF) for comparison. The lithoidal interior sample (subsequently referred to as “devitrified”; sample 09-012) has a fine-grained, felty groundmass texture. Groundmass grain size is typically less than 10 μm and grains are often irregularly shaped. A small proportion of the groundmass near feldspar phenocrysts appears slightly coarser and granophyric, although this is a volumetrically minor texture. Basal and upper vitrophyre samples (09-013 and 09-023, respectively) have a perlitic texture. Flow banding is evident from concentrations of Fe-Ti oxide microphenocrysts in the groundmass.
X‑ray diffraction Samples were prepared for powder X‑ray diffraction analysis by crushing, sieving, and hand picking glass/groundmass under a binocular microscope. Samples were then cleaned in dilute HNO3 to remove any weathering products, filtered and dried. Samples were hand-crushed in a mortar and pestle, wetted with isopropanol and smeared evenly on a glass plate then allowed to dry. Smear mounts were run on a Siemens D500 X‑ray diffractometer at Washington State University. Samples were run using Ni-filtered CuKα radiation generated at 35 keV and 30 mA. Diffracted X‑rays from the sample were again diffracted off a graphite monochronometer prior to entering the scintillation detector further reducing interferences from CuKβ radiation and Fe-fluorescence. Scans were run at 10–40, 10–50, and 10–70 °2Θ using a 0.02° step size and 1–3 s dwell time (Table 2). An Oregon Cascade
obsidian sample was analyzed repeatedly to test for reproducibility of scans and mounting procedure. A silicon powder 2Θ X‑ray diffraction standard (NBS 640b) was analyzed to verify the accuracy of diffraction peak positions. In addition, a calibration curve for crystallinity measurements was prepared by mixing crushed powders of a granite (assumed to be completely crystallized) with a glass plate (assumed to be completely amorphous).
Electron-microprobe analysis Sample mounts (both chips and thin sections) were analyzed by electron microprobe analysis on a JEOL 8500F field emission (FE) electron microprobe at Washington State University. A combination of techniques was used including quantitative analysis by wavelength dispersive spectrometry (WDS) and X‑ray mapping of Al, K, Ca, Na, and Fe. Groundmass glass from the vitrophyre samples was analyzed using electron microprobe conditions reported by Ellis et al. (2010). Devitrification products (excluding quartz) were analyzed using a 15 keV accelerating voltage, 30 nA beam current with a 3 μm beam diameter. X‑ray maps of sample groundmass were collected over three size areas; 100 μm2, 500 μm2, and 1.024 × 2.048 cm. X‑ray maps for the 500 μm2 region were collected using a 1 μm beam diameter and step size with a 30 ms dwell time. The 100 μm2 map region was mapped utilizing a 1 μm beam diameter, 0.4 μm step size, and 30 ms dwell time. The 1.024 × 2.048 cm scans were run using a 10 μm beam diameter, 10 μm step size. A 15 keV accelerating voltage and 40 nA beam current was used
ROWE ET AL.: DEVITRIFICATION OF RHYOLITES
1689
Table 2. XRD and EMPA crystallinity calculations and phase proportions Dwell Integrated counts‡ Crystallinity (%) Phase proportions (%)*,† Sample (s) °2Θ Linear Cubic spline CC/(CC + AC)# XRD corr. X-ray map X-ray map 09-023WR 1 10–70 29616 11026 37.2 26.0 17.3 Ca (11.6), Fe (2.8) 09-023 1 10–70 33832 6634 19.6 4.5 2.9 Ca (0.2), Fe (2.7) 09-012WR 1 10–70 38298 36791 96.1 97.7 100 Ca (13.4), Fe (2.2) 09-012 1 10–70 36918 24622 66.7 61.9 100 Si (37.5), K (30.6), Ca (31.9), Fe (4.7) 09-013WR 1 10–70 31610 9545 30.2 17.4 15.7 Ca (9.2), Fe (3.1) 09-013WRrpt 1 10–70 26892 8276 30.8 18.1 15.7 – 09-013 1 10–70 36229 8086 22.3 7.8 3.4 Ca (0.25), Fe (3.1) BOF-1 1 10–70 32519 5694 17.5 2.0 2 Ca (0.4), Fe (1.6) BOF-2 1 10–70 29839 4987 16.7 1.0 2 – BOF-3 1 10–70 31865 5615 17.6 2.1 2 – BOF-4(Al) 1 10–40 29915 5661 18.9 3.7 2 – Glass slide 1 10–40 31725 5672 17.9 2.4 0 – 09-012 2 10–40 69655 43454 62.4 – – – 09-023WR 3 10–50 84042 25174 30.0 21.0 17.3 – 09-023 3 10–40 92297 14267 15.5 4.5 2.9 – 09-012 3 10–50 108075 71131 65.8 61.8 100 – 09-012WR 3 10–40 109102 105908 97.1 97.3 100 – 09-013 3 10–40 100973 15791 15.6 4.7 3.4 – 09-013WR 3 10–50 79182 19925 25.2 15.6 15.7 – Glass slide 3 10–40 92527 10162 11.0 –0.6 0 – * Phase proportions; Ca = Ca-rich aluminosilicate, Fe = Fe-Ti oxide + pyroxene, K = sanidine, Si = quartz + tridymite. 2 † WR phase proportions represent phenocryst abundances. Groundmass mineral proportions are based on the 500 μm X-ray maps. WR Crystallinity % from X-ray maps are a sum of groundmass and phencryst proportions. ‡ Linear = total integrated counts above a linear background (amorphous and crystalline peaks); Cubic spline= integrated counts representing only the crystalline diffraction peaks. # CC/(CC + AC) = crystalline counts/(crystalline counts + amorphous counts). XRD corrected values calculated as described in the text for 1 and 3 s dwell times. for all X‑ray maps. The area of crystallites in a given X‑ray scan was determined using Image J software.
X‑ray fluorescence Both bulk separates and picked groundmass of the vitric and devitrified ignimbrite samples were analyzed by X‑ray fluorescence (XRF) to determine major element compositions. For whole-rock analyses, samples were cleaned of weathered material, crushed, and ground using standard techniques at Washington State University GeoAnalytical Laboratory. Samples were then diluted 2:1 with di-lithium tetraborate flux, doubly fused and analyzed on a ThermoARL XRF spectrometer.
Results Crystallinity determined by X‑ray diffraction analysis X‑ray diffraction patterns are commonly used in both polymer and food sciences to estimate the crystallinity of multicomponent (amorphous and crystalline) materials (e.g., Ruland 1964; Mohapatra et al. 1997; Cheetham and Tao 1998; Ramesh and Arof 2001; Karacan and Benli 2011; Ramesh and Lu 2011; Sormoli et al. 2012). The basis of the technique is that the diffraction pattern can be separated into two components: (1) sharp, distinctive peaks associated with crystalline material; and (2) a very broad or diffuse peak centered at ~25 °2Θ associated with amorphous material. The overall relative intensity (number of counts) associated with crystalline material is proportional to crystallinity. Thus, the relative crystallinity of the material can be calculated by dividing the diffraction pattern into these components. Integrating the total counts between 10–40 °2Θ above a linear background provides the total X‑ray counts associated with both the amorphous and crystalline components (Fig. 3). The integrated X‑ray counts associated with only the crystalline component is then determined by fitting a curved (cubic spline) background to the base of the peaks associated with crystalline components in the diffraction pattern. In this study, we utilize peak fitting and editing capabilities of the MDI Jade 8 software. The ratio of the integrated counts associated with the crystal-
F igure 3. Comparison of 1 and 3 s dwell times for sample 09‑013 for the interval 10–40 °2Θ demonstrating the effect of noise on the relative proportions of integrated counts for crystalline and amorphous components. The integrated region associated with the amorphous component is shaded in gray, representing linear-cubic spline counts from Table 2.
1690
ROWE ET AL.: DEVITRIFICATION OF RHYOLITES
line component to the total area above the linear background (amorphous + crystalline), therefore, provides an estimate of the relative crystallinity of the sample (Fig. 3). CSC/LC = CC/(CC+AC) = Relative Crystallinity (%)
(1)
where CSC and LC are the integrated counts above the cubic spline and linear backgrounds, respectively, and AC and CC are the counts associated with the amorphous and crystalline components, respectively. Early studies indicated that crystal defects (e.g., crystal-defect concept; Ruland 1964), dislocations, or trapped melt might result in the appearance of an amorphous component even in completely crystalline material. Therefore, estimates of crystallinity by this methodology would be a minimum. However, as we demonstrate in this work, this does not appear to have a significant effect on our estimates. Preferred orientation is often problematic for identifying phases and calculating mineral proportions in mixed samples. However, because preferred orientation of grains will increase one peak intensity at the expense of other peak intensities for that same phase, this should not impact the total integrated counts associated with crystalline material. Several experiments were conducted to test the robustness of this approach. Background noise is especially problematic in determining the crystallinity of predominantly glassy materials, where overall count rates are relatively low. Analysis of a glass plate (assumed to be completely amorphous) using 1 and 3 s dwell time has relative crystallinities (following Eq. 1) of 17.9% and 11% (Fig. 3). These “crystallinity” measurements are purely the result of noise in the scan and overall low-diffracted X‑ray intensities. Direct comparison of scans at 1 and 3 s dwell times indicate that relative crystallinity measurements are generally lower at higher dwell times, a result of lower background at longer dwell times. This effect is lessened at higher crystallinities, where greater number of counts associated with crystalline peaks minimizes the background. Note, that for the predominantly glassy samples (samples 09-013 and 09-023), the estimated crystallinity dropped by nearly a factor of 2 going from 1 to 3 s, whereas for higher crystallinity materials (sample 09-012) there is no discernable decrease in crystallinity estimates associated with longer dwell times (Table 2). To calibrate the relative crystallinity calculations (Eq. 1), a series of mixed powders (granite + glass) were prepared with crystallinities ranging from 0 to 100% (Fig. 4). Although volume estimates of crystallinity were the goal, and since granite has an average density very similar to silica glass, powders of each were mixed by weight. Results indicate a linear relationship, remarkably close to a 1:1 line, with the equations varying depending on dwell time: C(%)3s = 1.2185·(CSC/LC) – 19.378 C(%)1s = 1.21373·(CSC/LC) – 13.065
(2) (3)
where C(%) is the corrected crystallinity percentages at either 3 or 1 s dwell times. It should be noted that this calibration curve is highly dependent on positioning of the two background curves. It is therefore recommended that background positions for the calibration curve be assigned at the same time as the unknowns and by the same analyst to ensure internally consistent results.
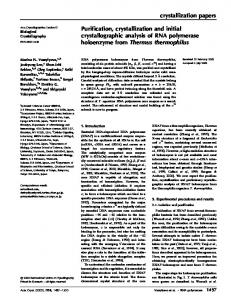
Figure 4. Calibration curve of calculated relative crystallinity (following Eq. 1) vs. ratio of mixtures of granite to glass by weight for 1 s (white squares) and 3 s (black diamonds) dwell times. Granite and glass have similar average densities such that the proportions of mixtures by weight are equivalent to volume. All scans are based on the same 2Θ range (10–40°) and step size (0.02°/step).
Figure 5. Repeat analysis of sample BOF vitrophyre. Analyses using glass plate substrates indicated in black and aluminum plate in gray. Scans are offset for comparison, but are otherwise at the same vertical scale. Indicated crystallinity values demonstrate the reproducibility of XRD measurements.
Repeats (including groundmass picking, grinding, and mount preparation) of a predominantly glassy sample (BOF) were analyzed using a 1 s dwell time. Crystallinity estimates of three repeats ranged from 1.0–2.1% (0.6 1σ) after background subtraction (Fig. 5). An additional analysis of sample BOF was made using an aluminum plate rather than the glass plate, resulting in an estimated crystallinity of 3.7%. Similarly sample 09-012 was analyzed using 1, 2, and 3 s dwell times producing an average measured relative crystallinity of 65 ± 2.3% (1σ; Table 2). The coarseness of the crushed sample also does not appear to significantly impact the estimated crystallinity. Sample 09-013
ROWE ET AL.: DEVITRIFICATION OF RHYOLITES
WR was analyzed twice, once crushed to sub-20 μm using a WC ring mill, whereas another coarser mount was prepared by hand crushing with mortar and pestle with no significant difference in calculated crystallinity between the two sample preparation techniques. Relative and corrected crystallinities are reported in Table 1. However, we will focus on corrected crystallinity values (using Eqs. 2 and 3). Basal (sample 09-013) and the upper vitrophyre
1691
(sample 09-023) have very similar groundmass crystallinities, ranging from ~4.5–4.7% at 3 s dwell times. At 1 s dwell times the crystallinity values are more variable (4.5–7.8%), likely a result of increased inaccuracy at low crystallinity resulting from signal noise. Whole-rock crystallinity (groundmass + phenocrysts) is more variable as a function of dwell time. For a 1 s dwell time, the upper vitrophyre contains ~26% crystals compared to 17.4% in the basal vitrophyre. With a 3 s dwell time, we see a similar
Figure 6. X‑ray diffraction patterns of groundmass separates and whole-rock samples. Groundmass profiles of the glassy samples (09-013 and 09-023 in b and f) are dominated by the broad peak associated with an amorphous component and minor peaks associated with plagioclase and/or pyroxene and Fe-Ti oxides compared to whole-rock XRD diffraction patterns (samples 09-013 and 09-023 in a and e have a higher proportion of plagioclase). XRD diffraction patterns for the devitrified whole rock (c) and groundmass (d) indicate a much higher crystallinity. Also note the significantly higher intensities associated with crystalline peaks. Major peaks are indicated by Pl (plagioclase), Sa (sanidine), Qz (quartz), Trd (tridymite), Px (pyroxene), and Mag (magnetite). Gray diffraction patterns in b, d, and f are the glass plate (100% amorphous) for comparison.
1692
ROWE ET AL.: DEVITRIFICATION OF RHYOLITES
discrepancy with 21% and 15.6% for upper (09-023WR) and basal (09-013WR) vitrophyre, respectively (Fig. 6; Table 2). Differences between 1 and 3 s dwell times for whole-rock samples may reflect greater noise at the 1 s dwell time, despite the correction using the calibration curve. Compared to the vitrophyre, the devitrified samples (samples 09-012 and 09-012WR) have a significantly greater relative crystallinity based on diffraction patterns. Groundmass crystallinity is very similar regardless of count time (61.9% 1 s, 61.8% 3 s). This is likely a result of decreased effect of signal increasing overall signal intensity. Whole-rock crystallinity values for these samples is also very similar at 97.7% (1 s) and 97.3% (3 s). Crystallinity determined by X‑ray mapping Crystallinity (area percentage) determined from X‑ray mapping using electron microprobe analysis produces a range of crystallinities dependant on the scale at which the X‑ray maps are collected. Crystallinity estimates from the 100 and 500 μm2 scans are determined from Fe (oxides and clinopyroxene) and Al (plagioclase; Fig. 7) X-ray maps; no phenocryst or groundmass quartz was observed. Calculated crystallinity for 09-013, 09-023, and BOF groundmass are similar for the 100 and 500 μm2 X‑ray maps (Table 2). Total crystallinity for 09-013 varies from 2.2 to 3.4%, and 09-023 varies from 3.9 to 2.9% (100 and 500 μm2, respectively). Differences between total crystallinity result from localized concentrations of Fe-Ti oxides and pyroxenes in the flow banding. Flow banding may induce a bias in crystallinity estimates from X‑ray maps. However, this affect is minimized by the bulk powder diffraction techniques. Crystallinity estimates for sample BOF range from 2.3 to 2% (100 and 500 μm2, respectively). Without simply assuming 100% crystallinity, the crystallinity of sample 09-012 groundmass is difficult to quantify based on X‑ray scans because of its devitrified nature (no residual glass). The chemical components of sample 09-012 groundmass will be presented below. Large scale X‑ray maps (1.024 × 2.048 cm) were used to estimate phenocryst concentrations (Fig. 7). Phenocryst proportions among the three samples are relatively similar, ranging from 12.3% (09-013WR) to 15.7% (09-012WR) and are dominated by clinopyroxene, plagioclase feldspar, and Fe-Ti oxides. Combining estimates from groundmass and phenocrysts results in a total crystallinity varying from 15.7% (09-013 WR) to 17.3% (09-023 WR; Table 2). Because of the groundmass crystallinity estimates, a combined crystallinity for sample 09-012WR would simply be 100%. Calculated crystallinity from X‑ray maps however is highly sensitive to image thresholding during conversion to a binary (black and white) image when using ImageJ software. Tests of image thresholding are presented in Appendix Figure 11. Geochemical estimates of crystallinity Within the Snake River Plain, the Tuff of Knob represents a relatively low-silica rhyolite with bulk SiO2 ranging between 71.2–72.6 wt% (n = 31, recalculated anhydrous). Little compositional variability exists in either major or trace elements within the Tuff of Knob as a whole, and between the glassy and devitrified samples (e.g., Table 1). The devitrified sample had a markedly higher original total (97.8% compared to ~96.4%) than either glassy sample. This discrepancy is likely due to perlitiza-
Figure 7. AlKα X‑ray maps for devitrified sample 09-012 (a–c) and basal vitrophyre sample 09-013 (d–f) showing the distribution of phenocryst phases (c, f) and groundmass phases (a,b,d,e). Note the distinctive devitrified groundmass texture observed in a and b. Bright regions show feldspars; dark regions are Al-deficient phases (Si phases, magnetite, pyroxene). From X‑ray imaging, the groundmass in a and b appears completely crystalline. Silica and feldspar phases are indicated in a. Also observed are fine-grained (f.g. in figure) regions dominated by Ca-rich aluminosilicate observed in both a and b. Plagioclase and oxide/pyroxene microlites are indicated in d. The proportion of feldspars, calculated as described in the text, is indicated for each image. Deposit item AM-12-065, Appendix Figure 1. Deposit items are available two ways: For a paper copy contact the Business Office of the Mineralogical Society of America (see inside front cover of recent issue) for price information. For an electronic copy visit the MSA web site at http://www.minsocam.org, go to the American Mineralogist Contents, find the table of contents for the specific volume/ issue wanted, and then click on the deposit link there. 1
ROWE ET AL.: DEVITRIFICATION OF RHYOLITES
tion of the glass. In all cases (both vitrophyre and devitrified interior), groundmass separates have compositions that are “more evolved” than their whole-rock compositions with higher SiO2 and K2O and with the rest of the major element oxides lower. In some cases, the drop in abundance of elemental oxides between the bulk sample and the separated groundmass is marked. For example, CaO decreases by about a factor of two between bulk and groundmass, illustrating the strong compositional control exerted by the abundant plagioclase on the bulk composition. In the case of the groundmass compositions, the devitrified sample has slightly higher Na2O and lower CaO and K2O than the glassy samples. Similar to the whole-rock samples, the devitrified groundmass separate has a higher original total (97.9% compared to ~95.2%) than the glassy separates (Table 1). Picked groundmass samples have compositions approaching those determined for glass by electron microprobe analysis. Despite the low-silica bulk-rock compositions, the glass compositions are high-silica rhyolites (normalized anhydrous, Table 1) that is typical of Snake River-type rhyolites as a whole. Interestingly, bulk geochemical analyses make no distinction between the vitrophyre and devitrified samples. This suggests that the process of pervasive devitrification in this case does not involve a significant gain or loss of chemical components either from vapor phase alteration or transport of alkalis. By comparing the compositions of the bulk-rock and picked groundmass samples to the glass compositions determined by electron microprobe analysis (microlite-free spots) we can derive mixing models to geochemically estimate the proportion of crystalline material in both the groundmass samples and the whole-rock samples (Fig. 8). Given that plagioclase and clinopyroxene dominate the mineral assemblage in the Tuff of Knob, a line between the average mineral compositions (as determined by EMPA) was constructed as the 100% crystalline end-member. By
Figure 8. Comparison of the geochemical characteristics of the glassy and devitrified samples. Simple three-component mixing model between phenocrysts from the Tuff of Knob and the glass (as determined by EMPA) indicate that the whole-rock samples contain ~20% phenocrysts (dominantly pyroxene and feldspar, which is also supported by petrography) and picked groundmass contains ~5–6% crystals (presumed to be predominantly microlites).
1693
plotting the compositions of bulk and groundmass samples on the same diagram, a line can be created between 0 and 100% crystallinity and used as an estimate of crystal content. Since plagioclase is the main phenocryst phase, we used the Al2O3 vs. SiO2 trend to generate crystallinity estimates with this geochemical method. The results suggest that the bulk rock samples contain ~20% crystals and the separated groundmass contains ~5–6% crystals (Fig. 8). In the case of the devitrified sample (sample 09-012), the crystallinity estimates from the geochemical approach refer to phenocrysts. The similarity between glassy and devitrified groundmass samples indicates that, prior to devitrification, the sample 09-012 groundmass had an initial crystallinity similar to the vitrophyre samples. Phase identification The only identifiable microlites present in groundmass scans of samples 09-023 and 09-013 are clinopyroxene, Fe-Ti oxides, and minor plagioclase feldspar as indicated from Fe and Al X‑ray mapping (Fig. 7). Potassium X‑ray mapping confirms the lack of sanidine as a phenocryst or groundmass phase in either glassy sample. The proportion of Fe-Ti oxide and clinopyroxene ranges from 3.1 to 1.9% (100–500 μm2) in 09-013, compared to plagioclase feldspar with abundances