Nat. Hazards Earth Syst. Sci., 9, 267–287, 2009 www.nat-hazards-earth-syst-sci.net/9/267/2009/ © Author(s) 2009. This work is distributed under the Creative Commons Attribution 3.0 License.
Natural Hazards and Earth System Sciences
Quantifying discontinuity orientation and persistence on high mountain rock slopes and large landslides using terrestrial remote sensing techniques M. Sturzenegger and D. Stead Department of Earth Sciences, Simon Fraser University, Burnaby, BC, Canada Received: 26 November 2008 – Revised: 30 January 2009 – Accepted: 30 January 2009 – Published: 3 March 2009
Abstract. This paper describes experience gained in the application of terrestrial digital photogrammetry and terrestrial laser scanning for the characterization of the structure of high mountain rock slopes and large landslides. A methodology allowing the creation and registration of 3-D models with limited access to high mountain rock slopes is developed and its accuracy verified. The importance of occlusion, ground resolution, scale and reflectivity are discussed. Special emphasis is given to the concept of observation scale and resulting scale bias and its influence on discontinuity characterization. The step-path geometry of persistent composite surfaces and its role in remote sensing measurements are described. An example of combined terrestrial digital photogrammetry and terrestrial laser scanning applied in the generation of a 3-D model of the South Peak of Turtle Mountain, the location of the Frank Slide, is presented. The advantages gained from the combined use of these techniques and the potential offered through long-range terrestrial digital photogrammetry, using high focal length lenses up to 400 mm is illustrated. Special emphasis is given to the potential of this specific technique, which has to the authors knowledge rarely been documented in the geotechnical literature.
1
Introduction
Terrestrial digital photogrammetry (TDP) and terrestrial laser scanning (TLS) are increasingly being recognized as efficient survey techniques for characterizing the earth surface morphology. McCaffrey et al. (2005) highlight the progress of digital geological fieldwork in terms of resolution, accuracy, Correspondence to: M. Sturzenegger (
[email protected])
data visualization, management and reproducibility. The combination of both airborne and terrestrial methods allows coverage of a wide range of observation scales and the ability to acquire data remotely; this makes it possible to overcome issues related to both accessibility and true representation of features. Applications in geosciences and geotechnics have been proposed by several authors. Rosser et al. (2005) highlight the benefits of topographic information provided by TLS surveys, compared to the plan view provided by traditional airborne survey. They emphasize the importance of such techniques in quantifying the spatial distribution and magnitude of rockfall events associated with coastal cliff erosion. Pesci et al. (2007a, b) demonstrate the suitability of laser scanning for monitoring both rapid morphological variations and physical changes of volcanoes and also integrate TLS and airborne digital photogrammetry to model an entire volcano. Nagihara et al. (2004) applied TLS to characterize the morphology of sand dunes. Teza et al. (2007, 2008) and Monserrat and Crosetto (2007) detail methodologies to measure landslide displacements and strain fields, based on the large amount of dense and accurate spatial information provided by terrestrial remote sensing techniques. Bellian et al. (2005) used TLS for stratigraphic modeling and Enge et al. (2007) to build petroleum reservoir models. Abellan et al. (2006) integrate TLS in the process of rock fall hazard assessment, emphasizing the collection of more accurate information on joint geometry, block volume and location, and rock fall trajectory. P¨otsch et al. (2006) show how discontinuity data measured on highwalls using TDP can be integrated into kinematic analysis. Finally, Tannant et al. (2006) recognize the potential of TDP for surveys in open-pit mine environment. Close range applications of terrestrial remote sensing techniques including discontinuity characterization on rock cuts has been documented by the present authors (Sturzenegger
Published by Copernicus Publications on behalf of the European Geosciences Union.
268
M. Sturzenegger and D. Stead: Long-range remote sensing discontinuity characterization on rock slopes
and Stead, 2009) and numerous other workers (Ferrero et al., 2008; Slob et al., 2005; Monte, 2004; Kemeny et al., 2006; Jaboyedoff et al., 2008; Haneberg, 2007, 2008; Gaich et al., 2006; Feng and R¨oshoff, 2004; Coggan et al., 2007; Birch, 2006; Poropat, 2006, 2008; Lato et al., 2009). The extension of such characterization to a longer range requires an investigation of the influence of scale effects. The present paper will initially focus on high mountain rock slopes in general and then describe in detail a large landslide surveyed from distances between one hundred meters and more than two kilometres. When characterizing rock mass discontinuities at such distances, questions regarding the accuracy, ground resolution and survey network building will arise. In addition, it will be important to understand which type of features can be mapped and what will be the effect of the observation scale on their measurements. Particular emphasis will be given to this concept, also termed “scale bias” by Ortega et al. (2005). After a brief description of the field methodology, some specific considerations about network setting, ground resolution, scale, accuracy and precision will be discussed. A detailed study concerning discontinuity orientation and persistence characterization using terrestrial remote sensing 3D models at scales up to 1:11 000 is followed by application to the South Peak of Turtle Mountain, location of the 1903 Frank Slide. The latter investigation demonstrates the benefits of combining TDP and TLS and highlights the potential of long-range TDP using high focal length lenses (up to 400 mm).
2
Field methodology
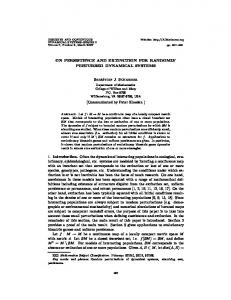
Characterization of high mountain rock slopes is often constrained by accessibility and safety issues. Consequently, terrestrial remote-sensing techniques represent promising alternatives/supplements to traditional rock engineering scanline or window mapping methods. The laser scanner used in this project is an Optech ILRIS-3D (Optech Inc., 2008) with data processing undertaken using the commercial code Polyworks (Innovmetric software, 2006). Digital photogrammetry data imagery is obtained using a Canon EOS 30D digital camera with varying focal length lenses and processed using the 3DM Calibcam/Analyst software (Adam Technology, 2007). An important component of terrestrial remote-sensing surveys is the registration of 3-D models. Depending on the purpose of the work the user may wish to survey control targets on the rock slope itself and this operation can quickly become the most time-consuming component of a project. Four alternative approaches using a differential GPS (DGPS), a reflectorless Total Station (TS) and/or a compass are proposed and compared (Table 1 and Fig. 1). Some of these approaches do not require access to the rock slope. Note that for the particular application of rock slope characterization, registration into the global reference system is not always necessary; all Nat. Hazards Earth Syst. Sci., 9, 267–287, 2009
that is required being to orientate a 3-D model relative to north in a local reference system. The registration devices used in this project are a single frequency Thales Promark3 DGPS (Thales Group, 2008) and a Topcon GPT-3002LW long range reflectorless total station (Topcon Positioning System Inc, 2008). The DGPS and TS precision are a few centimetres and a few millimetres, respectively. If used in reflectorless mode on natural features in a rock slope located a few hundreds meters away, the expected precision of the TS is in the order of a few centimetres (Lim et al., 2005) and its maximum range under optimal conditions is 1200 m (Topcon Positioning system Inc., 2008). Fieldwork has been performed at four locations in the Canadian Rocky Mountains (Table 2 and Fig. 2).
3
Survey planning, data acquisition and processing
This section briefly reviews the main parameters to consider when planning a TDP or TLS survey. Additional general considerations for the application of terrestrial remote sensing techniques to geological investigations can be found in Buckley et al. (2008). 3.1
Network setting
Ideally, the position(s) of the camera/scanner should be chosen to attain the expected resolution and accuracy, and to minimize the potential for occlusion and orientation bias with respect to both horizontal and vertical fields of view (Sturzenegger et al., 2007a). Consequently, a preliminary geological and structural geology survey of the rock slope should always be attempted. Topographic constraints in the field often limit the degree of flexibility in setting up a survey network. In particular, most of the rock slopes investigated can only be surveyed from below, access being limited to the foot of the mountain slopes. 3.2
Ground resolution
Spatial resolution in both photographic and nonphotographic remote sensing requires the use of the concept of a ground resolution cell (GRC), representing the size of a scene element, i.e. the dimensions on the ground of the basic element of the image (Rengers et al., 1992; Strandberg, 1967). For terrestrial remote-sensing techniques, this is the ground point spacing. For digital photogrammetry, ground point spacing depends on the step size, which quantifies the number of pixels used, both horizontally and vertically, to generate a spatial point. The ground pixel size should be multiplied by the step size to obtain the ground point spacing. Ground resolution is not a constant value, particularly on tilted aerial or terrestrial images. Several parameters, including incidence angle, reflectivity, stereomatching and changes www.nat-hazards-earth-syst-sci.net/9/267/2009/
M. Sturzenegger and D. Stead: Long-range remote sensing discontinuity characterization on rock slopes
269
Table 1. Registration approaches. Approach A
Compass measurement of the trend and plunge of the camera/scanner line-of-sight. Using TDP, the scale is provided by measurement of the distance between the two camera positions. The tilt must be zeroed. No access to the rock slope is required. The point precision and accuracy of this approach has not been tested over a distance larger than 300 m. However, a comparison of the orientation of four selected planes measured using approaches A, B and C shows consistent results (Table 4 and Fig. 4).
Approach B
Three or more photographs/scans are taken from three different positions and merged together; these positions are surveyed with the TS. No access to the rock slope is required. The point accuracy of this approach is lower than approach C-1 and C-2 as, since there is no control point in the neighbourhood of the rock slope, a small inaccuracy in the survey of the camera/scanner positions will propagate with the distance. However, measurements of discontinuity orientation are still valuable as shown in Table 4 and Fig. 4.
Approach C-1
Survey of about 6 targets on the rock slope, using a DGPS or TS. The position(s) of the camera/scanner can be incorporated, if available. This approach is the most accurate and precise.
Approach C-2
Survey using the reflectorless TS of about 6 natural recognizable and scattered features on the rock face. The position(s) of the camera/scanner can be incorporated, if available. No access to the rock slope is required.
possible to measure low to extremely high persistence discontinuities (ISRM, 1978; Sturzenegger and Stead, 2009). Terrestrial reflectorless surveying methods are best used on sub-vertical sections, while airborne techniques are superior for sub-horizontal landscapes.
Fig. 1. Registration approach set-up. The squares represent camera/scanner positions and the stars control points. The filled symbols or lines indicate measurement locations.
in perspective all may influence ground resolution. As a general rule, use of a slightly higher resolution (i.e. a slightly shorter ground point spacing) is recommended, so that there is enough redundancy to guarantee adequate interpolation of a 3-D model surface (Giussani and Scaioni, 2004). In digital photogrammetry, resolution is a function of the focal length, pixel size and the range, whereas for laser scanning, resolution depends on both beamwidth, which defines the footprint, and spot spacing. Lichti and Jamtsho (2006) combine these parameters in a measure called effective instantaneous field of view (EIFOV). The footprint represents the size of the area averaged in a single laser beam measurement and can be calculated using equations proposed by Giussani and Scaioni (2004). Excessively oblique scans, horizontally or vertically, should be avoided. Indeed, Pesci et al. (2007a) show that if the angle between the beam line-ofsight and the normal to the object surface is greater than 60◦ , the footprint decreases dramatically with increasing range. A similar logic can be used for digital photogrammetry surveys. McCaffrey et al. (2005) state that fine (cm) scale resolution allows the user to map stratigraphical contacts, meso-scale tectonic and sedimentary structures, or weathering and other surface processes. Terrestrial remote sensing techniques allow the characterization of sub-vertical slopes at a fine (cm) to very fine (mm) resolution. Such level of detail makes it www.nat-hazards-earth-syst-sci.net/9/267/2009/
3.3
Scale
On aerial and tilted photographs, in variable relief terrain, the scale can be measured at a specific location, but only approximated as an average scale over an entire area. For more details on scale calculation, refer to Wolf and Dewitt (2000). Equation (1) can be used to approximate terrestrial photographic scale (note that the scale does not change when zooming in or out, although it may help visually):
Savg =
f D
(1)
where f is the focal length and D the range. For example, outcrop scale is 1:600 with a 50 mm focal length at 30 m while the scale for a high mountain rock slope, at 500 m with f =200 mm, is 1:2500. A certain number of pixels are needed to recognize a feature in an image; the actual minimum number of pixels required varying according to the contrast between the feature and its background. If there is sufficient contrast, Soeters and van Westen (1996) suggest that on 1:50 000 (medium scale) aerial photos, the minimum size of a recognizable object is 25 m2 , and increasing to 6.5 m2 at a larger scale of 1:15 000. In addition, Sissakian et al. (1983) estimated that slope instability features, such as cracks, steps and depressions, should be 10 to 75 m long to be adequately recognized at 1:5000 scale and larger than 75 m to be identified at 1:10 000 scale. Nat. Hazards Earth Syst. Sci., 9, 267–287, 2009
270
M. Sturzenegger and D. Stead: Long-range remote sensing discontinuity characterization on rock slopes
Table 2. Rock slopes investigated. Name
Location
Rock type
Age
Structure
Imaged area: height/length
Turtle Mountain (Fig. 2a)
Highway 3, near Frank, Alberta
Livingstone Formation (Douglas, 1958). Thick beds of medium- to coarsely-crystalline limestone and medium-crystalline, porous dolomite which alternate as individual beds or in larger units with beds, of finely crystalline limestone, argillaceous dolomitic or cherty, and fine-grained dolomite.
Lower Carboniferous
Gentle slope with highly fractured rock, close to the hinge of an anticline; presence of tension cracks.
Mount Edith Cavell (Fig. 2b)
20 km south of Jasper, Alberta
Gog Group (Aitken, 1968). Thick units of very fine and fine-grained sandstone and quartzite.
Lower Cambrian
Bridal Veil Falls (Fig. 2c)
Highway 93, between Saskatchewan Crossing and Jasper, Alberta 20 km east of Jasper, Alberta
Medicine Lake (Fig. 2d)
3.4
Palliser Formation (Beach, 1943; Meijer Drees et al., 1993). Lower (Morro) Member: massive and resistant, cliff forming, grey and dark greyish brown mottled, dolomitic limestone. Upper (Costigan) Member: interbedded succession of dolostone, silty dolostone and fossiliferous limestone.
Precision and accuracy
In digital photogrammetry, the precision and accuracy of a stereomodel depend mainly on the network geometry (Fraser, 1996; Adam Technology, 2007), i.e. the relative positions of the camera and the object. In laser scanning, each manufacturer provides precision and accuracy specifications, which have been verified by Boehler et al. (2003) and Pesci et al. (2007a). Precision and accuracy will largely depend on registration of a 3-D model into a local or global reference system. Whenever possible, it is recommended to measure a few reference points in the neighbourhood of the rock slope in order to evaluate precision and accuracy. Using the TS survey as the base case, the authors tested the accuracy (mean error) and precision (standard deviation) of varying techniques and registration approaches (see Lane et al., 2000) at Bridal Veil Falls and Turtle Mountain (Table 3 and Fig. 3), with a range of 430 m and 2100 m, respectively. Note that no correction for earth curvature and refraction has been applied, because their effect would be insignificant at the present range (Topcon Positioning system Inc., 2008). The results show that approach C-1 and C-2 are the most accurate and precise with an average mean error of 0.1, 0.05 and −0.03 m and an average standard deviation of 0.28, 0.15 and 0.17 m in the X-, Y- and Z-directions, respectively. The Nat. Hazards Earth Syst. Sci., 9, 267–287, 2009
Upper Devonian
Average range
(m)
Average slope dip/dip direction (◦ )
80/100
42/111
100
Very brittle and intensively fractured rock; anaclinal slope.
160/240
72/053
550
Steep anaclinal rock slope, with overhanging blocks.
65/145
87/191
430
Structure dominated by bedding planes, subparallel to the rock slope face; 2 or 3 sets of cross joints form lateral and upper release fractures.
7/15
55/226
23
(m)
point accuracy and precision of approach B is significantly lower, with an average mean error of 2.91, 7.00 and 0.02 m. and an average standard deviation of 0.47, 0.49 and 0.74 m in the X-, Y- and Z-directions, respectively. Table 4 and Fig. 4 show good consistency in the plane orientation measurements achieved using the different techniques and registration approaches. With the exception of the dip angle of plane D, all concentrations have very high Fisher’s K values, corresponding to maximum dip and dip direction variations with respect to the mean of 3.3◦ and 5.1◦ , respectively. The dip angle variability of plane D is relatively high, 5.2◦ , but still adequate for many engineering purposes. Note that planes B and C could not be measured with TDP (f =400 mm), because they lie outside the sampling window. In addition, plane accuracy could not be evaluated at a range of 2100 m (on Turtle Mountain), because insufficient data were available. 3.5
Reflectivity
Because laser scanners emit their own light, they have specific limitations related to object roughness and reflectivity (Optech Inc., 2008). Pesci et al. (2007a) achieved a successful laser scanner survey on low reflectance volcanic rocks at a range of 600 m. Sturzenegger et al. (2007a) reported rewww.nat-hazards-earth-syst-sci.net/9/267/2009/
M. Sturzenegger and D. Stead: Long-range remote sensing discontinuity characterization on rock slopes
271
Fig. 2. Field localities. (a) Turtle Mountain, (b) Mount Edith Cavell, (c) Bridal Veil Falls, (d) Medicine Lake, (e) map of western Canada with the field locations.
flectivity issues on dark and wet rock masses at distances of 600 m and 300 m, respectively. TLS tests at a coal mine, in south-eastern British Columbia, provided the limitation of the ILRIS-3D laser scanner on a typical low-reflectance rock mass. Results showed that, on coal, reflectivity issues can occur at a range of 350 m and point cloud data are unreliable beyond 450 m. On brighter rock masses, however, the range extends up to about 800 m. 4
Characterization of discontinuity orientation and persistence
The present work focuses on the characterization of discontinuity orientation and persistence. For details on roughness characterization using remote-sensing techniques, the www.nat-hazards-earth-syst-sci.net/9/267/2009/
reader should refer to Haneberg (2007), Poropat (2008) and Sturzenegger and Stead (2009). Research on quantification of spacing, intensity and block size is ongoing and outside the scope of the current paper. Field-based discontinuity characterization along scanlines (or windows) requires a large enough area to be mapped in order to obtain a statistically significant sample. In addition, it is recommended to map different exposures in order to avoid orientation bias (ISRM, 1978; Priest, 1993). The procedure is similar in 3-D LiDAR and photogrammetric models where discontinuity orientation and persistence measurements are achieved by manually fitting planes on recognizable surfaces and traces using the commercial codes Polyworks (Innovmetric software, 2006) and 3DM Analyst (Adam Technology, 2007), respectively. Discontinuity characterization requires skilled interpretation by a rock mechanNat. Hazards Earth Syst. Sci., 9, 267–287, 2009
272
M. Sturzenegger and D. Stead: Long-range remote sensing discontinuity characterization on rock slopes
Fig. 3. Accuracy (a) and precision (b) of the registration approaches used at Bridal Veil Falls and Turtle Mountain (TDP using varied focal lengths).
Table 3. Accuracy (me=mean error) and precision (sd=standard deviation) of the registration approaches used at Bridal Veil Falls and Turtle Mountain (TDP using varied focal lengths). Technique/f
TDP 100 mm TDP 200 mm TLS TDP 50 mm TDP 100 mm TDP 200 mm TDP 400 mm TDP 400 mm TDP 400 mm
Registration approach B B C-2 C-2 C-2 C-2 C-2 B C-1
Range
X me
Y me
Z me
X sd
Y sd
Z sd
(m)
(m)
(m)
(m)
(m)
(m)
(m)
430 430 430 430 430 430 430 2100 2100
1.49 −1.12 0.00 0.06 −0.21 −0.01 0.49 8.37 0.29
4.81 2.95 0.00 0.00 0.06 0.05 −0.16 13.22 0.33
5.59 0.64 0.01 −0.03 −0.30 −0.02 0.30 −6.16 −0.13
0.43 0.18 0.07 0.17 0.38 0.31 0.25 0.80 0.47
0.36 0.74 0.18 0.12 0.08 0.19 0.25 0.36 0.09
0.99 0.92 0.08 0.16 0.20 0.15 0.19 0.31 0.23
ics engineer or geoscientist. Circular planes are assumed and discontinuity parameters including dip, dip direction and persistence are derived (Sturzenegger and Stead, 2009) where the latter is calculated as the area of a circle whose diameter is termed the “equivalent trace length”. Figure 5a illustrates this process on a detailed view from a point cloud of the Bridal Veil Falls rock slope. Each spatial point has a greyscale intensity value, which helps in distinguishing morphological features. Figure 5b shows the equivalent result on a stereomodel draped with a digital photograph. Large and/or multiple windows were used in order to ensure that enough measurements could be made and to avoid orientation bias. The white rectangles on Fig. 5 show the windows used at Bridal Veil Falls and the black rectangles on Fig. 6a the windows at Mount Cavell. Field measurements achieved on selected discontinuities at the foot of the Mount Cavell rock slope show that three orthogonal sets Nat. Hazards Earth Syst. Sci., 9, 267–287, 2009
are present with a mean discontinuity trace length of 1.99 m (Fig. 6b). Close-range TDP, with a 20 mm focal length, was also undertaken at locations A and B (Fig. 6a). 4.1
Observation scale
At Bridal Veil Falls and Mount Edith Cavell, a series of 3D models with increasing ground resolution have been built. The ground resolution of the TLS point clouds is determined by varying the laser beam spot spacing value. Different focal lengths (f =20, 50, 200 and 400 mm) are used for the digital photogrammetric survey. The objective is to investigate the effect of observation scale on the results of the characterization of discontinuity orientation and persistence over constant sampling windows, by varying ground resolution. Preliminary results concerning the effect of the measurement scale on discontinuity roughness have been reported by Poropat (2008). 4.1.1
Effect of observation scale on orientation measurements
Orientation measurements obtained for the different ground resolutions are shown in Figs. 7 and 8, at Bridal Veil Falls and Mount Edith Cavell, respectively. Figure 7 shows that high resolution 3-D models clearly display the bedding, two sets of cross joints (J1 and J2) and an additional joint set (J3) (Fig. 7b and d). At a lower resolution, however, while the persistent bedding planes still clearly appear, J2 and J3 are poorly defined (Fig. 7a and c). Consequently, there is a scale orientation bias resulting from the choice of resolution. Figure 8 shows a fracture network with bedding planes and 2 sets of cross joints. Window 1 is located in a different domain from the other windows. Windows 1 and 2 display www.nat-hazards-earth-syst-sci.net/9/267/2009/
M. Sturzenegger and D. Stead: Long-range remote sensing discontinuity characterization on rock slopes
273
Table 4. Orientation of selected planes measured with the different techniques and registration approaches at Bridal Veil Falls, range=430 m. Technique/f
Registration approach
Plane A Dip (◦ )
TLS A TDP 50 mm B TDP 100 mm B TDP 200 mm B TLS C-2 TDP 50 mm C-2 TDP 100 mm C-2 TDP 200 mm C-2 TDP 400 mm C-2 Mean orientation Fisher’s K
23.8 24.6 25.7 23.4 23.7 28.3 23.5 24.7 22.5 25 1322
Plane B
Dip direction (◦ )
Dip
38.8 38.0 31.9 37.3 39.7 32.7 40.7 39.4 36.5 37
86.1 84.1 84.1 83.9 88.3 84.9 84.8 87.2 n/a 86 896
(◦ )
Plane C
Dip direction (◦ )
Dip
69.4 68.3 73.3 69.2 71.8 67.4 67.5 70.5 n/a 69
77.9 78.9 76.5 76.1 77.8 78.2 78.2 76.3 n/a 78 3391
(◦ )
Dip direction [v] 142.7 144.8 142.3 143.7 143.6 144.1 141.0 142.9 n/a 143
Plane D Dip (◦ ) 76.3 75.3 69.8 74.1 79.0 74.8 71.3 72.7 76.2 75 523
Dip direction (◦ ) 189.6 189.5 189.5 190.4 192.1 190.2 193.7 189.4 185.8 190
only two sets each; an additional window on a different exposure being necessary in order to compensate for orientation bias. Comparing the results obtained at varying resolutions for each window separately, very similar discontinuity sets can be recognized. However, a careful look at set J3 measured with TDP 50 mm in window 1 reveals a difference of 9 degrees in dip direction, compared to the average values obtained with the other resolutions. Similarly, there is a difference of 9 degrees in dip direction on set J1 in window 3. In addition, in window 1, the 400 mm digital photogrammetry model allows characterization of the non-persistent discontinuity set J2, which was not clearly recognized on lower resolution 3-D models. These observations at Mount Edith Cavell confirm the possibility of additional orientation bias related to the observation scale, i.e. scale bias, when using low resolution 3-D models. It shows that this observation scale effect can result in both a lack of measurements for a discontinuity set (Fig. 7) and a shift in discontinuity set orientation (Fig. 8). 4.1.2
Effect of observation scale on persistence measurements
Table 5 summarizes the results of persistence measurements obtained at Bridal Veil Falls and Mount Edith Cavell, highlighting differences in mean, minimum and maximum equivalent trace length. An effort was made to map the majority of recognizable and practically measurable discontinuities. As would be expected, the measured equivalent mean trace length increases with an increase in the ground point spacing; at each ground resolution, traces shorter than the minimum equivalent trace length being truncated. This truncation is the first effect of scale bias on discontinuity persistence measurements, i.e. non-recording of a certain persistence range.
www.nat-hazards-earth-syst-sci.net/9/267/2009/
Fig. 4. Stereonet (lower hemisphere, equal area projection) of the measurements of planes A to D, made with the various techniques.
3-D model resolution can have a second scale bias effect on discontinuity persistence measurement in that discontinuities considered as extremely persistent when measured at low resolution may in fact be subdivided into a series of shorter discontinuities, this only being recognizable at higher resolution (Fig. 9). Such a step-path geometry is described in more detail in Sect. 4.2. For each 3-D model, equivalent trace length measurements follow a negative exponential distribution. Results displayed in Table 5 are plotted in Fig. 10 and Fig. 10a shows the minNat. Hazards Earth Syst. Sci., 9, 267–287, 2009
274
M. Sturzenegger and D. Stead: Long-range remote sensing discontinuity characterization on rock slopes
Fig. 5. Discontinuity characterization on 3-D models. (a) TLS point cloud, rendered with greyscale intensity values, (b) photogrammetric stereomodel, draped with a digital photograph. The white rectangles indicate the sampling windows used with TLS, TDP 50 mm and TDP 200 mm. The white dashed line indicates the sampling window used with TDP 400 mm. The black squares illustrate how discontinuities are mapped through a detailed 3-D view of the rock slope.
imum equivalent trace lengths, which can be measured depending on both the ground resolution and scale. Figure 10b shows the mean equivalent trace lengths. Both graphs show that, based on the limited amount of available data, the trace length measurements fit approximately a linear trend line. Figure 10c shows that mean equivalent trace length measure-
Nat. Hazards Earth Syst. Sci., 9, 267–287, 2009
ments provide a better fit to power laws, when they are subdivided according to the rock type. Equations (2) and (3) are derived from the linear trend lines. Ground point spacing = 0.145 ∗ minimum equivalent trace length (2)
Ground point spacing = 0.023 ∗ mean equivalent trace length (3)
www.nat-hazards-earth-syst-sci.net/9/267/2009/
M. Sturzenegger and D. Stead: Long-range remote sensing discontinuity characterization on rock slopes
275
Fig. 6. The Mount Cavell rock face. (a) Windows 1, 2 and 3, where discontinuity characterization of 3-D models was undertaken. “A” is the location of field measurements. “A” and “B” are the locations of close-range 20 mm TDP. (b) Discontinuity orientation and trace length measured by hand at station A.
4.2
Step-path geometry
High resolution 3-D models are particularly helpful in the observation of composite surfaces characterized by a steppath geometry. Characterization of step-path surfaces using TLS has been undertaken by Yan (2008). In this study, two www.nat-hazards-earth-syst-sci.net/9/267/2009/
main types of step-path geometries were observed. The first one, on Mount Edith Cavell (Figs. 9, 11a and b), shows a series of closely-spaced, sub-parallel, non-persistent discontinuities linked by an intact rock bridge. Once the intact rock bridge has failed, a persistent composite release surface or discontinuity surface may be created. This type of geometry
Nat. Hazards Earth Syst. Sci., 9, 267–287, 2009
276
M. Sturzenegger and D. Stead: Long-range remote sensing discontinuity characterization on rock slopes
Fig. 7. Stereonets (lower hemisphere, equal area projection, first contour=3%, interval=2% per 1% area) of Bridal Veil Falls rock slope, obtained from 3-D model discontinuity characterization. (a) TLS low resolution, (b) TLS high resolution, (c) TDP f =50 mm lens, (d) TDP f =200 mm lens. Table 5. Characterization of persistence. Location
Medicine Lake Bridal Veil Falls Bridal Veil Falls Bridal Veil Falls Bridal Veil Falls Bridal Veil Falls Mt. Edith Cavell Mt. Edith Cavell Mt. Edith Cavell Mt. Edith Cavell Mt. Edith Cavell Mt. Edith Cavell
Technique/f
TLS TDP 50 mm TDP 200 mm TDP 400 mm TLS TLS TDP 20 mm TDP 50 mm TDP 200 mm TDP 400 mm TLS TLS
Range (m)
Ground point spacing (m)
23 430 430 430 440 430 6 550 550 550 550 550
0.013 0.442 0.110 0.055 0.321 0.080 0.015 0.560 0.140 0.070 0.180 0.090
has also been observed in the Palliser Formation limestone, on the Cirrus Wall, 5km south of Bridal Veil Falls. A series of 10 m persistent, 1–2 m spacing, sub-horizontal bedding planes create the upper release surface of a large failure or series of failures (Fig. 12). Nat. Hazards Earth Syst. Sci., 9, 267–287, 2009
Mean eq. trace length (m) 2.24 11.83 5.76 3.97 9.82 7.00 1.15 22.61 13.83 6.82 8.58 5.05
Min. eq. trace length (m) 0.30 2.00 0.50 0.39 3.00 1.00 0.16 2.86 1.55 0.92 1.60 1.00
Max. eq. trace length (m) 17.40 45.00 44.00 52.44 46.00 66.00 5.72 158.74 87.74 70.75 56.01 44.01
The second type of step-path geometry, observed in the Medicine Lake outcrop (Fig. 13), is characterized by a combination of two sub-perpendicular discontinuity sets and some intact rock bridges. As for the previous type, the entire discontinuity system provides the potential for persistent www.nat-hazards-earth-syst-sci.net/9/267/2009/
M. Sturzenegger and D. Stead: Long-range remote sensing discontinuity characterization on rock slopes
277
Fig. 8. Discontinuity orientation measurements at Mount Cavell (Stereonets, lower hemisphere, equal area projection, first contour=3%, interval=2% per 1% area). No measurements in windows 2 and 3 were done with TDP 400 mm.
www.nat-hazards-earth-syst-sci.net/9/267/2009/
Nat. Hazards Earth Syst. Sci., 9, 267–287, 2009
278
M. Sturzenegger and D. Stead: Long-range remote sensing discontinuity characterization on rock slopes Table 6. Accuracy (mean error) and precision (standard deviation) of the composite 3-D model of South Peak, Turtle Mountain, Alberta.
Mean error (m) Standard deviation (m)
Northing
Easting
Elevation
0.141 0.490
−0.057 0.603
−0.084 1.224
Table 7. Discontinuity orientation and persistence characterization on the South Peak using terrestrial remote-sensing. 5 meters
Set name
Fig. 9. Apparently persistent feature at low resolution (white line) comprising a step-path of low persistence steeper discontinuities (black lines).
1 : 10000
0.500 2 R = 0.76 0.400
1 : 8000
0.300
1 : 6000
0.200
1 : 4000
0.100
1 : 2000
0
1
1.5
2
2.5
3
3.5
Minimum trace length Minimum eq. eq. trace length [m] 2 R = 0.74
0.500
Medium-extremely high Medium-very high High Very high-extremely high Medium-high
composite release surfaces. The example shown in Fig. 13 illustrates this with two sets of low persistence cross joints, sub-perpendicular to bedding and intact rock bridge length of up to 2 m. More complex step-path geometries, involving a larger amount of intact rock brittle fracture are described by Yan (2008).
1 : 10000
0.400
1 : 8000
0.300
1 : 6000
0.200
1 : 4000
0.100
1 : 2000
0
5
5
10
15
20
25
Mean eq. Mean eq.trace tracelength length [m] [m] 0.600
1 : 12000 1 : 10000
0.500 2 R = 0.95
0.400
2 R = 0.91
1 : 8000 1 : 6000
0.300
1 : 4000
0.200 limestone quartzite
0.100
Scale Scale
Ground Groundpoint pointspacing spacing [m] [m]
287 342 071 130 173
(◦ )
1 : 12000
0.600
Scale Scale
Ground [m] Groundpoint point spacing spacing [m]
0.5
0.000
(c)
Persistence
1 : 12000
0.000
(b)
45 88 73 76 63
Mean dip direction (◦ )
Observation scale Observation 0.600
Scale Scale
Ground spacing[m] [m] Ground point point spacing
(a)
S0 J1 J2 J3 J4
Mean dip
1 : 2000
0.000 0
5
10
15
20
25
Mean eq. Mean eq.trace tracelength length [m] [m]
Fig. 10. Plots showing the relationship minimum (a) and mean trace length (b and c) versus ground point spacing and scale. Plot “c” shows that for both limestone and quartzite data a better fit is provided by a power law.
Nat. Hazards Earth Syst. Sci., 9, 267–287, 2009
Composite terrestrial 3-D model of the South Peak of Turtle Mountain
Turtle Mountain (Fig. 14a), the site of the 1903 Frank Slide, has been subject of numerous recent studies, as outlined by Froese and Moreno (2006). Conventional field-based mapping, using intrusive and non-intrusive methods have been applied (Cruden and Krahn, 1973; Fossey, 1986; Couture, 1998; Spratt and Lamb, 2005; Theune et al., 2005; Langenberg et al., 2006). Airborne remote-sensing techniques, including SAR and InSAR methods (Singhroy and Molch, 2004; Singhroy et al., 2005; Mei et al., 2008), photogrammetry (Jaboyedoff et al., 2009) and LiDAR (Sturzenegger et al., 2007b) have been used to monitor motion or characterize both the mountain and the morphology of the debris. The structure and geology of Turtle Mountain has been described by Cruden and Krahn (1973) and further detailed by Langenberg et al. (2006). It is formed by the Turtle Mountain Anticline, which is underlain by the Turtle Mountain thrust fault. Above this fault, a minor thrust fault has been observed. The failure surface of the slide locally follows bedding planes located to the east of the anticline hinge. At the toe, the failure surface follows the minor thrust fault and at www.nat-hazards-earth-syst-sci.net/9/267/2009/
M. Sturzenegger and D. Stead: Long-range remote sensing discontinuity characterization on rock slopes
279
Table 8. Summary of scale bias effects on discontinuity orientation and persistence measurements. Scale bias (or observation scale) Effect on discontinuity orientation measurements.
Effect on discontinuity persistence measurements
Truncation of non-persistent discontinuity sets resulting in orientation bias (Fig. 7).
Truncation of non-persistent discontinuities, small compared to ground point spacing.
Shift in discontinuity orientation, because of smoothing of step-path geometries (Figs. 8 and 9).
Overestimation of the length of extremely persistent features actually composed of a combination of both smaller discontinuities and intact rock fracture. This results from the smoothing of the step-path geometries at low resolution (Fig. 9).
Fig. 11. First type of step-path geometry, observed on Mount Edith Cavell. A series of closely-spaced, sub-parallel, non-persistent discontinuities are linked by a narrow intact rock bridge. Discontinuity mapping on a TLS point cloud, rendered using greyscale intensity values.
the top, it is controlled by a combination of two or three joint sets and intact rock fractures (Jaboyedoff et al., 2009). Jones (1993) interprets the minor fault as a folded thrust fault and explains that a wedge formed by its intersection with bedding planes creates unstable blocks on the eastern flank of Turtle Mountain. Consequently, the structural geology of the mountain becomes extremely sensitive to triggering factors; freezing and thawing, river erosion at the toe and mining at the base all having been proposed (Cruden and Martin, 2007; Benko and Stead, 1998). The purpose of the present project is to create a terrestrial 3-D model of the South Peak of Turtle Mountain to complement the existing airborne LiDAR DEM. The ground resolution of the latter on flat terrain is about 0.5 m, however, due to the vertical line-of-sight, this may decrease up to 3 m www.nat-hazards-earth-syst-sci.net/9/267/2009/
particularly on sub-vertical slopes. Such a resolution will result in the truncation of medium to high persistence discontinuities. In contrast, with a sub-horizontal line-of-sight, a terrestrial 3-D model provides a higher ground resolution on sub-vertical slopes (up to 40 mm for TLS and 96 mm for TDP with an f =400 mm lens), Preliminary observations using terrestrial and airborne LiDAR on Turtle Mountain were presented in a previous paper by the authors (Sturzenegger et al., 2007b). 5.1
Composite TDP/TLS model creation
To create the terrestrial 3-D model, a combination of TDP and TLS was used, thereby using the advantages of one technique to mitigate the limitations of the other. TLS is more Nat. Hazards Earth Syst. Sci., 9, 267–287, 2009
280
M. Sturzenegger and D. Stead: Long-range remote sensing discontinuity characterization on rock slopes
Fig. 12. The Cirrus Wall. (a) Photograph of the base of the wall, highlighting an upper release surface, (b) TLS point cloud, rendered using greyscale intensity values (white spots indicate no TLS measurement), showing characterization of the step-path geometry.
convenient to undertake on narrow ridges, with limited vantage points, between which important changes in perspective occur. Using TLS, a single position is enough to create a point cloud of the scene. However, the TLS range is limited to about 800 m, while the east facing scar of Turtle Mountain must be imaged from a distance greater than 2km. Consequently, TDP with a high focal length (f =400 mm) provides an ideal solution.
Nat. Hazards Earth Syst. Sci., 9, 267–287, 2009
The final 3-D model was built by merging point clouds and stereomodels created from 6 TLS and 4 TDP locations (Figs. 14b and 15a). Registration was achieved by surveying camera/scanner locations and 8 large high contrast coloured targets with a DGPS. The accuracy and precision of the composite 3-D model is detailed in Table 6, estimated by comparison with the DGPS survey, which has a centimeter accuracy. Several parameters contribute to the overall model error, including the inherent accuracy of the laser scanner, the stereo-
www.nat-hazards-earth-syst-sci.net/9/267/2009/
M. Sturzenegger and D. Stead: Long-range remote sensing discontinuity characterization on rock slopes
281
Fig. 13. Second type of step-path geometry, observed at the Medicine Lake outcrop. The composite surface is composed of a combination of two sub-perpendicular discontinuity sets and some intact rock fracture. Discontinuity mapping on TLS point clouds, rendered using greyscale intensity values.
model creation process, alignment of successive models and target recognition. The main error component in the current project resulted from the alignment process, as the challenging mountainous terrain made it sometimes impossible to obtain optimal overlap between successive adjacent models. The quality of the composite 3-D model is evaluated by overlaying and comparing it with the airborne LiDAR DEM. To accomplish this, the shortest distance between each point on the 3-D models and the reference airborne LiDAR DEM are computed and displayed as an error map. Figure 15b www.nat-hazards-earth-syst-sci.net/9/267/2009/
shows that, with the exception of a few limited areas, the two models match very well (errors up to 2–3 m). Locally, errors up to 5 meters occur due to scattered large boulders, gullies and trees, which could not be filtered out. The terrestrial composite 3-D model has a higher ground resolution, but is frequently affected by occlusion zones at the very top of the peak, behind trees and protruding blocks, or along cracks and gullies. Depending on access, these occluded areas could be, in the future, mapped in more detail, using close-range TDP or TLS surveys. Nat. Hazards Earth Syst. Sci., 9, 267–287, 2009
282
M. Sturzenegger and D. Stead: Long-range remote sensing discontinuity characterization on rock slopes
Fig. 14. Turtle Mountain. (a) East side with the limit of the slide (white dashed line), (b) contour map of the mountain with the locations of the TDP (black dots) and the TLS (black stars).
(a)
(a)
20 meters
30 meters
(b)
N
Occlusion zones
5
[m]
(b)
2.5
0
5 meters
-2.5 50 meters
~ 5 meters errors
-5
Fig. 15. Composite 3-D model of the South Peak. (a) Oblique view of the NE side, displayed using ArcScene (ESRI Inc.), (b) plane view of the error map of the whole model.
Nat. Hazards Earth Syst. Sci., 9, 267–287, 2009
Fig. 16. Components of the composite terrestrial 3-D model of the South Peak. (a) photogrammetric stereomodel (draped with a digital photograph) of the upper part of the NE side of the peak (scar) built using a f =400 mm lens from a distance of 2.1 km, (b) TLS point cloud (rendered using greyscale intensity values) of the SE side of the peak, surveyed from a distance of 150 m.
www.nat-hazards-earth-syst-sci.net/9/267/2009/
M. Sturzenegger and D. Stead: Long-range remote sensing discontinuity characterization on rock slopes
283
Fig. 17. Discontinuity characterization. (a) stereonet (lower hemisphere, equal area projection, first contour=3%, interval=2% per 1% area), (b) equivalent trace length distribution, (c) symbolic pole plot of persistence class (ISRM, 1978).
5.2
Discontinuity mapping
A major advantage of the terrestrial 3-D model is that it allows recognition of medium and higher persistence discontinuities located on oblique to sub-vertical rock slopes, such as the failure surface and lateral boundaries of the slide, where airborne LiDAR DEM resolution is in contrast more limited. Discontinuity characterization was achieved using both the f =400 mm photogrammetric stereomodel built from the base of the mountain, at a range of 2.1 km, and the close-range TLS point cloud created from locations around the mountain peak. Figure 16 shows selected details of these two components of the composite 3-D model. www.nat-hazards-earth-syst-sci.net/9/267/2009/
Discontinuity characterization covers the upper part of the South Peak above an elevation of 2000 m, in the Livingstone Formation (Tables 2 and 7). Figure 17a shows that bedding planes are clearly recognized and that cross joints have a large variability of orientations. Medium to very high persistence structures were mapped (Fig. 17b). Discontinuity sets J1 and J2 described by Couture (1998) and Spratt and Lamb (2005) can be recognized. S0, J2 and J4 sets were mapped by Brideau (M.-A. Brideau, personal communication, 2008). Discontinuity set J3 has not been mapped in the field by other authors, however, it was recognized on airborne DEM by Jaboyedoff et al. (2009) with a lower dip. Two possible reasons can explain this; firstly, discontinuity set J3 was
Nat. Hazards Earth Syst. Sci., 9, 267–287, 2009
284
M. Sturzenegger and D. Stead: Long-range remote sensing discontinuity characterization on rock slopes
mapped on the East facing scar of the South Peak, where there is very limited access for field mapping. In addition, Fig. 17c shows that most of the J3 discontinuities are very high to extremely high persistence surfaces (ISRM, 1978). It is possible that these surfaces represent, as discussed previously composite surfaces, combining both joints and intact rock fractures with a step-path geometry. Such features are not observed during field survey, which focus on lower persistence joints.
6
Discussion
This paper evaluates techniques for quantifying discontinuity orientation and persistence on high mountain rock slopes and large landslides using terrestrial digital photogrammetry and terrestrial laser scanning. The methodology is described and evaluated on a large cliff at Bridal Veil Falls where it is shown that the choice of registration method does not significantly affect plane orientation measurements. The accuracy obtained is considered adequate for discontinuity characterization on high mountain rock slopes where significant issues relate to safety, access and true representation of discontinuity networks. The potential for occlusion and orientation bias must always be considered in remote sensing discontinuity measurements as topographical constraints will frequently prevent the optimal location of the camera/scanner. It is strongly recommended that remote-sensing methods be combined with conventional geological and structural observations and other techniques wherever possible in order to obtain comprehensive datasets. The second part of the paper evaluates the effect of observation scale on orientation and persistence measurements using 3D LiDAR/photogrammetric models with varying ground resolutions. It is shown that scale bias can result in both a lack of measurements for a specific discontinuity set and a shift in discontinuity set orientation. In the first case, there is an orientation bias, when, at low resolution, non-persistent discontinuity sets are truncated and consequently do not appear on stereonets, their persistence being too small compared to the point spacing. The truncation threshold decreases with increasing resolution, such that when mapping from higher resolution 3-D models, discontinuities which did not appear at lower resolution can now be recognized and measured. Consequently, the minimum and mean trace length of discontinuities increases with decreasing ground resolution. The second case follows as direct consequence of the truncation of specific joints due to resolution/scale-based orientation bias. As resolution decreases, the rock slope texture is smoothed, resulting in a shift in orientation. This second effect is illustrated on Fig. 9, which shows that a large feature dipping at about 45◦ is actually composed of multiple low persistence joints, dipping more steeply. At low resolution, the ground point spacing is too large to enable mapping of Nat. Hazards Earth Syst. Sci., 9, 267–287, 2009
the low persistence joints and consequently, only the average 45◦ dipping feature will be sampled. This effect typically occurs on step-path surfaces trending at a small angle with respect to the line-of-sight of the camera/scanner. Measuring such surfaces results in overestimation of persistence. The effects of scale bias on discontinuity orientation and persistence measurements are summarized in Table 8. The preliminary empirical Eqs. (2) and (3), derived from the trend lines of Fig. 10, can be used as a planning tool to estimate an average persistence of discontinuities, which can be characterized with specific ground point spacing. Conversely, they can also be used to select an adequate lens focal length/spot spacing in order to characterize discontinuities of a certain size. Figure 10c suggests that the ground resolution/mean trace length relationship varies according to the rock type and is best fitted by a power law. Although the R 2 values are high, it is emphasised that the trend lines are derived from a limited amount of values and more research on a variety of rock types is required to complement these results. As stated previously, at low ground resolution, some structural features could be mistaken as extremely persistent discontinuities, while in reality they represent composite steppath surfaces containing a series of non-persistent discontinuities. In this paper, two types of step-path geometry are described from LiDAR and photogrammetric models. The question of which persistence value, i.e. which ground resolution to use, should be asked. Clearly, in terms of slope stability, persistent and fully developed features, already recognizable on low resolution 3-D models, are more hazardous than shorter ones, whether they are single persistent discontinuities or composite surfaces with a step-path geometry. However, a detailed characterization at higher resolution of both discontinuities and intact rock bridges will provide a better understanding of the discontinuity/rock mass strength properties, such as cohesion and friction in addition to the importance of brittle fracture and hence tensile strength of the rock mass. The third part of the paper illustrates the creation of a terrestrial 3-D model of the South Peak of Turtle Mountain, using a combination of terrestrial digital photogrammetry and terrestrial laser scanning. TLS is convenient on sharp ridges, where accessibility and rapid changes in perspective limit the use of TDP (which require two or more camera stations). In contrast, unlike most routinely available TLS, TDP allows building of high resolution stereomodels at a range exceeding 2km, when a large focal length (f =200–400 mm) is used. The use of high focal length (f =400 m) lenses in digital photogrammetry has to the authors knowledge rarely been documented in the geotechnical literature and this paper clearly shows their significant potential for rock slope and landslide investigations. Consequently, the case study data presented highlights new opportunities for detailed discontinuity characterization, using medium-range (>300 m) to longrange (>1000 m) terrestrial digital photogrammetry. Such techniques as illustrated by the characterization of discontiwww.nat-hazards-earth-syst-sci.net/9/267/2009/
M. Sturzenegger and D. Stead: Long-range remote sensing discontinuity characterization on rock slopes nuities on the South Peak can be extremely useful in mapping medium- to extremely-persistent discontinuities that often play an important role in the stability of large inaccessible mountain slopes or open-pit walls. The quality of a site investigation will benefit significantly from information collected at different observation scales, from traditional field outcrop to remote sensing mapping. Airborne LiDAR, although presenting a lower density of spatial data provide a more comprehensive (less occlusion) model of sub-horizontal to oblique slopes. The authors stress that a combination of complementary terrestrial and airborne remote sensing techniques is optimal in the generation of remote sensing models of large landslides. Such models should be incorporated as routine tools in landslides investigations. 7
Conclusions
Field sampling methods are currently restricted to low persistence discontinuities (scanline surveys) or large scale features (airborne photographs or DEM survey). Typically, during a scanline surveys, trace lengths longer than 10–15 m can only be approximated. At the other end of the spectrum, airborne discontinuity surveys are limited by resolution, especially on steep slopes. Terrestrial remote sensing techniques can increase the ground resolution to 5–10 cm, which represents high density of spatial data on sub-vertical to oblique slopes, allowing characterization of medium and higher persistence discontinuities. Wherever possible, it is suggested to select an appropriate ground resolution to avoid scale bias effects on discontinuity orientation and persistence measurements. However, lower resolution 3-D models should not be completely discarded as they can provide important information on large composite features. Indeed, terrestrial remote sensing may be particularly well-suited for geotechnical discontinuity characterization on large rock slopes and landslides, as they allow characterization of medium to extremely high persistence composite features, which are likely to play a major role in slope stability. The choice of an adequate ground resolution will also be crucial for the creation of discrete fracture network (DFN) models (Elmo et al., 2007). Indeed, they can generate either an abundance of low persistence discontinuities (high resolution) or a smaller density of larger persistence discontinuities (low resolution). In the first case, the model quantifies rock mass properties such as strength or permeability, while in the second case, they characterize the structures of a rock entity that may be critical to slope failure. The purpose of the use of DFN models should be considered when selecting the scale of discontinuities to be characterized. Acknowledgements. The laser scanner and total station were acquired through NSERC Equipment and Discovery Grants. Funding for the research was provide though an NSERC discovery grant and FRBC Endowment funding to the second author. We would like
www.nat-hazards-earth-syst-sci.net/9/267/2009/
285
to thank the following people for their specific input: Ming Yan for providing TLS point clouds of the Medicine Lake outcrop, Grant Shelest for his help and advice concerning TS surveys, Corey Froese and Francisco Moreno at the Alberta Geological Survey for the organization of field work on Turtle Mountain and providing airborne LiDAR data, Parks Canada for issuing a permit to work in the Rocky Mountains, Tim Sivak and Ross Easterbrook (funded NSERC URS students), Andy Beveridge and Sung Lee for their assistance in the field. Edited by: M.-H: Derron Reviewed by: M. Ghirotti and another anonymous referee
References Adam Technology: 3DM CalibCam and 3DM Analyst, version 2.2b, http://www.adamtech.com.au, 2007. Abellan, A., Vilaplana, J. M., and Martinez, J.: Application of a long-range Terrestrial Laser Scanner to a detailed rockfall study at Vall de Nuria (Eastern Pyrenees, Spain), Eng. Geol., 88, 136– 148, 2006. Aitken, J. C.: Cambrian sections in the easternmost southern Rocky Mountains and the adjacent subsurface, Alberta, Geological Survey of Canada, paper 66–23, 1968. Beach, H. H.: Moose Mountain and Morley map-areas, Alberta, Geological Survey of Canada, Memoir, 236 pp., 1943. Bellian, J. A., Kerans, C., and Jennette, D. C.: Digital outcrop models: application of terrestrial scanning LiDAR technology in stratigraphic modeling, J. Sediment. Res., 75(2), 166–176, 2005. Benko, B. and Stead, D.: The Frank Slide: a reexamination of the failure mechanism, Can. Geotech. J., 35, 299–311, 1998. Birch, J. S.: Using 3DM Analyst mine mapping suite for rock face characterization, in: Laser and Photogrammetric Methods for Rock Face Characterization, ARMA, edited by: Tonon, F. and Kottenstette, J., 13–32, 2006. Boehler, W., Bordas, V., and Marbs, A.: Investigating laser scanner accuracy, XIXth CIPA Symposium, 30 September–4 October 2003, Antalya, Turkey, 2003. Buckley, S. J., Howell, J. A., Enge, H. D., and Kurz, T. H.: Terrestrial laser scanning in geology: data acquisition, processing and accuracy considerations, J. Geol. Soc. London, 165, 625–638, 2008. Coggan, J. S., Wetherelt, A., Gwynn, X. P., and Flynn, Z. N.: Comparison of hand-mapping with remote data capture systems for effective rock mass characterization, in: Proceedings of the 11th Congress of ISRM, July 2007, Lisbon, Portugal, 2007. Couture, R.: Contributions aux aspects m´ecaniques et physiques des e´ croulements rocheux, Ph.D. thesis, Laval University, 573 pp., 1998. Cruden, D. M. and Krahn, J.: A re-examination of the geology of the Frank Slide, Can. Geotech. J., 10, 581–591, 1973. Cruden, D. M. and Martin, C. D.: Before the Frank Slide, Can. Geotech. J., 44, 765–780, 2007. Douglas, R. J. W.: Mount Head map-area, Alberta, Geological Survey of Canada, Memoir, 291 pp., 1958. Elmo, D., Yan, M., Stead, D., and Rogers, S. F.: The importance of intact rock bridges in the stability of high rock slopes – Towards a quantitative investigation using an integrated numerical modelling; discrete fracture network approach, in: Proceedings
Nat. Hazards Earth Syst. Sci., 9, 267–287, 2009
286
M. Sturzenegger and D. Stead: Long-range remote sensing discontinuity characterization on rock slopes
of the International Symposium on Rock Slope Stability in Open Pit Mining and Civil Engineering, 12–14 September, Perth, 253– 266, 2007. Enge, H. D., Buckley, S. J., Rotevatn, A., and Howell, J. A.: From outcrop to reservoir simulation model: workflow and procedures, Geosphere, 3(6), 469–490, 2007. ESRI Incorporated: ArcGIS package: ArcScene, version 9.2, http: //www.esri.com/software/arcgis/index.html, 2006. Feng, Q. H. and R¨oshoff, K.: In-situ mapping and documentation of rock faces using a full-coverage 3D laser scanner technique, Int. J. Rock Mech. Min., 41(3), 1–6, 2004. Ferrero, A. M., Forlani, G., Roncella, R., and Voyat, H. I.: Advanced geostructural survey methods applied to rock mass characterization, Rock Mech. Rock Eng., Springer Wien, ISSN0723-2632 (Print), -1434-453X (Online), doi:10.1007/s00603008-0010-4, 2008. Fossey, K. W.: Structural geology and slope stability of the southeast slope of Turtle Mountain, Master of Science Thesis, Department of Geology, University of Alberta, 113 pp., 1986. Fraser, C. S.: Network design, in: Close Range Photogrammetry and Machine Vision, edited by: Atkinson, K. B., Whittles Publishing, 256–281, 1996. Froese, C. and Moreno, F.: Turtle Mountain field laboratory (TMFL): part 1 – concept and research activities, in: Proceedings of the 59th Canadian Geotechnical Conference, October 2006, Vancouver, 544–551, 2006. Gaich, A., Poetsch, M., and Schubert, W.: Acquisition and assessment of geometric rock mass feature by true 3D images, in: Proceedings of the 41st U.S. Symposium on rock mechanics (USRNS), 17–21 June, Golden, Colorado, 2006. Giussani, A. and Scaioni, M.: Application of TLS to support landslides study: survey planning, operational issues and data processing, IAPRSSIS, Freiburg, 318–323, 2004. Haneberg, W. C.: Directional roughness profiles from threedimensional photogrammetric or laser scanner point clouds, in: Proceedings of the 1st Canada-US Rock Mechanics Symposium, 27–31 May , Vancouver, 101–106, 2007. Haneberg, W. C.: Using close range terrestrial digital photogrammetry for 3-D rock slope modeling and discontinuity mapping in the United States, Bulletin of Engineering Geology and the Enviroment, 67, 457–469, 2008. Innovmetric software: Polyworks package: IMAlign and IMInspect, version 9.1.8, http://www.innovmetric.com/ Manufacturing/home.aspx, 2006. International Society for Rock Mechanics (ISRM): Commission on standardization of laboratory and field tests: Suggested methods for the quantitative description of discontinuities in rock masses, Int. J. Rock Mech. Min., 15(6), 319–368, 1978. Jaboyedoff, M., Oppikofer, T., Minoia, R., Locat, J., and Turmel, D.: Terrestrial LIDAR investigation of the 2004 rockslide along Petit Champlain Street, Qu´ebec City (Qu´ebec, Canada), in: Proceedings of the 4th Canadian Conference on Geohazards, 20–24 May, Qu´ebec, Canada, 2008. Jaboyedoff, M., Couture, R., and Locat, P.: Structural analysis of Turtle Mountain (Alberta) using digital elevation model: toward a progressive failure, Geomorphology, 103, 5–16, 2009. Jones, P. B.: Structural geology of the modern Frank Slide and ancient Bluff Mountain Slide, Crowsnest, Alberta, B. Can. Petrol. Geol., 41(2), 232–243, 1993.
Nat. Hazards Earth Syst. Sci., 9, 267–287, 2009
Kemeny, J., Turner, K., and Norton, B.: LIDAR for rock mass characterization: hardware, software, accuracy and best-practices, in: Laser and Photogrammetric Methods for Rock Face Characterization, ARMA, edited by: Tonon, F. and Kottenstette, J., 49–62, 2006. Lane, S. N., James, T. D., and Cowell, M. S.: Application of digital photogrammetry to complex topography for geomorphological research, Photogramm. Rec., 16(95), 793–821, 2000. Langenberg, C. W., Pana, D., Richards, B. C., Spratt, D. A., and Lamb, M. A.: Structural geology of the Turtle Mountain area near Frank, Alberta, EUB/AGS Earth Science Report 2006–01, 28 pp., 2006. Lato, M., Diederichs, M. S., Hutchinson, D. J., and Harrap, R.: Optimization of LiDAR scanning and processing for automated structural evaluation of discontinuities in rockmasses, Int. J. Rock Mech. Min., 46, 194–199, 2009. Lichti, D. D. and Jamtsho, S.: Angular resolution of terrestrial laser scanners, Photogramm. Rec., 21(114), 141–160, 2006. Lim, M., Petley, D. N., Rosser, N. J., Allison, R. J., Long, A. J., and Pybus, D.: Combined digital photogrammetry and time-of-flight laser scanning for monitoring cliff evolution, The Photogramm. Rec., 20(110), 109–129, 2005. Mei, S., Poncos, V., and Froese, C.: Mapping millimetre-scale ground deformation over the underground coal mines in the Frank Slide area, Alberta, Canada, using spaceborne InSAR technology, Canadian Journal of Remote Sensing, 34(2), 113– 134, 2008. Meijer Drees, N. C., Johnston, D. I., and Richards, B. C.: The Devonian Palliser Formation and its equivalents, Southern Alberta, Canada, Geological Survey of Canada, Open File 2698, 108 pp., 1993. McCaffrey, K. J. W., Jones, R. R., Holdsworth, R. E., Wilson, R. W., Clegg, P., Imber, J., Holliman, N., and Trinks, I.: Unlocking the spatial dimension: digital technologies and the future of geoscience fieldwork, J. Geol. Soc. London, 162, 927–938, 2005. Monserrat, O. and Crosetto, M.: Deformation measurement using terrestrial laser scanning data and least squares 3D surface matching, ISPRS J. Photogramm., 63, 142–154, 2007. Monte, J. M.: Rock mass characterization using laser scanning and digital imaging data collection techniques, Master of Geological Engineering, University of Arizona, 168 pp., 2004. Nagihara, S., Mulligan, K. R., and Xiong, W.: Use of a three– dimensional laser scanner to digitally capture the topography of sand dunes in high spatial resolution, Earth Surf. Proc. Land., 29, 391–398, 2004. Optech Inc.: ILRIS-3D, http://www.optech.on.ca/prodilris.htm, 2008. Ortega, O. J., Marrett, R. A., and Laubach, S. E.: A scaleindependent approach to fracture intensity and average spacing measurement, AAPG Bulletin, 90(2), 193–208, 2005. Pesci, A., Loddo, F., and Conforti, D.: The first terrestrial laser scanner application over Vesuvius: high resolution model of a volcano crater, Int. J. Remote Sens., 28(1), 203–219, 2007a. Pesci, A., Fabris, M., Conforti, D., Loddo, F., Baldi, P., and Anzidei, M.: Integration of ground–based laser scanner and aerial digital photogrammetry for topographic modelling of Vesuvio volcano, J. Volcanol. Geoth. Res., 162, 123–138, 2007b. Poropat, G. V.: Remote 3D mapping of rock mass structure, in: Laser and Photogrammetric Methods for Rock Face Characteri-
www.nat-hazards-earth-syst-sci.net/9/267/2009/
M. Sturzenegger and D. Stead: Long-range remote sensing discontinuity characterization on rock slopes zation, ARMA, edited by: Tonon, F. and Kottenstette, J., 63–75, 2006. Poropat, G. V.: Remote characterization of surface roughness of rock discontinuities, in: Proceedings of the 1st Southern Hemisphere International Rock Mechanics Symposium, 16–19 September, Perth, 447–458, 2008. P¨otsch, M., Schubert, W., and Gaich, A.: Kinematical analysis of rock blocks supported by 3D imaging, in: Proceedings of the 41st US Symposium on Rock Mechanics (USRMS), 17–21 June, Golden, Colorado, 2006. Priest, S. D.: Discontinuity analysis for rock engineering, Chapman and Hall, London, 473 pp., 1993. Rengers, N., Soeters, R., and van Westen, C. J.: Remote sensing and GIS applied to mountain hazard mapping, Episodes, 15(1), 36–45, 1992. Rosser, N. J., Petley, D. N., Lim, M., Dunning, S. A., and Allison, R. J.: Terrestrial laser scanning for monitoring the process of hard rock coastal cliff erosion, Q. J. Eng. Geol. Hydroge., 38, 363–375, 2005. Singhroy, V. and Molch, K.: Characterizing and monitoring rockslides from SAR techniques, Adv. Space Res., 33, 290–295, 2004. Singhroy, V., Couture, R., and Molch, K.: InSAR monitoring of the Frank Slide, in: Proceedings of the International Conference on Landslide Risk Management, May–June 2005, Vancouver, Canada, edited by: Hungr, O., Fell, R., Couture, R., and Eberhardt, E., A. A. Balkema, London, 713–723, 2005. Sissakian, V., Soeters, R., and Rengers, N.: Engineering geological mapping from aerial photographs: the influence of photoscale on map quality and the use of stereo-orthophotographs, ITC Journal, 2, 109–118, 1983. Slob, S., Van Knapen, B., Hack, R., Turner, K., and Kemeny, J.: Method for automated discontinuity analysis of rock slopes with three-dimensional laser scanning, in: Proceedings of the Transportation Research Board 84th Annual Meeting, January 9–13, Washington DC, 16 pp., 2005. Soeters, R. and van Westen, J.: Slope instability recognition, analysis, and zonation, in: Landslides, investigation and mitigation, Special Report 247, Transportation Research Board, edited by: Turner, A. K. and Schuster, R. L., National Academy Press, Washington, DC, 129–177, 1996.
www.nat-hazards-earth-syst-sci.net/9/267/2009/
287
Spratt, D. A. and Lamb, M. A.: Borehole data interpretation and orientations, WP15b Report, Turtle Mountain monitoring project, 15 pp., 2005. Strandberg, C. A.: Aerial discovery manual, John Wiley and Sons, New York, 249 pp., 1967. Sturzenegger, M., Yan, M., Stead, D., and Elmo, D.: Application and limitations of ground-based laser scanning in rock slope characterization, in: Proceedings of the 1st Canada-US Rock Mechanics Symposium, 27–31 May, Vancouver, 29–36, 2007a. Sturzenegger, M., Stead, D., Froese, C., Moreno, F., and Jaboyedoff, M.: Ground-based and airborne LiDAR for structural mapping of the Frank Slide, in: Proceedings of the 1st Canada-US Rock Mechanics Symposium, 27–31 May,Vancouver, 925–232, 2007b. Sturzenegger, M. and Stead, D.: Close-range terrestrial digital photogrammetry and terrestrial laser scanning for discontinuity characterization on rock cuts, submitted, Eng. Geol., 2009. Tannant, D. D., Radmanovic, J., and Jiang L.: Digital photogrammetry for surface mining applications, CIM Mining Conference & Exhibition, Vancouver, May 2006. Teza, G., Galgaro, A., Zaltron, N., and Genevois, R.: Terrestrial laser scanner to detect landslide displacement fields: a new approach, Int. J. Remote Sens., 28(16), 3425–3446, 2007. Teza, G., Pesci, A., Genevois, R., and Galgaro, A.: Characterization of landslide ground surface kinematics from terrestrial laser scanning and strain field computation, Geomorphology, 97, 424– 437, 2008. Thales Group: Promark+3, http://pro.magellangps.com/en/ products/product{ }specs.asp?PRODID=1120, 2008. Theune, U., deGroot, M., Rokosh, C. D., Sacchi, M., Schmitt, D. R., Welz, M., and Holzhauer, J.: Looking inside Turtle Mountain: mapping fractures with GPR, University of Alberta, Department of Physics, 2005. Topcon Positioning Systems Inc.: GPT–3002LW, http://www. topconsurvey.com/index.html, 2008. Wolf, P. R. and Dewitt, B. A.: Elements of photogrammetry with applications in GIS, third edition, McGraw Hill, 608 pp., 2000. Yan, M.: Numerical modelling of brittle fracture and step-path failure: from laboratory to rock slope scale, Ph.D. thesis, Department of Earth Sciences, Simon Fraser University, Burnaby, Canada, 2008.
Nat. Hazards Earth Syst. Sci., 9, 267–287, 2009