American Journal of Botany 89(10): 1604–1608. 2002.
QUANTIFYING
LATITUDINAL CLINES TO LIGHT
RESPONSES IN NATURAL POPULATIONS OF
ARABIDOPSIS THALIANA (BRASSICACEAE)1 HANS K. STENøIEN,2,4,5 CHARLES B. FENSTER,2,6 HELMI KUITTINEN,3 AND OUTI SAVOLAINEN3 Department of Botany, Norwegian University of Science and Technology, N-7491 Trondheim, Norway; and 3 Department of Biology, University of Oulu, PO Box 3000, Fin-90014 Oulu, Finland.
2
Evidence of adaptation in Arabidopsis thaliana (Brassicaceae) phenotypic traits has rarely been shown. We demonstrate latitudinal clines in two A. thaliana traits: hypocotyl responses to red and far-red light. Natural populations of A. thaliana were sampled along a latitudinal gradient from southern to northern Norway. Seeds from maternal families within each population were subjected to 1 wk of constant red, far-red, blue, white, and dark treatments. Hypocotyl lengths were measured for each maternal family within each population. Significant variability within and among populations in hypocotyl responses for the various treatments was found. There was a significant latitudinal cline in hypocotyl responses for red and far-red treatments, with northern populations being more deetiolated than southern populations. These results suggest that northern populations are more responsive to red and far-red light than southern populations. Thus, differentiation of seedling traits in natural populations of A. thaliana seems in part to be mediated by the phytochrome pathway. There was no correlation between hypocotyl responses and flowering time for any treatment. This suggests that flowering time variability and variability in hypocotyl responses may not be governed by genes shared between the pathways, such as those involved in photoreception or the circadian clock. Key words:
adaptation; Arabidopsis thaliana; Brassicaceae; circadian clock; flowering time; photoreception; phytocromes.
Light influences the development of plants, and plants have evolved several means for sensing the quantity, quality, and direction of light in their environment. Light is perceived through a number of photoreceptor systems, including red and far-red absorbing phytochromes and blue absorbing cryptochromes (Lin, 2000; Neff, Fankhauser, and Chory, 2000; Briggs and Olney, 2001). One of the functions of photoreceptors is to act as input pathways to reset the central oscillator of the circadian clock (McClung, 2000; Roenneberg and Merrow, 2000; Samach and Coupland, 2000). Several developmental processes are determined by the integrated action of photoreception and circadian clock activity. For instance, the photoperiodic signal transduction pathway conveys signals to the floral initiation process (Koornneef et al., 1998; Levy and Dean, 1998), and a number of photoreception and circadian clock genes are described as acting in this pathway (Bla´zquez, 2000). Floral initiation is regulated by the daily duration of light and/or darkness; short days promote flowering in short day (SD) plants while long days promote flowering time in long day (LD) plants. Seedling development is also partly determined by photoreception and circadian clock genes. Because seeds often germinate in the dark, seedlings switch from heterotrophic to photoautotrophic growth when they reach favorable light conditions. Thus seedlings follow two developmental programs deManuscript received 14 December 2001; revision accepted 2 May 2002. The authors thank Sigurd M. Sa˚stad for helpful comments on the manuscript and Erlend Ellefsen for help with collecting plants. This study was financially supported by the Research Council of Norway (grant no. 134800/ 410). 4 Author for reprint requests, (phone: 146 18 471 28 66; FAX: 146 18 55 34 19; e-mail:
[email protected]). 5 Current address: Department of Plant Ecology, Evolutionary Biology Center, Uppsala University, Villava¨gen 14, SE-752 36 Uppsala, Sweden 6 Current address: Department of Biology, University of Maryland, College Park, Maryland 20742 USA. 1
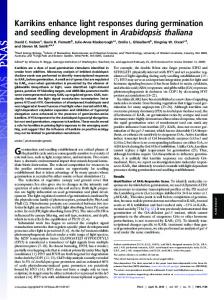
pending on light conditions. In darkness, seedling hypocotyls elongate (etiolation), while in light, hypocotyl elongation is inhibited (de-etiolation), cotyledons expand, and chloroplasts are developed. Mutations in photoreception and circadian clock genes have been shown to have pleiotropic effects on hypocotyl elongation and flowering time patterns, and variability in one or more genes in the shared pathways could therefore cause an association in seedling and flowering behavior. For example, in Arabidopsis thaliana (L.) Heynh., red absorbing phytochrome mutants (phyb) exhibit etiolated seedlings in red light and flower earlier than wild-type plants (Reed et al., 1993), while the circadian clock mutant elf3 exhibits etiolated seedlings in white light and flowers early regardless of day length (Hicks et al., 1996). Accessions of the facultative LD plant A. thaliana have genetic variability in flowering time (Laibach, 1951; Napp-Zinn, 1969; Karlsson, Sills, and Nienhuis, 1993; Nordborg and Bergelson, 1999). It is not known whether timing of flowering in natural populations of A. thaliana is associated with variability in photoreception or circadian clock genes. The purpose of the present study has been to study variability in hypocotyl responses to different light treatments in natural populations of A. thaliana with known flowering time from different latitudinal clines. The main focus has been to quantify whether hypocotyl and flowering time responses are associated with geographic origin of Norwegian populations along a north-south gradient with large photoperiodic amplitude and whether hypocotyl elongation is associated with flowering time. MATERIALS AND METHODS Ten populations of A. thaliana were sampled along a latitudinal gradient from southern Norway (Hvaler, 598 N) to northern Norway (Lofoten, 678 N) (see Fig. 1). Over this latitudinal gradient differences are encountered in, for example, length of growth season (1.5–2 mo), light intensity, day length (24-
1604
October 2002]
STENØIEN
ET AL.—LATITUDINAL CLINES IN
A. THALIANA
1605
HYPOCOTYL RESPONSES
TABLE 1. Results of analysis of variance testing for the overall effects of mean seed mass, treatment, population, interaction between treatment and population, maternal family nested within populations, and replicates nested within maternal families and populations on the logarithm of hypocotyl lengths of sampled Arabidopsis thaliana populations. *** P # 0.001.
Fig. 1. Natural populations of Arabidopsis thaliana sampled along a latitudinal gradient in Norway.
h day in northern Norway, while 19-h 40-min day in central Norway and 18h 15-min day in southern Norway on 1 June), mean temperature (.48C difference in July), and number of days with precipitation throughout the year (about 50 d). The northern locality lies in the central boreal vegetation zone, while the southern localities lies in the boreonemoral zone. For a thorough description of Norwegian vegetation and aspects of climatic conditions, see Moen (1998). To quantify genetic variation for hypocotyl elongation, six individual plants (maternal families) were chosen from each population, with three replicate siliques used for each maternal family. Mean seed mass per maternal family was measured. Vernalized seeds were sown in rows on 1% agar containing Murashige and Skoog plant salt mixture (Murashige and Skoog, 1962). Petri dishes containing the seeds were grown in growth chambers in controlled conditions. A pilot experiment did not reveal any effect of seed location within petri dishes (P 5 0.807). For ease of data collection, the maternal family replicates were not randomized within dishes. The seeds were divided into five separate treatments each lasting 7 d: constant white, blue, red, far red light, and constant darkness. White light was produced with Osram (Osram, Munich, Germany) L18W/25 fluorescent bulbs, blue light with Philips (Philips Lighting, The Netherlands) TLD18W/18 fluorescent bulbs, red light with Philips LD18W/15 fluorescent bulbs, and far-red light with incandescent bulbs filtered with Lee (Lee Filters, Hampshire, UK) filters 026-M and 195-M to eliminate blue and most of the red wavelength. The photon density flux was quantified with a spectroradiometer and was found to be 43, 36, 2.8, and 4.7 mmol·m22·s21 in the white, blue, red and farred treatments, respectively. The peak of photon flux density was at 450 nm for blue light and 664 nm for red light. The temperature was set at 188C in the chambers. Mean germination time per maternal family was recorded where possible. Hypocotyl lengths were determined manually to 0.25 mm accuracy. The data on hypocotyl lengths was analyzed according to the following model: yijklm 5 m 1 bl si 1 L j 1 rk 1 al(k) 1 Lrjk 1 eijklm
(1)
where yijklm is the response of the mth seed from the lth maternal family from the kth population receiving the jth light treatment, and m is the mean of the response. The effect of mean seed mass of the maternal family was entered as a covariate (blsi) in the model. The maternal family effect (a) was consid-
Source of variation
df
F
Mean seed mass Treatment Population Treatment 3 Population Maternal family within Population Replicate within Maternal family
1 4 9 36 49 118
2.15 5380.95*** 13.48*** 5.38*** 2.05*** 0.79
ered random and nested within population (r). Light treatment (L) and population were considered fixed effects and Lr is the interaction between them. According to Levene’s test, the variance of the hypocotyl length was strongly correlated with the mean, hence this variable was ln-transformed prior to analysis to improve homogeneity of variance among light treatments. Analysis within treatments was conducted according to a similar model neglecting the effect of light treatments. A separate experiment has previously been conducted to quantify genetic variation for flowering time in the present populations. Seeds were vernalized by placing in pots with wet soil at 48C for 7 wk in a refrigerator. Vernalized seeds from 10–14 maternal families from each population were sown. Up to five seedlings per maternal family were transplanted into a randomized design. Flowering time data were subjected to analysis of variance according to the following model: ykl 5 m 1 rk 1 al(k) 1 «kl
(2)
(H. K. Stenøien and C. B. Fenster, unpublished data). The response of the lth maternal family from the kth population is ykl, and m is the mean of the response. The maternal family effect (a) was considered random and nested within population (r). According to Levene’s test, the variance of the flowering time was strongly correlated with the mean, hence this variable was lntransformed prior to analysis to improve homogeneity of variance. Associations between hypocotyl responses, flowering time, and geographic origin of populations (latitude) was tested using Pearson correlation analysis. Correlations between hypocotyl responses for various treatments were tested at the population and maternal family levels. All statistical analyses were performed using SPSS for Windows version 9.0.0 (SPSS, 2000).
RESULTS There was no confounding effect of germination time on hypocotyl responses overall or for individual treatments. There was no overall or individual treatment effect of mean seed mass, except for the white light treatment (P 5 0.014). Pearson correlation coefficient was 20.179 (P 5 0.020) between the logarithm of white light hypocotyl lengths and mean seed mass, indicating that there was a tendency for large seeds to develop smaller hypocotyls than small seeds when subjected to this treatment. There were significant overall effects on hypocotyl response of Treatment, Population, interaction between Treatment and Population, and Maternal family nested within Population (all P , 0.001). Variability among populations was larger than among maternal families within populations, and variability among maternal families within populations was larger than among replicates within maternal families (Table 1). When all treatments were analyzed separately, there was significant variation among populations in hypocotyl response in all cases (Table 2). For blue, red, white, darkness, and farred treatment the mean hypocotyl lengths were 1.18 6 0.02,
1606
AMERICAN JOURNAL
OF
BOTANY
[Vol. 89
TABLE 2. Results of analysis of variance testing for the effects of population and maternal family nested within populations on the logarithm of hypocotyl lengths of sampled Arabidopsis thaliana populations subjected to various light treatments. * P # 0.05; ** P # 0.01; *** P # 0.001. Source of variation
df
Blue, F
Red, F
White, F
Darkness, F
Far-red, F
Population Maternal family within Population
9 49
4.85*** 1.57*
6.61*** 2.38***
6.98*** 1.28
5.14*** 0.96
10.22*** 1.76*
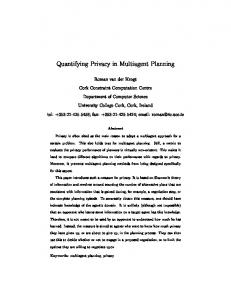
9.10 6 0.16, 1.40 6 0.02, 10.69 6 0.21, and 2.35 6 0.05 mm, respectively (means 6 1 SE). We used variance component estimates to calculate the proportion of variance accounted for by differences among populations, (100% · sPop2)/ sTotal2, where sTotal2 5 sPop2 1 sMf(Pop)2 1 sError2. This approach suggested that the population factor accounted for the following proportions of the total variances within the various light treatments: far-red (58%) . red (35%) . white (30%) . blue (28%) . darkness (20%). Thus, there was relatively high variability in hypocotyl responses both among and within populations for the far-red and red treatments. There was a significant negative correlation between latitude of populations and mean population hypocotyl responses for the red (Pearson’s coefficient 5 20.768; P 5 0.026) and farred (Pearson’s coefficient 5 20.797; P 5 0.018) treatments (Figs. 2 and 3). Populations differed in their flowering times (P , 0.001), but no significant clinal trend was observed (P 5 0.557; Fig. 4). There was no significant correlation between hypocotyl lengths and flowering time in any population for any treatment. There was no correlation between hypocotyl responses in red and far-red treatments (Pearson’s coefficient 5 0.253; P 5 0.068).
Arabidopsis thaliana is the model organism for studies of cellular and molecular biology of flowering plants. It is a small, annual, predominantly selfing (Abbott and Gomes, 1989) weed belonging to the mustard family (Brassicaceae). Its usefulness as a model system is due to several aspects of its biology, including the small size of the plant, the large number of offspring, the ease of cultivation, the rapid life cycle, and the relatively small nuclear genome of 125 megabases.
The whole genome has been sequenced, a fraction of the genes (9%) have been experimentally characterized (Arabidopsis Genome Initiative, 2000), and there is an ongoing effort to identify and understand the functions of all the remaining genes. As there are good foundations to choose candidate genes for a number of given traits, this species represents an ideal model organism for studies of adaptations at the molecular level. In the present study we find variation among maternal families within populations. This suggests that heterozygosity is nonzero within these selfing populations, either as a result of limited outcrossing between individuals or independent colonization events. It will be possible to decide between these alternatives when neutral marker variability and structuring has been quantified in these populations. Several studies have suggested that populations of A. thaliana have recently expanded from Asia (e.g., Price, Palmer, and Al-Shehbaz, 1994; Innan et al., 1996; Miyashita, Kawabe, and Innan, 1999; Sharbel, Haubold, and Mitchell-Olds, 2000), and genotypes seems more or less geographically randomly distributed for studied genes (Kawabe and Miyashita, 1999). It has been difficult to find evidence of adaptations, such as phenotypic clines, in any trait for this plant (e.g., Kuittinen, Mattila, and Savolainen, 1997, see below). Here we present evidence of hypocotyl clines in A. thaliana. Clinal variation is often a strong indication of natural selection (Endler, 1986), thus our data is strongly suggestive of adaptation in population differentiation in hypocotyl growth in response to light treatment. We collected A. thaliana plants from natural populations situated along a steep environmental gradient. We document two latitudinal clines in seedling development for these populations, with northern populations exhibiting more de-etiolated hypocotyls than southern ones after red and far-red treat-
Fig. 2. Hypocotyl lengths for the various Arabidopsis thaliana populations after 1 wk of constant red light treatment (means 6 1 SE). Populations are arranged according to latitudinal positions. There is a significant clinal trend (Pearson’s coefficient 5 20.768; P 5 0.026).
Fig. 3. Hypocotyl lengths for the various Arabidopsis thaliana populations after 1 wk of constant far-red light treatment (means 6 1 SE). Populations are arranged according to latitudinal positions. There is a significant clinal trend (Pearson’s coefficient 5 20.797; P 5 0.018).
DISCUSSION
October 2002]
STENØIEN
ET AL.—LATITUDINAL CLINES IN
Fig. 4. Number of days from sowing to flowering for the various Arabidopsis thaliana populations (means 6 1 SE). Populations are arranged according to latitudinal positions. There is significant variability among populations in flowering time, but no latitudinal trend in this variability. There is no correlation between flowering time and hypocotyl responses to any treatment.
ments. There is more variability among populations for the red and far-red treatments compared with white, blue and dark treatments. Maloof et al. (2001) found a latitudinal trend for A. thaliana hypocotyls subjected to white light treatment. In their study, accessions (ecotypes) from equatorial areas exhibited taller hypocotyls than accessions farther away from the equator when subjected to a white light treatment. In Maloof et al.’s (2001) study, accessions from a different geographic scale were employed (from equatorial areas up to .608 N). This difference in sample geographic range may perhaps explain why our results differ from theirs for the white light treatment. Latitudinal differences in light responses have been reported within several species, e.g., for the control of bud dormancy. Northern populations of Salix pentandra seem to require farred light in day extensions to maintain growth, whereas southern populations may have no such requirement, a similar observation as made in Betula pubescens (Ha˚bjørg, 1972; Junttila and Kaurin, 1990). Clapham et al. (1998) have observed an increasing requirement for far-red light to maintain extension growth and prevent budset in Picea abies seedlings, as the latitude of origin of the seedlings increases northwards. Several important plant responses are induced or inhibited by phytochrome activity, including the transition to flowering (e.g., Hughes, 1996). Red/far-red reversibility and reciprocity are the hallmark of the classic phytochrome responses known as low fluence responses (Neff, Fankhauser, and Chory, 2000). Plants sense the red/far-red ratio of their surroundings and respond accordingly. It might be that hypocotyl responses for red and far-red treatments, when analyzed together, are indicative of responses to a specific red/far-red ratio. If this is so, then the present results indicate genetic variability in red/farred ratio responses among natural populations. However, the hypocotyl responses to red and far-red treatments are not significantly correlated on population or maternal family levels. This latter might be due to lack of statistical power or that these two traits are genetically or physiologically independent. The observed response patterns could indicate that northern populations are more sensitive to red and far-red light stimuli
A. THALIANA
HYPOCOTYL RESPONSES
1607
than southern populations. This could be explained as being an adaptation to differences in light intensity and possibly light quality that the plant encounters in its natural growth sites. When seeds germinate in the soil, i.e., in the dark, the seedlings will be de-etiolated when they reach favorable light conditions. This may mean different light intensity of specific wavelength in different latitudes, because there is a gradual increase in the light intensity from the north to the south. Further studies are needed to assess the adaptive relevance of hypocotyl response variability. Olmsted (1944, 1945) has demonstrated ecotypic differentiation in Bouteloua curtipendula floral traits where plants either initiate flowering in response to long or short day lengths depending on the latitude of origin of the population. Even though there is variation among populations in flowering time in the present study, there is no latitudinal trend in this variability. This is similar to patterns observed in other studies of Arabidopsis thaliana, e.g., Kuittinen, Mattila, and Savolainen (1997), employing various Scandinavian populations of A. thaliana. Karlsson, Sills, and Nienhuis (1993) studied the effects of photoperiod and vernalization on the number of leaves at flowering in 32 A. thaliana accessions. By reanalyzing their data, it is clear that there is no significant correlation between latitude at natural origin of accessions and number of leaves at flowering for any treatment (data not shown). Zhang and Lechowicz (1994) found no correlation between flowering time and latitude in a study of 13 accessions. Further, Nordborg and Bergelson (1999) studied the effect of cold treatment on germination and flowering time in 32 A. thaliana accessions. Reanalysis of their data shows no significant correlation between latitude of accessions and response to treatments. This lack of association suggests that variability in flowering time is not governed by the same set of genes that cause variability in hypocotyl elongation. Crosses between A. thaliana accessions have shown that flowering time variability is largely due to a quantitative trait locus (QTL) on chromosome 4 (Clarke and Dean, 1994; Kuittinen, Sillanpaa, and Savolainen, 1997). Johanson et al. (2000) have shown that the presence or absence of a functional FRIGIDA (FRI) protein seems responsible for much of the flowering time variability among A. thaliana accessions, and the FRI gene is separate from the photoperiodic and circadian clock pathway (Bla´zquez, 2000). It might be that micro-ecological factors, such as shading and water and nutrient availability, rather than large-scale climatic factors determine flowering time variability among Norwegian populations. Alternatively, one cannot discount the possibility that this flowering time variability is mainly caused by random genetic drift. Traits may be effectively neutral in A. thaliana, due to the small fragmented populations in this predominantly selfing species. In the present study, there is no association between flowering time and hypocotyl responses for different light treatments. J. Botto and H. Smith (University of Leicester, unpublished data, cited in Smith, 2000) studied more than 100 A. thaliana accessions with wide variations in responses to farred light, but they did not find any correlation between hypocotyl elongation and flowering time either. This lack of association suggests that hypocotyl variability is caused by downstream components in the seedling developmental pathway that are not shared with the floral transition pathway. If genes shared between the pathways are involved in determination of flowering time, then downstream components in the floral transition pathway could, at least partially, modify the
1608
AMERICAN JOURNAL
effects of upstream gene expression on flowering time. Alternatively, it is also possible that different domains of shared genes are involved in the signal transductions of these two traits, and polymorphisms at these domains may not be coupled. LITERATURE CITED ABBOTT, R. J., AND M. F. GOMES. 1989. Population genetic structure and outcrossing rate of Arabidopsis thaliana (L.) Heynh. Heredity 62: 411– 418. ARABIDOPSIS GENOME INITIATIVE. 2000. Analysis of the genome sequence of the flowering plant Arabidopsis thaliana. Nature 408: 796–815. BLA´ZQUEZ, M. A. 2000. Flower development pathways. Journal of Cell Science 113: 3547–3548. BRIGGS, W. R., AND M. A. OLNEY. 2001. Photoreceptors in plant photomorphogenesis to date. Five phytochromes, two cryptochromes, one phototropin, and one superchrome. Plant Physiology 125: 85–88. CLAPHAM, D. H., I. DORMLING, I. EKBERG, G. ERIKSSON, M. QAMARUDDIN, AND D. VINCE-PRUE. 1998. Latitudinal cline of requirement for far-red light for the photoperiodic control of budset and extension growth in Picea abies (Norway spruce). Physiologia Plantarum 102: 71–78. CLARKE, J. H., AND C. DEAN. 1994. Mapping FRI, a locus controlling flowering time and vernalization response in Arabidopsis thaliana. Molecular and General Genetics 242: 81–89. ENDLER, J. A. 1986. Natural selection in the wild. Monographs in population biology 21. Princeton University Press, Princeton, New Jersey, USA. HA˚BJøRG, A. 1972. Effects of light quality, light intensity and night temperature on growth and development of three latitudinal populations of Betula pubescens. Meldinger Norges Landbrukshøgskole 51: 1–17. HICKS, K. A., A. J. MILLAR, I. A. CARRE´, D. E. SOMERS, M. STRAUME, D. R. MEEKS-WAGNER, AND S. A. KAY. 1996. Conditional circadian dysfunction of the Arabidopsis early-flowering 3 mutant. Science 274: 790– 792. HUGHES, M. A. 1996. Plant molecular genetics. Addison Wesley Longman, Essex, UK. INNAN, H., F. TAJIMA, R. TERAUCHI, AND N. T. MIYASHITA. 1996. Intragenic recombination in the Adh locus of the wild plant Arabidopsis thaliana. Genetics 143: 1761–1770. JOHANSON, U., J. WEST, C. LISTER, S. MICHAELS, R. AMASINO, AND C. DEAN. 2000. Molecular analysis of FRIGIDA, a major determinant of natural variation in Arabidopsis flowering time. Science 290: 344–347. ˚ . KAURIN. 1990. Environmental control of cold accliJUNTTILA, O., AND A mation in Salix pentandra. Scandinavian Journal of Forest Research 5: 195–204. KARLSSON, B. H., G. R. SILLS, AND J. NIENHUIS. 1993. Effects of photoperiod and vernalization on the number of leaves at flowering in 32 Arabidopsis thaliana (Brassicaceae) ecotypes. American Journal of Botany 80: 646–648. KAWABE, A., AND N. T. MIYASHITA. 1999. DNA variation in the basic chitinase locus (ChiB) region of the wild plant Arabidopsis thaliana. Genetics 153: 1445–1453. KOORNNEEF, M., C. ALONSO-BLANCO, A. J. M. PEETERS, AND W. SOPPE. 1998. Genetic control of flowering time in Arabidopsis. Annual Review in Plant Physiology and Plant Molecular Biology 49: 345–370. KUITTINEN, H., A. MATTILA, AND O. SAVOLAINEN. 1997. Genetic variation at marker loci and in quantitative traits in natural populations of Arabidopsis thaliana. Heredity 79: 144–152.
OF
BOTANY
[Vol. 89
KUITTINEN, H., M. J. SILLANPAA, AND O. SAVOLAINEN. 1997. Genetic basis of adaptation: flowering time in Arabidopsis thaliana. Theoretical and Applied Genetics 95: 573–583. ¨ ber Sommer und Winterannuelle Rasse von Arabidopsis LAIBACH, F. 1951. U ¨ tiologie der Blu¨tenbildung. Beithaliana (L.) Heynh: ein Beitrag zur A tra¨ge zur Biologie der Pflanzen 28: 173–210. LEVY, Y. Y., AND C. DEAN. 1998. The transition to flowering. Plant Cell 10: 1973–1990. LIN, C. 2000. Photoreceptors and regulation of flowering time. Plant Physiology 123: 39–50. MALOOF, J. N., J. O. BOREVITZ, T. DABI, J. LUTES, R. B. NEHRING, J. L. REDFERN, G. T. TRAINER, J. M. WILSON, T. ASAMI, C. C. BERRY, D. WEIGEL, AND J. CHORY. 2001. Natural variation in light sensitivity of Arabidopsis. Nature Genetics 29: 441–446. MCCLUNG, C. R. 2000. Circadian rhythms in plants: a millennial view. Physiologia Plantarum 109: 359–371. MIYASHITA, N. T., A. KAWABE, AND H. INNAN. 1999. DNA variation in the wild plant Arabidopsis thaliana revealed by amplified fragment lenth polymorpism analysis. Genetics 152: 1723–1731. MOEN, A. 1998. Nasjonalatlas for Norge: vegetasjon (National atlas of Norway: vegetation). Norwegian Mapping Authority, Hønefoss, Norway. MURASHIGE, T., AND F. SKOOG. 1962. A revised medium for rapid growth and bioassays with tobacco tissue. Physiologia Plantarum 15: 493–497. NAPP-ZINN, K. 1969. Arabidopsis thaliana (L.) Heynh. In L. T. Evans [ed.], The induction of flowering, 291–304. Cornell University Press, Ithaca, New York, USA. NEFF, M. M., C. FANKHAUSER, AND J. CHORY. 2000. Light: an indicator of time and place. Genes & Development 14: 257–271. NORDBORG, M., AND J. BERGELSON. 1999. The effect of seed and rosette cold treatment on germination and flowering time in some Arabidopsis thaliana (Brassicaceae) ecotypes. American Journal of Botany 86: 470– 475. OLMSTED, C. E. 1944. Growth and development in range grasses. IV. Photoperiodic responses in twelve geographic strains of side-oats gram. Botanical Gazette 106: 46–74. OLMSTED, C. E. 1945. Growth and developing in range grasses. V. Photoperiodic responses of clonal divisions of three latitudinal strains of sideoats gram. Botanical Gazette 106: 382–401. PRICE, R. A., J. D. PALMER, AND A. AL-SHEHBAZ. 1994. Systematic relationships of Arabidopsis: a molecular and morphological perspective. In E. M. Meyerowitz and C. R. Somervile [eds.], Arabidopsis, 7–19. Cold Spring Harbor Laboratory Press, Cold Spring Harbor, New York, USA. REED, J. W., P. NAGPAL, D. S. POOLE, M. FURUYA, AND J. CHORY. 1993. Mutations in the gene for the red/far-red light receptor Phytochrome B alter cell elongation and physiological responses throughout Arabidopsis development. Plant Cell 5: 147–157. ROENNEBERG, T., AND M. MERROW. 2000. Circadian clocks: omnes viae Romam ducunt. Current Biology 10: R742–R745. SAMACH, A., AND G. COUPLAND. 2000. The measurement and the control of flowering in plants. BioEssays 22: 38–47. SHARBEL, T. F., B. HAUBOLD, AND T. MITCHELL-OLDS. 2000. Genetic isolation by distance in Arabidopsis thaliana: biogeography and postgacial colonization of Europe. Molecular Ecology 9: 2109–2118. SMITH, H. 2000. Phytochromes and light signal perception by plants: an emerging synthesis. Nature 407: 585–591. SPSS. 2000. SPSS for Windows. Version 9.0.0. SPSS, Chicago, Illinois, USA. ZHANG, J., AND M. J. LECHOWICZ. 1994. Correlation between time of flowering and phenotypic plasticity in Arabidopsis thaliana (Brassicaceae). American Journal of Botany 81: 1336–1342.