Quantifying Network Denial of Service. 341. Replicaâ1. 1. 4. 3. 1. 4. 3. 2. Replicaâ2. Client. 2. Directory. 2218. 0325. B4F8. 9098. 3A40. 9598. 4432. 3598. 4432.
Quantifying Network Denial of Service: A Location Service Case Study Yan Chen, Adam Bargteil, David Bindel, Randy H. Katz, and John Kubiatowicz Computer Science Division, University of California, Berkeley {yanchen, adamb, dbindel, randy, kubitron}@cs.berkeley.edu Abstract. Network Denial of Service (DoS) attacks are increasing in frequency, severity and sophistication, making it desirable to measure the resilience of systems to DoS attacks. In this paper, we propose a simulation-based methodology and apply it to attacks on object location services such as DNS. Our results allow us to contrast the DoS resilience of three distinct architectures for object location.
1
Introduction
Today’s exponential growth in storage, bandwidth, and computational resources has fundamentally changed the way that applications are constructed. A single networked computer can now access vast distributed databases, execute programs on remote supercomputers, and communicate with billions of other devices. Opportunities are limited only by the imagination. Unfortunately, with networking comes the potential for Denial of Service (DoS) attacks, where a DoS attack is any malicious action that reduces the availability of a resource to one or more users. From 1989-1995 the number of DoS attacks increased 50% per year [13]. Additionally, a 1999 CSI/FBI survey reported that 32% of respondents detected DoS attacks directed at their systems [15]. More recently, Yankee Group, an Internet research firm, estimated that DoS attacks cost $1.2 billion in lost revenues in 2000 [9]. Given the proliferation of DoS attacks, many mission-critical applications claim DoS resilience. To test these claims, there is a desire for a general methodology to measure the resilience of a system or service to network DoS attacks. As the first step towards this ambitious goal, we explore DoS resilience in an important component of many networked applications: the object location service (OLS). Object location services map abstract names to physical locations; a well-known example is the Domain Name Service (DNS). In addition to administrative convenience, the presence of an object location service permits the system to create copies of objects close to where they are needed, thereby maximizing locality, availability and reliability. Given its central importance to many applications, the object location service is a natural target for DoS attacks. We explore three architectures for object location services: a centralized directory, a replicated directory, and a distributed directory. We subject a realistic simulation of these services to two classes of denial of service attacks, namely flooding attacks andcorruption attacks. We then contrast the DoS resilience of these architectures and conclude with some thoughts about methodology. S. Qing, T. Okamoto, and J. Zhou (Eds.): ICICS 2001, LNCS 2229, pp. 340–351, 2001. c Springer-Verlag Berlin Heidelberg 2001 �
Quantifying Network Denial of Service
341
L1
0325
L1
4432 L1
1 Directory
0128
Client
4 3
3
1 2
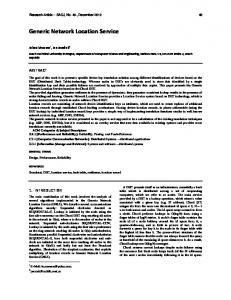
Fig. 1. A Centralized Directory Service (CDS): Clients contact a single directory to discover the location of a close replica. Clients subsequently contact the replica directly. A Replicated Directory Service (RDS) provides multiple directories.
L1
3A40
L2
L1 L1
L2
L3
3598
4432
L1
CE42
Replica−2
2
2218
9098 L2
L2
L1
L2
2
4
Client
B4F8
Replica−1
Replica−1
1010
7598 L4 Root L4 4598
4432
Replica−2
L4 1212
9598
Fig. 2. A Distributed Directory (Tapestry): Nodes connected via links (solid arrows). Nodes route to nodes one digit at a time: e.g. 1010 → 2218 → 9098 → 7598 → 4598. Objects are associated with one particular “root” node (e.g. 4598). Servers publish replicas by sending messages toward root, leaving back-pointers (dotted arrows). Clients route directly to replicas by sending messages toward root until encountering pointer (e.g. 0325 → B4F 8 → 4432).
Architectures for Object Location
Networked applications are extending their reach to a variety of devices and services over the Internet. Applications expanding to leverage these network resources find that locating objects on the wide-area is an important problem. Further, the read-mostly model of shared access, widely popularized by the World-Wide-Web, has led to extensive object replication, compounding the problem of object location. Work on location services has been done in a variety of contexts [8,12,14,27]. These approaches can be roughly categorized into three groups: Centralized Directory Services (CDS), Replicated Directory Services (RDS), and Distributed Directory Services (DDS). 2.1
Centralized and Replicated Directory Services
A centralized directory service (CDS) resides on a single server and provides location information for every object on the network. See Figure 1. Because it resides on a single server, it is extremely vulnerable to DoS attacks. A variant of this is the replicated directory service (RDS) which provides multiple directory servers. An RDS provides higher availability, but suffers consistency overhead. 2.2
Distributed Directory Services: The Tapestry Infrastructure
Networking researchers have begun to explore decentralized location services [27, 21,24]. Such services offer a distributed infrastructure for locating objects
342
Y. Chen et al.
quickly, with guaranteed success and locality. Rather than depending on a single server to locate an object, a query in this model is passed around the network until it reaches a node that knows the location of the requested object. The lack of a single target in decentralized location services means they provide very high availability even under attack; the effects of successfully attacking and disabling a set of nodes is limited to a small set of objects. We chose Tapestry [27] as our example of this type of service. Tapestry is an IP overlay network that uses a distributed, fault-tolerant architecture to track the location of every object in the network. Tapestry has two components: a routing mesh and a distributed directory service. Tapestry Routing Mesh: Figure 2 shows a portion of Tapestry. Each Tapestry node has a unique hexadecimal address drawn from a random distribution. Tapestry nodes are connected via neighbor links of varying levels; these are shown as solid arrows. The level-1 links (L1) from a node connect to the 16 closest, nodes1 with different values in the lowest digit of the address. Level-2 links (L2) connect to the 16 closest nodes that match in the lowest digit and have different second digits, etc.. Such neighbor links provide a route from every node to every other node; the routing process resolves the destination address one digit at a time. This routing scheme is based on the hashed-suffix routing structure originally presented by Plaxton, Rajaraman, and Richa [19]. Tapestry Distributed Directory Service: Tapestry assigns a globallyunique name (GUID) to every object. It then deterministically maps each GUID to a unique root node. Storage servers publish objects by sending messages toward the roots, depositing location pointers at each hop. Figure 2 shows two replicas and the Tapestry root for an object. Location pointers are shown as dotted arrows that point back to replica servers. To locate an object, a client sends a message toward the object’s root. When the message encounters a pointer, it routes directly to the object. It is shown in [19] that the average distance traveled in locating an object is proportional to the distance from that object. The root of the tree must know where one or more replicas of the object reside in order to guarantee that replicas can be located. This makes it an obvious target for a DoS attack. We will exploit this vulnerability later2 .
3
Assessing the Risk
DoS attacks are difficult to analyze because they are system-wide phenomena. Viewing components or attackers in isolation often fails to expose interesting behavior. As a consequence, we choose to observe a simulation of a complete system, including realistic network topology, client workloads, server architecture, and attack profiles. Section 4 will describe the simulation environment in detail. Here we wish to understand the types of attacks that might be mounted against object location services and how we can assess their impact. 1 2
“Closest” with respect to network latency. The Tapestry infrastructure in [27] employs multiple roots; we did not simulate this.
Quantifying Network Denial of Service
343
Fig. 3. Structure of a distributed DDoS attacks
3.1
Threat Models
Denial of Service attacks come in many shapes and sizes. In fact, the CERT Coordination Center [6] has proposed the following taxonomy: – – – –
Consumption of network connectivity and/or bandwidth Consumption of other resources, i.e. CPU cycles or kernel data structures Destruction or alteration of configuration information Physical destruction or alteration of network components
Specializing this set for object location services, we identify two general classes of attack: Flooding Attacks and Corruption Attacks: Flooding Attacks: The most popular network DoS attack is the flooding attack, in which the attacker sends superfluous requests at a high rate. Flooding attacks overload the victim’s resources (such as queues and CPU), and also swamp the local routers, gateways and links. These DoS attacks can be classified as point-to-point or distributed. There are four major point-to-point DoS attacks: TCP SYN flooding, UDP flooding, ICMP flooding and Smurf attacks [10]. Distributed Dos (DDoS) attacks combine point-to-point DoS attacks with distributed and coordinated control. Figure 3 shows the structure of a DDoS attack, with one or more attackers controlling handlers, with each handler controlling multiple agents3 . Handlers and agents are extra layers introduced to increase the rate of packet traffic as well as hide the attackers from view. Each agent can choose the size and type of packets as well as the duration of flooding. While the victim may be able to identify some agents and have them taken off-line, the attacker can monitor the effects of the attack and create new agents accordingly [10]. In general, attack simulation parameters should be chosen to cover a sufficient spectrum of attack traffic versus legitimate traffic to show interesting results. 3
Compromised hosts responsible for generating packet streams directed at the victim.
344
Y. Chen et al.
Corruption Attacks: When an attacker corrupts or destroys information, we call this a corruption attack. There are numerous variants on this type of attack. For instance an attacker might alter configuration information to prevent the use of a computer or network. Or, an attacker might corrupt routing tables, causing victim nodes to redirect traffic toward the attacker, which would subsequently drop or deny requests. It is not possible to test all attacks, so typical examples of this category should be simulated and measured. 3.2
Measuring Resilience
DoS attacks reduce resource availability. Here, availability refers to a spectrum of service quality, not simply “up” versus “down”. Though the choice of Quality of Service (QoS) metrics depends on the system or service being studied, Brown and Patterson have suggested performance, completeness, accuracy and capacity as starting points [4]. For our particular study, we consider metrics of response latency, request throughput, and time to recover 4 . We examine the level degradation of a service under attack to assess the resilience of that service. Of course, Denial of Service is multidimensional in that system A may be more resilient than system B for one type of attack but less resilient for another. Usually, the particular threat-model under consideration defines a set of dimensions, one for each class of threat. Combining these dimensions to yield a particular resilience ranking is a very system-specific task and hard to generalize. Our solution is to be sufficiently specific in the definition of the threat model and only quantify the resilience in that model.
4
Experimental Setup
We built a complete system on top of ns [3]. All of our nodes function as both clients and hosts with a subset providing the directory service. Clients send lookup requests to the directory service, which either returns the location of a replica or forwards the request directly to the replica. We selected some nodes to be attackers and measured changes in the availability of system resources. We used 1000 node network topologies generated by GT-ITM [26] using a transit-stub model. We then extended these topologies with common network bandwidths as recommended in [16]. Our routers use simple drop-tail queuing (we assumed attackers will spoof their IP addresses, defeating any filtering done by more complicated queuing policies). More details are in [5]. 4.1
Client Operation
We generated synthetic client workloads using both Zipf’s law [1] and hotcold [20] models. Zipf’s law states that if objects are ranked according to their access frequency, then the number of requests of the object with rank i is proportional to 1/i. In a hot-cold model, a small portion of the objects (10%) receive 4
A corrupted directory service could prevent service entirely, but this is beyond the scope of the current study.
Quantifying Network Denial of Service
345
the majority (90%) of the requests. Our network has 500 objects, each with three replicas placed on three randomly chosen nodes. The sizes of objects were chosen randomly from the interval 5kB - 50kB. Nodes request a data object, wait for the data and then request another, such as when a user is following a series of web links. 4.2
Directory Server Operation
We used five different directory services in our simulations: CDSr. The simplest directory service is the Centralized Directory Server(CDS). Here, one non-transit node is chosen to be the directory server. Object requests are made in two stages. First, the directory server is queried and returns the location of a random replica of the object. Second, the requesting node communicates directly with the node hosting the replica and the data is returned. CDSo. Same as above, except that the directory server returns the location of the replica which is closest to the requesting node. RDSr. The Replicated Directory Service(RDS) is placed on four random, widely-distributed, non-transit nodes. Queries are made as above, except that a node must choose one of the servers to fulfill its request. Here, the choice is made randomly for each request. The replica is also randomly chosen by the directory server as in the CDSr. RDSo. Same as the RDSr, except that each node sends requests to the nearest directory server. (Replica choice is still random). DDS. For the DDS, we implemented a simplified version of Tapestry as an extension to ns. All messages between nodes are passed by ns’s full TCP/IP agent. Messages route through the object’s tree to the statistically closest object replica, and the replica responds by sending the data contents directly to the requesting node. Our Tapestry data structures are statically built at the start of the simulation using full knowledge of the topology, and using hop count as the network distance metric. It should also be noted that our implementation is un-optimized and is likely slower than a real implementation would be. 4.3
The Attacks
We modeled two types of attacks in our simulations: Flooding Attacks. The first attacks we simulated flood some important node(s) and overload their queues to reduce the number of legitimate requests that get through. We randomly designated some nodes “agents”; the agents then stream a constant bit rate at the victim. We varied the number of agents as well as the severity (bit rate) of flooding. The life time of each agent was randomly chosen from 0 - 200 seconds with new agents immediately replacing those taken off-line.
346
Y. Chen et al.
For the CDS and RDS, we attacked the directory server(s). We attacked the closest analogy in Tapestry, the root of a hot object. For comparison with the CDS (RDS), we flood the root of one (four) hot object(s), keeping the number of attacked nodes the same. Corruption Attacks. As these attacks are system/service-specific, we only simulated two attacks here as examples. The first attack forces an important node to believe there is a link with negligible latency between the nodes which are actually the farthest apart. We attack the directory server of the CDS, a random directory server of the RDS and the Tapestry root node of a hot object for comparison. The second attack is specific to Tapestry; a malicious Tapestry node claims to be the root node of all objects. By replying with a negative result to any request it receives, this node can potentially convince clients that requested objects do not exist, denying them access to an existing resource. The question we ask here is “how many nodes are affected?”
5 5.1
Results Flooding Attacks
We performed simulations of flooding attacks on the CDS, RDS, and Tapestry with hot-cold and Zipf’s law workloads. The results were similar for both workloads, so we present only hot-cold results. Comparison of CDS and Tapestry: First, we compare the performance of CDS with Tapestry. We simulated one attacker at a rate of 500 or 2000 bytes every 5 ms or four attackers at rates between 500 bytes every 20ms and 500 bytes every 5ms. The results are shown in Figures 4 and 5. These figures reveal that a single attacker does not significantly influence performance, while distributed attackers, each flooding at the same high rate, cause severe denial of service. While a CDS suffers greatly under severe attacks, Tapestry shows some resistance. This can be explained by the distributed nature of Tapestry. Furthermore, Tapestry satisfies many requests before they reach the root: if we observe the attacked object exclusively, it retains more than 50% of its normal throughput. One interesting observation, as shown by the two rightmost sets of data in Figures 4 and 5, is that distributed attackers cause more severe DoS than a single attacker, even when injecting the same amount of flood traffic. The reason for this is that point-to-point attackers are limited by the bottleneck bandwidth from attacker to the victim. Figures 6 and 7 show the dynamics of the most severe flooding attacks on CDS and Tapestry. The attack(s) start at 40 seconds and end at 110 seconds. Given our simulation setup, the time to recover for CDS with both policies is 40 seconds. As Tapestry is not really affected much, its time to recover is negligible.
Quantifying Network Denial of Service
347
Fig. 4. Average response latency of CDS vs. Tapestry under DoS flooding attacks
Fig. 5. Throughput of CDS vs. Tapestry under DoS flooding attacks
Fig. 6. Dynamics of average response latency of CDS vs. Tapestry under DoS flooding attacks
Fig. 7. Dynamics of throughput of CDS vs. Tapestry under DoS flooding attacks
Comparison of RDS and Tapestry: To explore replicated directory service, we put four servers on widely-distributed, non-transit nodes. We investigated two policies: either the client contacts a random directory server (RDSr) or the closest one (RDSo). We did not simulate consistency traffic between directories. Again, the single flooding attack has little effect, so we only present results of DDoS attacks in Figure 8 and 9. We randomly selected four non-transit nodes as attackers. Each of these nodes attacks a directory server in a different subnet or the DDS root of a hot object; these attacks have little effect. We also randomly selected sixteen non-transit attack agents in groups of four, each from different subnets. Each group attacked one RDS directory server or the DDS root of a hot object. The attack rate varied from 500 bytes every 10ms to 500 bytes every 1ms, with each agent set to the same rate. Both forms of RDS and Tapestry are far more resilient to DoS than CDS (observe the difference in flooding rates along the X-axes). Thus, replication and topology-aware locality can significantly increase resilience to DoS attacks. In our simulations, the optimal RDS always performs better than Tapestry. This is because Tapestry may be forced to make traverse bottleneck links multiple
348
Y. Chen et al.
Fig. 8. Average response latency of RDS vs. Tapestry on DDos flooding attacks
Fig. 9. Throughput of RDS vs. Tapestry on DDos flooding attacks
Fig. 10. Nodes accessing each replica of an attacked object. Neighbor table corruption at the black square node renders all nodes enclosed by round-corner rectangles unable to locate the object. Simulation of 100 nodes and 60 objects (15% hot).
times, whereas the clients in the same subnet as an RDS directory server can avoid the bottlenecks entirely. A more interesting observation, however, is that Tapestry comes very close to optimal RDS; as the number of objects and size of network increases, the number of replicated directory servers required to compete with the self-organizing nature of Tapestry is likely to increase, making Tapestry a better overall choice. Meanwhile, Tapestry outperforms the random RDS on severe attacks, lending credence to the locality properties of Tapestry. 5.2
Corruption Attacks
When we compromised routing information at important nodes, the CDS and RDS, which access a random replica, are not affected5 . The performance of the 5
We assume that the directory server(s) are not routers or gateways.
Quantifying Network Denial of Service
349
Table 1. Attempting to rank the five different directory services Flooding attack (80%) replica 0.027 replica 0.023 dir server 0.17 dir server 0.48 0.35
Directory services CDS, CDS, RDS, RDS, DDS
random optimal random optimal
Corruption attack (10%) N/A 0.85 N/A N/A 0.978
Node spoofing attack (10%) N/A N/A N/A N/A 0.76
Total score Rank 0.2216 0.2034 0.336 0.584 0.4538
4 5 3 1 2
CDS which returns the optimal replica was degraded to 85%. The impact to Tapestry is negligible, with overall performance reduced by only 2.2%. We also simulated the Tapestry-specific node spoofing attack. The effects of the attack are displayed in Figure 10. The attack affects 24% of the network. 5.3
Resiliency Ranking
How might we combine the results of previous sections into a single ranking? As suggested in Section 3, we might assign weights to different types of attacks based on perceived severity or frequency. For instance, if we assign 80% weight to flooding attacks and 10% each to two “corruption” attacks, we can roughly rank the directory services as in Table 1. Here we simulate all eight attacks in Figures 4, 5, 8 and 9 for all three types of directory services and report a weighted sum of normalized throughputs. The weights are assigned in proportion to the amounts of flood traffic and the normalization is based on the corresponding directory service performance without attack; this will vary from system to system, but does give an idea how these services differ in terms of DoS resilience.
6
Limitations and Generalizations
While our study is very specific we feel that some of our methodology can be applied in a more general setting. In particular, our approach of simulating a complete, well-behaved system and then injecting malicious faults and measuring the consequences should be generally applicable. Of course, we only simulated static clients, servers, and attackers; one future task will be to incorporate more dynamic behavior. We also hope to extend the scope of our simulations to more applications. Note that the specifics, from system setup to the threat model, vary greatly from system to system. We hope to explore techniques for combining results across multiple dimensions, possibly extending the automated approach for weight generation suggested by Bayuk [2]. As more attempts are made to quantify the DoS resilience of different systems, we hope to more completely understand both the nature of DoS attacks and how to measure their impact.
7
Related Work
Early work by Gligor and Yu [11,25] built on the classic notion of a trusted computing base to define a “DoS Protection Base”. Yu and Gligor also pointed
350
Y. Chen et al.
out that denial of service is in fact an attack on resource availability. Millen believed that DoS is a problem of improper resource allocation [18], while Meadows has characterized the susceptibility of network services to DoS attacks on resources used before remote host authentication [17]. Some attacks rely on protocol weaknesses to consume resources with minimal attacker effort, as in TCP SYN flooding [22]; other attacks depend simply on the ability of an attacker to produce sufficient traffic to overwhelm a victim by brute force [7]. In [22], the authors investigated several approaches to fighting TCP SYN attacks and developed a tool which actively monitored the network for suspicious attack behavior and terminated dangling connections left by the attacker. In [23], the authors describe the use of an end-to-end resource accounting in the Scout operating system to protect against resource-based DoS attacks. Both these works present microbenchmarks testing the effectiveness of the proposed countermeasure. Our approach differs partly in that we investigate attacks on availability of a service, rather than on a particular server. Brown and Patterson [4] investigate the use of fault injection to benchmark availability and apply their methodology to software RAID systems. Our work is similarly based on injecting faults into a workload and investigating the effect, but our faults are malicious in nature.
8
Conclusions
In this paper, we explored the resilience of several object location services under denial of service attacks. We did this by creating a complete simulation environment, including realistic network topologies, server architectures and client behaviors. We then injected malicious attacks into the system and measured the availability of the attacked services. Not surprisingly, we discovered that distributed organizations are more resilient to DoS attacks than centralized ones. Our simulation framework is a first attempt to quantify the network DoS resilience of arbitrary systems and services. Acknowledgments. This research is supported by NSF career award #ANI9985250, DARPA grant #N66001-99-2-8913, and DARPA grant #DABT63-96C-0056. David Bindel is supported by an NSF Graduate fellowship. We would like to thank David Wagner, Ben Zhao, Adrian Perrig and Lakshminarayanan Subramanian who gave many valuable suggestions.
References 1. V. Almeida, et al. Characterizing reference locality in the WWW. In Proceeding of the IEEE Conf. on Parallel and Distributed Information Systems, 1996. 2. J. Bayuk, Measuring Security, First workshop on information-security-system rating and ranking, 2001 3. Lee Breslau, et al. Advances in network simulation. IEEE Computer, 33(5):59–67, May 2000. 4. A. Brown and D. Patterson, Towards availability benchmarks: A case study of software RAID systems. In Proceedings of the 2000 USENIX Conference.
Quantifying Network Denial of Service
351
5. Y. Chen, A. Bargteil, R. Katz, and J. Kubiatowicz. Quantifying Network Denial of Service: A Location Service Case Study UCB Tech. Report UCB/CSD-01-1150 6. CERT Coordination Center. Denial of service attacks. http://www.cert.org/tech tips/denial of service.html, 1999. 7. Symantec AntiVirus Research Center. W32.dos.trinoo. http://www.symantec.com/avcenter/venc/data/w32.dos.trinoo.html, 2000. 8. S. Czerwinski, B. Zhao, T. Hodes, A. Joseph, and R. Katz. An architecture for a secure service discovery service. In Proceedings of ACM MOBICOM, August 1999. 9. M. Delio New breed of attack zombies lurk, May 2001. http://www.wired.com/news/technology/0,1282,43697,00.html. 10. S. Dietrich, et al. Anaylzing distributed denial of service tools: the Shaft case. In Proceedings of the 14th Systems Administration Conference, 2000 11. V. Gligor. A note on the DoS problem. In Proceedings of the 1983 Symposium on Security and Privacy, 1983. 12. E. Guttman, C. Perkins, J. Veizades, and M. Day. Service Location Protocol, Version 2. IETF Internet Draft, November 1998. RFC 2165. 13. J. Howard. An Analysis of Security Incidents on the Internet. PhD thesis, Carnegie Mellon University, Aug. 1998. 14. T. Howes. The Lightweight Directory Access Protocol: X.500 Lite. Technical Report 95-8, Center for Information Technology Integration, U. Mich., July 1995. 15. Computer Security Institute and Federal Bureau of Investigation. CSI/FBI computer crime and security survey. In Computer Security Institute publication, 2000. 16. J. Jannotti, et al. Overcast: Reliable multicasting with an overlay network. In 4th Symposium on Operating Systems Design & Implementation, Oct. 2000. 17. C. Meadows. A formal framework and evaluation method for network denial of service. In Proc. of the IEEE Computer Security Foundations Workshop, 1999. 18. J. Millen. DoS: A perspective. In Dependable Computing for Critical Applications 4, 1995. 19. G. Plaxton, et al. Accessing nearby copies of replicated objects in a distributed environment. In Proceedings of SCP Symposium on Parallel Alg. and Arch. , 1997. 20. M. Rabinovich, et al. A dynamic object replication and migration protocol for an internet hosting service. In Proceedings of IEEE ICDCS, 1999. 21. S. Ratnasamy, P. Francis, M. Handley, R. Karp, and S. Schenker. A scalable content-addressable network. to appear in Proceeding of ACM SIGCOMM, 2001. 22. C. Schuba, I. Krsul, M. Kuhn, and et. al. Analysis of a DoS attack on TCP. In Proceedings of the 1997 IEEE Symposium on Security and Privacy, May 1997. 23. O. Spatscheck and L. Peterson. Defending against DoS attacks in Scout. In Proceedings of SOSP, 1999. 24. I. Stoica, et al. Chord: A scalable peer-to-peer lookup service for Internet applications. to appear in Proceedings of ACM SIGCOMM, 2001. 25. C. Yu and V. Gligor. Specification and verification method for preventing denial of service. IEEE Transactions on Software Engineering, 16(6), June 1990. 26. E. Zegura, K. Calvert, and S. Bhattacharjee. How to model an internetwork. In Proceedings of IEEE Infocom, 1996. 27. B. Zhao, J. Kubiatowicz, and A. Joseph. Tapestry: An infrastructure for faulttolerant wide-area location and routing. UCB Tech. Report UCB/CSD-01-1141.