Aug 24, 2016 - An application to climate change. Gábor Drótos,1,2 ... call the bias, is a useful measure of nonergodicity, for any window length. In contrast, the ...
PHYSICAL REVIEW E 94, 022214 (2016)
Quantifying nonergodicity in nonautonomous dissipative dynamical systems: An application to climate change G´abor Dr´otos,1,2 Tam´as B´odai,3 and Tam´as T´el1,2 1
Institute for Theoretical Physics, E¨otv¨os University, P´azm´any P´eter s´et´any 1/A, H-1117 Budapest, Hungary 2 MTA–ELTE Theoretical Physics Research Group, P´azm´any P´eter s´et´any 1/A, H-1117 Budapest, Hungary 3 Meteorological Institute, University of Hamburg, Hamburg, Germany (Received 7 August 2015; revised manuscript received 23 July 2016; published 24 August 2016)
In nonautonomous dynamical systems, like in climate dynamics, an ensemble of trajectories initiated in the remote past defines a unique probability distribution, the natural measure of a snapshot attractor, for any instant of time, but this distribution typically changes in time. In cases with an aperiodic driving, temporal averages taken along a single trajectory would differ from the corresponding ensemble averages even in the infinite-time limit: ergodicity does not hold. It is worth considering this difference, which we call the nonergodic mismatch, by taking time windows of finite length for temporal averaging. We point out that the probability distribution of the nonergodic mismatch is qualitatively different in ergodic and nonergodic cases: its average is zero and typically nonzero, respectively. A main conclusion is that the difference of the average from zero, which we call the bias, is a useful measure of nonergodicity, for any window length. In contrast, the standard deviation of the nonergodic mismatch, which characterizes the spread between different realizations, exhibits a power-law decrease with increasing window length in both ergodic and nonergodic cases, and this implies that temporal and ensemble averages differ in dynamical systems with finite window lengths. It is the average modulus of the nonergodic mismatch, which we call the ergodicity deficit, that represents the expected deviation from fulfilling the equality of temporal and ensemble averages. As an important finding, we demonstrate that the ergodicity deficit cannot be reduced arbitrarily in nonergodic systems. We illustrate via a conceptual climate model that the nonergodic framework may be useful in Earth system dynamics, within which we propose the measure of nonergodicity, i.e., the bias, as an order-parameter-like quantifier of climate change. DOI: 10.1103/PhysRevE.94.022214 I. INTRODUCTION 1
Ergodicity plays a central role in the foundation of statistical mechanics (see, e.g., [1]). Loosely speaking, ergodicity means that the time average of a long time series is equal to the average of the same quantity taken over a properly defined ensemble. In many systems in thermal equilibrium the Gibbs ensembles provide the appropriate instantaneous phase space averages. New impetus to ergodic research was given by the exploration of chaotic dynamical systems. In dissipative dynamical systems with a constant or time-periodic driving the appearance of chaotic attractors is a common phenomenon, and the natural measure (the Sinai-Ruelle-Bowen or SRB measure) of the attractor is found to be ergodic, see, e.g., [2,3]. An important difference between the two cases is the following. In normal macroscopic systems even the shortest observational times are several orders of magnitude larger than the characteristic (microscopic) time, and hence ergodicity is found to be typically fulfilled. This is, however, not the case with dynamical systems. Besides individual attempts (see, e.g., [4,5]), no systematic study is available about how long the length of the time series should be in order to ensure a reasonable agreement between temporal and ensemble averages. A well-established theory of natural measures, μ, on chaotic attractors holds for dissipative dynamical systems that are either autonomous or driven by a temporally periodic driving.
1
As usual in physics, we call a dynamical system ergodic if it obeys Birkhoff’s equality of time and ensemble averages. 2470-0045/2016/94(2)/022214(16)
This theory is most commonly based on the set of unstable periodic orbits (see, e.g., [6]), and ergodicity is known to be valid in this class only [2]. There exist, however, nonautonomous dissipative dynamical systems characterized by parameter shifts, or, more generally, by temporally aperiodic drivings which can be considered generic in nature. This is the case with Lagrangian coherent structures [7], or with power grids experiencing an increasing demand [8]. For other examples see [9]. Since there is a growing concern that the observed increase of greenhouse gases may lead to dramatic changes in the Earth system, perhaps the most striking example for continuous parameter shifts occurs in the dynamics of climate change [10,11]. In such dynamical systems ergodicity has not yet been investigated. There is an increasing amount of evidence supporting that a concept ideally suited to the study of dynamical systems with arbitrary time dependence is that of snapshot attractors [12] (also called pullback attractors in the mathematics and in part of the climate-related literature [13–17]). Loosely speaking, a snapshot attractor is an object belonging to a given time instant that is traced out by an ensemble of a large number, N � 1, of trajectories initialized in the past, all of them governed by the same equation of motion. In the dynamical systems community, the concept of snapshot attractors has been known and successfully applied for many years [12,18–25]. A precursor was the discovery of synchronization by common noise (i.e., by the same realization of a random driving) by Pikovsky [26,27], a case when—in the current terminology—the snapshot attractor turns out to be regular. Instead of random drivings, most often considered in the physics literature, deterministic drivings are more natural
022214-1
©2016 American Physical Society
´ ´ ´ DROTOS, BODAI, AND TEL
PHYSICAL REVIEW E 94, 022214 (2016)
to consider in the climatic context, because a climate change is most simply induced by a smooth shift of parameters in time, without including any stochasticity [28–30]. In this paper thus only deterministic drivings are considered. In particular, we investigate relatively fast parameter shifts which exclude the applicability of an adiabatic approximation. We also restrict our investigations to snapshot attractors that underlie a complex, chaoticlike dynamics. An appealing feature of such a snapshot attractor is that it carries [15] a unique probability measure (the natural measure, the analog of the SRB measure of usual attractors). The ensemble representing the natural measure is provided by trajectories evolving from a set of different initial conditions; these trajectories shall thus also be called different realizations. The natural measure is independent of the particular choice of the set of initial conditions used for its representation. From a practical point of view, this independency holds after a convergence time (which shall be denoted by tc ) has passed from the initialization of the ensemble. The concept of the convergence time relies on the exponential convergence to attractors which is expected to characterize dissipative dynamical systems. The snapshot attractor and its natural measure is thus determined with an “exponential accuracy” after a time interval of length tc (for more details see [30]). It was numerically demonstrated already by Romeiras, Grebogi, and Ott [12] in their setup that any single long trajectory traces out a pattern in the phase space that differs strongly from the pattern of an ensemble in any time instant. This is a clear indication for the breaking down of ergodicity in dissipative nonautonomous systems with a generic time dependence. Our aim in this paper is to quantify the degree of nonergodicity in such systems. A feature we have to take into account is that temporal averages over infinitely long time intervals are unrealistic to carry out in practice (especially in systems with parameter shifts). It will be shown to be meaningful to concentrate on temporal averages taken over a time window of finite length along a single realization, and to compare them with averages taken over the ensemble in a time instant. The difference between these quantities, which we call the nonergodic mismatch, is a quantity depending on the realization. Because of this property, one should study, instead of individual cases, the probability distribution of the nonergodic mismatch in the system. A goal of our paper is to argue that a proper measure of the systems’ nonergodicity is the average of this distribution (i.e., the ensemble average of the nonergodic mismatch) which differs from zero only in nonergodic cases, for any generic choice of the window length. A further goal is to point out that the ensemble average of the absolute value of the nonergodic mismatch (which we call the ergodicity deficit, and which is the expected error of a single-realization temporal average with respect to the ensemble average) cannot be made arbitrarily small in nonergodic cases. These results have been obtained by careful reasoning following theoretical considerations and are supposed to hold in a rather universal context. We support our findings numerically within an elementary climate model in the main text, and with further examples in Appendix D. The paper is organized as follows. In Sec. II we briefly introduce our particular model system, the details of which are
given in Appendix A. Section III is devoted to the analysis of the probability distribution of the nonergodic mismatch. The closing Sec. IV summarizes the main findings and provides a discussion. Further aspects of the problem are illustrated in appendices: Appendixes B and C provide an extension to the concept of the nonergodic mismatch, and an investigation of the time dependence of the nonergodic mismatch distributions, respectively. Appendix D reinforces our main findings with two additional driving functions both in the climate model and in a nonautonomous mapping. For completeness, the same analysis as in the main text is carried out with an alternative concept of ergodicity in Appendix E, and leads to the conclusion that stationary and changing climates cannot be distinguished from the point of view of this alternative concept of ergodicity. II. CLIMATE MODEL EXAMPLE
Our main illustrative example is based on a low-order model of atmospheric circulation introduced by Lorenz [31] (different from that of the celebrated Lorenz attractor [32]). This appealing model was studied in several contexts [28,33– 44]. It represents a coupled dynamics between the averaged wind speed of the Westerlies on one hemisphere, represented by the variable x, and two modes of cyclonic activity, denoted by y and z. The model reads as follows: x˙ = −y 2 − z2 − ax + aF (t),
(1a)
y˙ = xy − bxz − y + G,
(1b)
z˙ = xz + bxy − z,
(1c)
with the standard parameter setting: a = 1/4, b = 4, G = 1. The equations appear in a dimensionless form with the time unit corresponding to 5 days, according to [31]. The driving appears via the temperature contrast parameter F (t) which represents the temperature difference between the Equator and the pole and which can mimic the effect of the increasing greenhouse gas content. To include seasonality and to separate it from the greenhouse gas forcing we write (as in [30]) F (t) = F0 (t) + AF sin (ωt),
(2)
where ω = 2π/73 represents the annual frequency (as one year is T = 73 time units), and the amplitude of the annual oscillations is AF = 2 (as in [45]). The center F0 (t) of the temperature contrast parameter is assumed to decrease linearly (according to an increase of the greenhouse gas content) by two units over 100T = 100 yr: � 9.5 for t � 0, F0 (t) = (3) 2t 9.5 − 100T for t > 0. Climate change (i.e., a shift in the dynamics) sets in at time t = 0; before this time instant a stationary climate (i.e., a stationary dynamics) is present, governed by F0 = 9.5 = const. The corresponding chaotic attractor is usual and thus ergodic (for infinite window lengths [2]). This chaotic attractor coincides with the snapshot attractor for t < 0, while for t > 0 the dynamics can be characterized properly by the snapshot attractor and its natural measure only.
022214-2
QUANTIFYING NONERGODICITY IN NONAUTONOMOUS . . .
Of natural interest is the average of a quantity ϕ [an arbitrary function ϕ(x) of the phase space position x = (x,y,z)] taken with respect to the natural measure μ of the snapshot attractor belonging to a time instant t. This ensemble average shall be denoted as Aμ (ϕ(t)), and is well approximated for N � 1 as Aμ (ϕ(t)) =
N 1 � ϕi (t), N i=1
(4)
where ϕi (t) corresponds to the ith member of the ensemble in the time instant t.2 Appendix A provides a detailed description of the numerical method, and also an overview of how the snapshot attractor, and a particular ensemble average evolve in time. One point to emphasize is that we wish to eliminate the effects arising from the annual component of the driving, so that we take only one time instant from every time period T (a given “day” of the year). That is, we define a stroboscopic map, for all numerical investigations throughout this paper. III. DIFFERENCE BETWEEN TEMPORAL AND ENSEMBLE STATISTICS A. Probability distribution of the nonergodic mismatch
For characterizing temporal averages, we have to choose the length of the time interval (in what follows: the time window) over which the average is taken. Let us denote this by τ . We consider it to be an essential part of the problem that this window cannot be taken arbitrarily large in practice. First, one might wish to concentrate only on particular intervals within the time evolution of the system, e.g., on the intervals in which the parameter shift of interest takes place.3 Second, we shall see (Sec. III C) that the convergence of the time average, for increasing τ , to a limiting value is rather slow (without any characteristic time), thus no practically accessible time window exists which would represent an infinite window length faithfully, not even in an ergodic dynamics. In this section, we ask the question if one can find a criterion for distinguishing ergodic and nonergodic cases even without carrying out the τ → ∞ limit. Therefore, in what follows we use finite window lengths. Let ϕ(t) denote a single time series of a quantity, i.e., a time series of a given function of the phase space position x(t) = (x(t),y(t),z(t)) of a trajectory that started at a single initial position x0 = (x0 ,y0 ,z0 ) corresponding to some initial time instant t0 . x(t) [or any derived quantity ϕ(t)] is a single member of the ensemble, or, in the terminology of Sec. I, a single realization of the dynamics. The time average Aτ of
PHYSICAL REVIEW E 94, 022214 (2016)
ϕ(t) taken over the time window of length τ , ordered to time t in a midpoint convention4 (t shall be called the “time of observation”), reads as � 1 t+τ/2 ϕ(t � )dt � . (6) Aτ (ϕ(t)) = τ t−τ/2 Any time average Aτ is, by definition, a property of the particular realization emerging from x0 in t0 , and we shall call it a single-realization temporal (SRT) average. A possible quantity characterizing a deviation of the SRT average from the ensemble average is the difference between these averages. This difference we shall call the nonergodic mismatch with a time window of length τ , associated to the time instant t of observation: δτ (t) = Aτ (ϕ(t)) − Aμ (ϕ(t)).
(7)
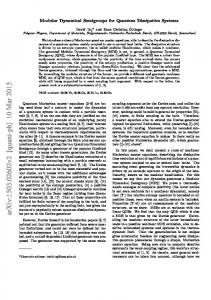
This mismatch, too, depends on which particular realization is chosen.5 In other words, each realization (initial condition) provides a different value for δτ (t), even in an ergodic dynamics, because each trajectory has opportunity to visit only a subset of the accessible phase space positions during the time window τ . One should, therefore, consider the probability density function (pdf) of δτ (t) which we shall call the nonergodic mismatch pdf and denote by P (δτ (t)). We shall point out the differences in the nonergodic mismatch pdfs arising from time instants t that are taken from a stationary and a changing climate. For a numerical illustration in the Lorenz model, we choose the variable y (one mode of cyclonic activity) as the quantity ϕ, and numerically determine6 the nonergodic mismatch pdf P (δτ ) as a histogram. In particular, we divide the δτ axis into small bins and count the number of single realizations out of our ensemble of trajectories, initiated with different initial positions x0 at t0 = −250 yr, that produce a δτ value falling into a particular bin. Histograms obtained this way are shown in Fig. 1 for three different window lengths τ in two time instants t which are taken from a stationary and a changing climate. (Throughout our paper we choose τ and t such that the corresponding time interval belongs strictly to either type of climate, see the insets of Fig. 1.) Figure 1 illustrates that these histograms are not sharp at all. The examples of Figs. 1(a) and 1(b), corresponding to a stationary and a changing climate, respectively, show the clear difference between these two cases. The most interesting characteristics are a driving-induced bias, a spread due to the finite window length, and a nonzero average of the absolute value of the nonergodic mismatch which we shall call ergodicity deficit. These are detailed in the next subsections.
2
Formally, with μ(t) being the time-dependent natural measure at time t, the ensemble average of ϕ is written as � (5) Aμ (ϕ(t)) = ϕdμ(t). 3
Note that a parameter shift of diverging nature cannot last arbitrarily long in physically relevant systems. In case it does, the τ → ∞ limit of time averages is not guaranteed to be well defined. Time averages can always be evaluated, however, within time windows of finite length.
4
For practical purposes, it should also be decided in a driven dynamics which time instant the temporal average is ordered to. Any choice would lead to qualitatively similar results. For our numerical investigations we choose the midpoint of the time window. 5 For τ → 0 the SRT average Aτ (ϕ(t)) becomes the instantaneous value of ϕ(t) so that, irrespectively of whether the dynamics is ergodic, Aμ (δτ =0 (t)) = 0. 6 The integral in Eq. (6) simplifies to a sum in the stroboscopic map of our model system.
022214-3
´ ´ ´ DROTOS, BODAI, AND TEL
6
10 8
τ = 4yr τ = 72yr τ = 148yr
6
6 0 t [years]
100
4
(b) Year 76
10 8
τ = 4yr τ = 72yr τ = 148yr
6 -100
0 t [years]
100
P(δτ)
-100
F0
F0
(a) Year -75
P(δτ)
4
PHYSICAL REVIEW E 94, 022214 (2016)
2
0
2
-0.8
-0.4
0 δτ
0.4
0
0.8
-0.8
-0.4
0 δτ
0.4
0.8
FIG. 1. Nonergodic mismatch pdfs P (δτ (t)) based on the variable ϕ = y, calculated over the numerical ensemble of N = 106 trajectories described in Appendix A. In each panel we compare three different values of the window length τ . The time instants t of observation are indicated above the panels and are taken from a stationary and a changing climate. In the insets we show the time dependence (3) of the parameter F0 of (2), mark the time instants t of observation by vertical gray dot-dashed lines, and indicate the different time windows (of length τ ) in the same color (shade of gray in print) as in the main plot. The ensemble size appears to realize the asymptotic limit in the sense that we do not find any considerable change in the graphs when plotting the results for N = 10 000, 20 000, or 106 . For the histogram, the bin size is 0.025.
B. Bias, due to driving
In a stationary climate a usual attractor is present on which the dynamics is ergodic: if stationarity holds eternally, then SRT and ensemble averages coincide for τ → ∞ [2]. For finite window lengths τ we claim that the ensemble average Aμ (δτ ) of the nonergodic mismatch is zero (regardless of the particular choice for τ ). This can be justified by considering the values along a single time series to be samples drawn from the same distribution (which is the natural measure of the usual attractor): the sample average is known to estimate the ensemble average without any bias. Additionally, the nonergodic mismatch pdf is symmetric with respect to zero, since, according to the central limit theorem [46], P (δτ ) approximates a Gaussian for larger values of τ . The fact that Aμ (δτ ) = 0 means, in view of (7), the following: although the SRT average Aτ (ϕ) for a particular realization typically differs from the ensemble average Aμ (ϕ) of ϕ, the ensemble average Aμ (Aτ (ϕ)) of the SRT average coincides with the ensemble average Aμ (ϕ), for any τ . This can be considered as an extension of the ergodic theorem for finite window lengths. In a changing climate, however, the ensemble average Aμ (Aτ (ϕ)) of an SRT average typically gives a biased value compared to the corresponding ensemble average Aμ (ϕ) (i.e., they are “expected” to differ). The bias is a consequence of the SRT average incorporating, with increasing τ , more and more information corresponding to time instants that are different from and are farther and farther away from the time instant t of interest. Such information is not up to date (partially obsolete and partially originates in the future) if the snapshot attractor and its natural measure change in time. One then concludes, for a generic time dependence of the dynamics, that the ensemble average Aμ (δτ ) = Aμ (Aτ (ϕ)) − Aμ (ϕ) of the nonergodic mismatch differs from zero for any generic finite window length τ . Furthermore, in such cases Aμ (δτ ) remains nonzero even for τ → ∞ if this limit can meaningfully be
carried out. This finding is the breakdown of ergodicity. In what follows, we shall call the ensemble average Aμ (δτ ) of the nonergodic mismatch the bias (which depends on the window length τ and also on the time instant t of observation). Given that Aμ (δτ ) = 0 in an ergodic dynamics for any τ , it also follows that the bias Aμ (δτ ) provides an appropriate measure of nonergodicity (i.e., for how different the system is from an ergodic system) when observed on a time interval of τ around a particular time instant t. This is then a tool to decide if a system exhibits ergodicity around a time instant t based on using temporal averages of finite length only.7 This indicative nature of the bias may be regarded as an unexpected analogy with an order parameter. The analogy is even more complete due to the fact that the bias may take on both positive and negative values which breaks the symmetry of the state that is characterized by its zero value. The numerical results presented in Fig. 1 support the generic nature of the above argumentations. An even better illustration is given in Fig. 2 where the bias Aμ (δτ ) is plotted as a “continuous” function of the window length τ for the two time instants of observation of Fig. 1. The bias Aμ (δτ ) can be seen to be identically zero in the stationary climate, while it increases considerably with τ in the changing case. In the latter case, it starts from a small value, because short time windows contain little amounts of inappropriate information. After a rapid increase in value from about 0 to 0.2, it is seen to switch at about τ = 25 yr to a moderate increase from about 0.2 to 0.25, in harmony with the fact that the ensemble average Aμ (y) typically fluctuates (cf. Fig. 5 in Appendix A) in time t within a band of width 0.5.
More precisely, Aμ (δτ ) = 0 is a necessary condition for a system to be ergodic. 7
022214-4
QUANTIFYING NONERGODICITY IN NONAUTONOMOUS . . .
0.4
1
Year -75 Year 76
Year -75 Year 76
σμ(δτ)
0.3 Aμ(δτ)
PHYSICAL REVIEW E 94, 022214 (2016)
0.2 0.1
0.1
0 0
25
50
75 τ [years]
100
125
150
FIG. 2. The bias Aμ (δτ ) as a “continuous” function of the window length τ , calculated for the numerical ensemble of 106 trajectories, where the nonergodic mismatch δτ is based on the variable y, as in Fig. 1. The time instants t of observation are year −75 (flat black line, stationary climate) and year 76 [magenta line (gray in print), changing climate]. C. Spread, due to the finite window length
A considerable width of the nonergodic mismatch pdf P (δτ ) means a considerable “spread” among single realizations, and this implies that one single realization is not representative for the ensemble behavior sought, for any finite value of τ . In other words, it is not sufficient in such cases to investigate the SRT average of one particular realization in order to draw any meaningful conclusion related to the appropriate statistics of a quantity ϕ. In a stationary climate, the width of P (δτ ), representing √ the spread, decreases with increasing τ according to a 1/ τ law. This is so because, as explained in Sec. III B, P (δτ ) approximates a Gaussian for larger values of τ according to the central limit theorem, and√the standard deviation σμ of such a Gaussian decreases as 1/ τ with increasing τ . In the numerical examples of Fig. 1 the decreasing width with increasing τ is obvious. In the stationary climate of Fig. 1(a) the shape of P (δτ ) is indeed Gaussian-like, and, surprisingly, this is also true for the changing climate of Fig. 1(b). The standard deviation σμ is what we shall call the spread in both cases. We present the dependence of σμ (δτ ) on the window length τ in Fig. 3 for the two time instants of Fig. 1.8 Numerically, we find an almost perfect agreement √ with the 1/ τ law in the stationary climate (black line), and the agreement turns out to be reasonably good in the changing climate as well [light blue line (gray in print)]. The latter finding appears to be in harmony with a recent mathematical result on generalized central limit theorems in nonautonomous systems by [47].
8
σμ (δ� τ) �N
has
been �N
calculated 2
as:
σμ (δτ ) =
(which is the unbiased i=1 (δτ,i − j =1 δτ,j ) estimator for Gaussian distributions from sample data) where δτ,i is the nonergodic mismatch corresponding to the ith member of the ensemble. We use the same estimator in the changing climate because of the similar shape of the nonergodic mismatch pdfs of the two cases. (N−3)!! (N−2)!!
1 N
10 τ+1 [years]
100
FIG. 3. The spread σμ (δτ ) as a function of the number of years, τ + 1, included in the temporal average, plotted on a doubly logarithmic scale, calculated for the numerical ensemble of 106 trajectories, where the nonergodic mismatch δτ is based on the variable y, as in Fig. 1. The time instants t of observation are year −75 (black line, stationary climate) and year 76 [light blue line (gray in print), changing climate]. The dashed line is of slope −1/2 to guide the eye.
From a more general point of view, the convergence of the nonergodic mismatch pdfs to sharp shapes turns out to be, in both stationary and changing climates, a scale free problem, i.e., no characteristic times can be defined for the power-law convergence with increasing window length τ . One can see from Fig. 3 that the standard deviation of year 5 falls to 10 percent of its original value in about 200 yr, and would fall to one percent of it in about 20 000 yr. This property is in strong contrast with the convergence with increasing time t of an ensemble towards a snapshot attractor (examples can be seen in Fig. 5(b)) which is exponential, as discussed in Sec. I. The latter process can be characterized by a characteristic time tc (tc = 5 yr in our example). This corresponds to an exponential convergence to the snapshot attractor which numerically ensures a phase-space-distance accuracy of about 10−3 within tc . Reaching a snapshot attractor with an ensemble of trajectories in time is thus much faster than reaching the ergodic property for individual trajectories in window length.9 (The price for the fast convergence is the use of an ensemble instead of individual realizations.) The fact that it is hopeless to choose time windows sufficiently long to typically observe δτ ≈ 0 supports a posteriori our choice to focus on cases with finite window lengths τ . D. Ergodicity deficit
We emphasize that both a large bias Aμ (δτ ) and a large spread σμ (δτ ) lead to the inapplicability of single-realization temportal (SRT) averages for estimating ensemble averages in nonautonomous dissipative dynamical systems with a generic time dependence. One can reduce the bias and the spread by decreasing and increasing τ , respectively: this is a tradeoff situation. Therefore, one may not be able to find
9
By the latter, we mean reaching a sharp nonergodic mismatch pdf that is centered on zero.
022214-5
´ ´ ´ DROTOS, BODAI, AND TEL
0.4
PHYSICAL REVIEW E 94, 022214 (2016)
(a) Year -75 Aμ(δτ) σμ(δτ) Aμ(|δτ|)
0.3 0.2
0.1
0
0 25
50
75 τ [years]
100
Aμ(δτ) σμ(δτ) Aμ(|δτ|)
0.2
0.1
0
(b) Year 76
0.3
δτ
δτ
0.4
125
150
0
25
50
75 τ [years]
100
125
150
FIG. 4. The ergodicity deficit Aμ (|δτ |), compared to the bias Aμ (δτ ) and the spread σμ (δτ ), as a function of the window length τ , calculated for the numerical ensemble of 106 trajectories, where δτ is based on the variable y, as in Fig. 1. The time instants t of observation are indicated in the panels and are taken from a stationary and a changing climate.
any intermediate value for τ for which an SRT average would estimate well the ensemble average from a practical point of view. It is worth introducing a further quantity for characterizing the magnitude of the error an SRT average is expected to carry. We choose the ensemble average Aμ (|δτ |) of the modulus of the nonergodic mismatch since this might be the simplest and the most natural quantity for this purpose: it is the expected distance of an SRT average from the ensemble average, i.e., the expected error of the SRT average. We shall call Aμ (|δτ |) the ergodicity deficit with a time window of length τ , associated to a particular time instant t of observation. Note that the ergodicity deficit is nonzero for any finite value of τ in both stationary and changing climates, corresponding to ergodic and nonergodic cases, respectively. In a stationary climate, when there is no bias, the ergodicity deficit originates solely in the spread among the individual realizations. In such cases Aμ (|δτ |) is expected to carry the same information as σμ (δτ ). In a changing climate, similarly to a stationary climate, the ergodicity deficit Aμ (|δτ |) describes the spread among the different realizations as long as the bias Aμ (δτ ) is small. This is so for small values of τ . For increasing τ , however, the bias Aμ (δτ ) plays a more and more important role in determining the ergodicity deficit Aμ (|δτ |). Finally, for large values of τ , Aμ (|δτ |) and |Aμ (δτ )| become approximately the same: the spread of the pdf P (δτ ) drops sooner or later well below the modulus |Aμ (δτ )| of the bias.10 We illustrate these considerations in Fig. 4 by plotting together the τ dependence of the bias Aμ (δτ ), of the spread σμ (δτ ), and of the ergodicity deficit Aμ (|δτ |), for the same two time instants t of observation as in Fig. 1. In Fig. 4(a),
taken in a stationary climate, the ergodicity deficit Aμ (|δτ |) is practically a rescaled version11 of the spread σμ (δτ ). In the changing climate case of Fig. 4(b), the ergodicity deficit Aμ (|δτ |) describes the spread σμ (δτ ) for small values of τ , up to about τ = 20 yr. For increasing τ , the bias Aμ (δτ ) increases from zero to considerable values, and this is clearly seen to influence the functional dependence of the ergodicity deficit Aμ (|δτ |) on τ . Finally, as anticipated, Aμ (|δτ |) and Aμ (δτ ) “merge,” along with the decrease of the spread σμ (δτ ). In our particular case this is already observed when reaching τ = 100 yr, as a consequence of the negligible probability for δτ < 0, as Fig. 1(b) illustrates. In total, one can observe that the τ dependence of the ergodicity deficit Aμ (|δτ (t)|) follows very closely the larger out of the values of the spread σμ (δτ (t)) and of the bias Aμ (δτ (t)), i.e., Aμ (|δτ |) ≈ max (σμ (δτ ),|Aμ (δτ )|). The ergodicity deficit Aμ (|δτ |) thus incorporates in general both effects, the spread and the bias, that lead to the deviation of an SRT average from the corresponding ensemble average. In addition, Aμ (|δτ |) provides a natural quantification for this error of an SRT average. In the particular case of Fig. 4(b) this deviation is never small, any statistics extracted from the time evolution of a single realization is thus always meaningless from a probabilistic point of view. We emphasize that this conclusion, according to our argumentations, is expected to hold in any chaoticlike dissipative dynamical system that changes in time relatively fast.12 Our original definition (7) of the nonergodic mismatch is restricted to averages. We emphasize that all of our results hold for more general statistical quantities. This is illustrated numerically in Appendix B.
10 In systems with a generic time dependence, there may occur arbitrarily large values of τ for which the bias Aμ (δτ ) happens to be zero, but such values of τ are exceptional along the complete τ axis and depend strongly on the time instant t of observation (cf. Appendix C). If the natural measure changes smoothly in time due to a monotonic parameter shift such values of τ typically do not exist at all.
11 √ By assuming a Gaussian shape for P (δτ ), the rescaling factor is 2/π ≈ 0.798. Numerically, the ratio is found √ to be approximately 0.809 for small τ , and to converge rapidly to 2/π for increasing τ : it is already 0.799 for τ = 25 yr. 12 That is, if the autocorrelation time of any ensemble average is not longer than the time during which a single time series “forgets” its initial conditions.
022214-6
QUANTIFYING NONERGODICITY IN NONAUTONOMOUS . . . IV. CONCLUSIONS AND DISCUSSION
Three relevant quantities have been introduced for characterizing nonergodicity: (i) The bias Aμ (δτ (t)) measures how different the system is from an ergodic system when observed in a time window of length τ around a particular time instant t. Aμ (δτ (t)) is an order-parameter-like quantity which can differ from zero in nonergodic systems only. (ii) The spread σμ (δτ (t)) indicates how unrepresentative a single-realization temporal average, taken with a given window length τ , is for the ensemble behavior. (iii) Finally, the ergodicity deficit Aμ (|δτ (t)|) stands for the expected error of a single-realization temporal average when estimating the ensemble average at t. The last two quantities, in contrast to the bias, are nonzero in both ergodic and nonergodic systems, due to the finite length τ of the time window. In our experience, the bias Aμ (δτ (t)) usually increases in magnitude and never approaches zero with increasing window length, provided that a nonperiodic driving is present. This means that the ergodic theorem does not hold in such systems. Furthermore, we found that the ergodicity deficit Aμ (|δτ (t)|) lies close to the larger out of the modulus |Aμ (δτ )| of the bias and the spread σμ (δτ (t)). Given the tradeoff situation that the spread, in contrast to the bias, increases with decreasing window length, one is not able to arbitrarily reduce the ergodicity deficit, i.e., the expected error of a single-realization temporal average, in the presence of a nonperiodic driving. We emphasize that even if the bias Aμ (δτ ) happens to be 0, observations over finite window lengths τ exhibit a nonzero ergodicity deficit, Aμ (|δτ |) > 0, due to the spread between different realizations which is characterized by σμ (δτ ) > 0. If this was to be catered for by increasing τ , it might well be that precious little is achieved due to the slow scale-free decay of the spread σμ (δτ ) with τ . Since aperiodically driven nonautonomous systems are generic in nature, it can be expected that by increasing τ there will always be a value beyond which the bias Aμ (δτ ) becomes nonzero, also yielding a contribution to the ergodicity deficit. This would be so, e.g., in the stationary climate of our model system if we let the time windows of length τ reach into the t > 0 interval. By constraining τ to avoid this situation we could successfully analyze the properties, within a finite temporal regime, of a hypothetic eternal stationary climate in which ergodicity (defined via τ → ∞) is fulfilled. This indicates that it may be useful to talk about ergodic regimes in time even if the complete dynamical system is not ergodic. We suggest ergodic regimes to be recognized by Aμ (δτ (t)) = 0 up to a certain value of τ . It is clear from, e.g., the above discussion that the bias, the spread, and the ergodicity deficit depend on the time instant t, i.e., they exhibit a time evolution. This time evolution may be nontrivial. Its detailed discussion for our particular model system is given in Appendix C. We note that a recent approach [15] in the mathematics literature formally restores ergodicity also in nonautonomous dynamical systems by redefining temporal averages. This approach is artificial from a physical point of view, because it transforms formal temporal averages to ensemble averages. As illustrated in Appendix E, we numerically found these artificial temporal averages to tend to the ensemble averages (taken with
PHYSICAL REVIEW E 94, 022214 (2016)
respect to the natural measure) with the increasing length of the time window for averaging, both in the stationary and in the changing climate of our model system. This ergodicity concept thus makes no distinction between what we called ergodic and nonergodic cases so far. The advantage of knowing whether a system is ergodic or nonergodic lies in the fact that in the former case the usual theories of dynamical systems, e.g., the ones based on periodic orbits (see, e.g., [2,6]) are likely to be applicable, while otherwise only the snapshot attractor approach remains. This branch of research is currently rapidly evolving and sheds light on phenomena not only in the climatic context (see, e.g., [48–50]), but also on general aspects of dynamical systems, like, e.g., transitions in many degree of freedom chaotic systems [51]. ACKNOWLEDGMENTS
Useful discussions with M. Ghil, D. Sz´asz, and L.-S. Young are acknowledged. We benefited from helpful comments by T. Haszpra. This work was supported by OTKA under Grant No. NK100296. The support of the Alexander von Humboldt Foundation is also acknowledged. T.B. is grateful for support from the NAMASTE project (under ERC Grant No. 257106) headed by V. Lucarini. APPENDIX A: SNAPSHOT ATTRACTOR OF THE CLIMATE MODEL EXAMPLE
Equations (1)–(3) are numerically solved by the classical fourth-order Runge-Kutta method with a fixed time step �t = 0.005 ≈ 6.85 × 10⁻⁵ yr. In order to generate the natural measure of the snapshot attractor at time t, we start a large number, N = 106 , of trajectories distributed uniformly in a box [−1.5,3.5] × [−2.5,2.5] × [−2.5,2.5] at a negative time, t0 = −250 yr, and monitor the full ensemble up to time t (which can be either positive or negative). This ensemble of trajectories is used throughout the paper to represent the natural measure. As demonstrated in [30], the convergence time to the snapshot attractor and its natural measure is about tc = 5 yr, and thus the ensemble can be considered to represent the natural measure well for t > t0 + tc . Before the onset of the climate change, t = 0, the snapshot attractor is also a usual attractor since the driving is periodic. The attractor and its natural measure is of course nonperiodically time dependent in the climate change period, i.e., for t > 0. Numerically we investigate the time interval [−150yr,150yr]. After 150 yr the dynamics (1)–(3) loses internal variability along the ramp (3), and we do not consider time instants before −150 yr in order to provide a symmetric investigation. In order to obtain an impression on how an ensemble average, and also the snapshot attractor and its natural measure μ(t) themselves, evolve in time, we choose ϕ = y. In Fig. 5(a) we plot the ensemble average Aμ (y(t)), and the projection of the natural measure onto the variable y, as a function of time. In particular, we numerically approximate the natural measure by a histogram, coded by the brightness, in every considered time instant. The ensemble average Aμ (y(t)) can be evaluated numerically by integrating y with respect to this histogram as a density, but it is more efficient to simply calculate the arithmetic mean of all the y values in the ensemble
022214-7
´ ´ ´ DROTOS, BODAI, AND TEL
PHYSICAL REVIEW E 94, 022214 (2016)
(a)
1
2
0.8
1 0.6 y
0 0.4 -1 0.2
-2
The stationary climate appears very clearly as a timeindependent pattern in Fig. 5(a) before t = 0. For t > 0 a very complicated time evolution can be seen. Besides a typically smooth change of the support [the blue interval (shaded gray in print) at a given time instant in Fig. 5(a)] of the natural measure, the density on this support changes dramatically all the time, and this underlies the irregular time dependence of Aμ (y(t)) (see also [30]). Figure 5(b), showing intersections of the snapshot attractor with the (x,y) plane in different time instants, indicates that the snapshot attractor has, at any time, a clear filamentary structure. This structure is seen to have a time dependence during the changing climate period (t > 0) only.
0 -75 -50 -25
0
25 50 t [years]
75 100 125 150
APPENDIX B: STATISTICS BEYOND THE AVERAGE
The nonergodic mismatch δτ (for any variable ϕ) can be defined not only for averages in (7), but also for other statistical quantities of interest. For example, the nonergodic mismatch δτ(n) for the nth cumulant Cμ(n) of the variable ϕ is defined as
(b) 3
δτ(n) (t) = Cτ(n) (ϕ(t)) − Cμ(n) (ϕ(t)),
y
2 1 0
Year -50
Year -1
Year 75
Year 125
3
y
2 1 0
0
1
2 x
3
0
1
2
3
x
FIG. 5. (a) Histogram over y (coded by the brightness), and the ensemble average Aμ (y) [red (gray in print) “continuous” line] as a function of time, taken at t mod T = T /4 time instants, calculated over a numerical ensemble of 106 trajectories. The bin size of the histogram is 0.025. (b) Intersections of the snapshot attractor with the (x,y) (i.e., the z = 0) plane conditioned by z˙ > 0 in the particular years indicated in the particular plots. These years are marked in panel (a) by black circles.
at time t.13 We wish to eliminate effects that arise from the annual component of the driving, so that we take only one time instant from every time period T (a given “day” of the year). In particular, we select the midwinter days, i.e., the time instants that satisfy t mod T = T /4 where the sine in (2) has a maximum. This way we obtain a stroboscopic map. � Aμ (ϕ(t)) = N1 N i=1 ϕi (t) is generally true for N � 1, because the particular trajectories sample the phase space according to the natural measure (after tc , of course). 13
(B1)
where Cτ(n) is the estimator of the nth cumulant evaluated on the time window of length τ .14 [Note that δτ (t) = δτ(1) (t).] The advantage of using δτ(n) , n > 1, is that Aμ (δτ(n) ) is never zero in a nonergodic case, not even in the very unlikely situation when the time evolution of the ensemble average Aμ (ϕ(t)) is exactly a linear function, and therefore Aμ (δτ(1) ) = 0, at least with the midpoint convention. For illustrative purposes we plot in Fig. 6 the τ dependence of the three most important characteristics of the nonergodic mismatch δτ(2) based on the variable ϕ = x (the speed of the Westerlies). Two neighboring time instants t are chosen, both corresponding to a changing climate. The graphs of the τ dependence in Fig. 6(a) are similar to those of Fig. 4(b); this picture can thus be considered generic. In Fig. 6(b), however, the bias Aμ (δτ(2) ) remains significantly smaller than the spread σμ (δτ(2) ) for any considered value of τ . This leads to completely different ergodicity deficit functions Aμ (|δτ(2) |) in the two plots. As these two plots are separated by a single year, this experience implies that certain aspects of the particular behavior of the most important characteristics of a nonergodic mismatch δτ(n) can depend strongly on the time instant t of observation. Note, however, that the shape of the bias functions Aμ (δτ(2) ) is practically the same in the two plots, just shifted by a constant. This is not surprising, because the single-realization temporal (SRT) statistics contain almost the same information in the two cases, due to the small separation in t. This implies that the ensemble statistics, Cμ(2) (x(t)), has to be very different
14 In order to see that Aμ (δτ(n) (t)) = 0 in ergodic cases we require the use of the unbiased estimators of the population statistics from sample data. For example, the second cumulant Cμ(2) (ϕ(t)) taken with respect to the natural measure μ is estimated correctly from the numerical �N �N 2 1 1 ensemble as Cμ(2) (ϕ(t)) = N−1 i=1 (ϕi (t) − N j =1 ϕj (t)) where ϕi (t) corresponds to the ith member of the ensemble at time t. The estimation is similar for the second cumulant Cτ(2) (ϕ) taken along a single realization.
022214-8
QUANTIFYING NONERGODICITY IN NONAUTONOMOUS . . .
0.4
PHYSICAL REVIEW E 94, 022214 (2016)
(a) Year 75 (2)
Aμ(δτ
0.4
σμ(δτ
)
Aμ(|δτ
|)
(2)
(2) Aμ(δτ )
)
(2)
0.3
(b) Year 76 σμ(δτ(2))
0.3
(2)
Aμ(|δτ (2)
0.2
δτ
δτ(2)
0.2
|)
0.1
0.1
0
0 0
25
50
75 τ [years]
100
125
150
0
25
50
75 τ [years]
100
125
150
FIG. 6. The bias Aμ (δτ(2) ), the spread σμ (δτ(2) ) and the ergodicity deficit Aμ (|δτ(2) |) from the nonergodic mismatch δτ(2) of the second cumulant based on the variable x of the model (1)–(3), as functions of the window length τ . The time instants t of observation are indicated in the panels and are taken from a changing climate. Note that Aμ (δτ(2) ) is not identically zero either in year 76, which indicates nonergodicity for this year, too. The numerical ensemble, consisting of 106 trajectories, is the one described in Appendix A.
in these two neighboring time instants. This is in harmony with the complicated time evolution of the natural measure, as seen in Fig. 5(a). In particular, Fig. 8(b) of the next section shows a jump between years 75 and 76 in the quantity Cμ(2) (x(t)). APPENDIX C: TIME DEPENDENCE OF AVERAGES AND VARIANCES
So far we have investigated only few different time instants t of observation. From Figs. 5(a) and 6, however, one may expect the time evolution of the pdf P (δτ(n) ) of a nonergodic mismatch δτ(n) [as introduced by (B1)] to be rich. In Fig. 7 we plot histograms of δτ(n) , n = 1,2, such that the time window τ is fixed but different time instants t of observation are chosen from both the stationary and the changing climate of our Lorenz 84 scenario. In the two panels we take δτ for the variable y and δτ(2) for the variable x. The first two histograms in each panel [red and green (see the legend in print)], belonging to the stationary case, practically coincide and are symmetric with respect to zero. The next three are, however, completely different. The maxima (mean values) do not change here monotonically in time: in Fig. 7(a), for (a)
15 More precisely, a nonzero value is present after −τ/2, even before the beginning of the climate change in t = 0, because the SRT statistics are ordered to the window centers. The use of lagging windows (when the SRT statistics are ordered to the endpoints of
10
Year -75 Year -37 Year 39 Year 76 Year 114
8 P(δ(2) τ )
P(δτ)
4
example, the histogram is centered on a negative value right after the climate change, then it becomes shifted to a large positive one, and ends at a moderate positive value. Smaller but significant changes can be seen in Fig. 7(b). The pdf P (δτ(n) ) of a nonergodic mismatch δτ(n) is thus dramatically changing in time in the model (1)–(3). Figure 8 explores the time evolution of P (δτ (t)) for the variable y and of P (δτ(2) (t)) for the variable x via their ensemble average Aμ and standard deviation σμ . For a better understanding, the two terms composing Aμ (δτ (t)) [or Aμ (δτ(2) (t)) in panel (b)], i.e., the ensemble averages Aμ (y(t)) and Aμ (Aτ (y(t))) [or Cμ(2) (x(t)) and Aμ (Cτ(2) (x(t))) in panel (b)], are also shown in a separate plot. The examples plotted in panels (a) and (b) are seen to be qualitatively very similar. A nonzero bias Aμ (δτ(n) (t)), n = 1,2, only appears in Fig. 8 in the climate change period,15 indicating nonergodicity. In
2
6
(b) Year -75 Year -37 Year 39 Year 76 Year 114
4 2
0
-0.4 τ = 72 years
-0.2
0 δτ
0.2
0
0.4
-0.2 τ = 72 years
0 δ(2) τ
0.2
FIG. 7. The time dependence of the histograms (a) P (δτ (t)) of the variable y and (b) P (δτ(2) (t)) of the variable x, with a fixed window length of τ = 72 years, calculated over the numerical ensemble of N = 106 trajectories. In any single panel we compare different time instants t of observation. The bin size is 0.025. Note that the lines for the two first time instants almost overlap. 022214-9
´ ´ ´ DROTOS, BODAI, AND TEL
PHYSICAL REVIEW E 94, 022214 (2016)
(a) 0.5
0.1
(2)
0.25 0
δτ
δτ
(b)
Aμ(δτ) σμ(δτ) Aμ(|δτ|)
0 (2)
-0.25
Aμ(δτ )
-0.1
(2)
σμ(δτ )
-0.5 1
(2)
Aμ(|δτ |) (2)
Aμ(y) Aμ(Aτ(y))
Cμ (x)
0.6
(2)
Aμ(Cτ (x))
C(2)(x)
A(y)
0.75 0.5 0.25 0 -0.25
0.5 0.4 0.3
-75
-50
-25
τ = 72 years
0
25 50 t [years]
75
100 125 150
-75
-50
-25
τ = 72 years
0
25 50 t [years]
75
100 125 150
FIG. 8. The time dependence of a few characteristic statistical measures of the natural measure as indicated in the legend (derived from the numerical ensemble of 106 trajectories). The blue line (the darkest gray in print) of the upper plot [Aμ (δτ (t)) and Aμ (δτ(2) (t)) in panels (a) and (b), respectively] is the difference of the magenta (gray in print) and the black lines (the two lines of the lower plot) in view of (B1). Panel (a) concerns the average in the variable y, and panel (b) concerns the second cumulant in the variable x. The window length is τ = 72 yr. The time instants considered in Fig. 7 are marked by vertical gray dot-dashed lines. Observe that σμ (δτ(n) (t)) and Aμ (|δτ(n) (t)|), n = 1,2, lie very close to each other for t < 0.
this period, accordingly, the component Aμ (Aτ (y(t))) [or Aμ (Cτ(2) (x(t))) in panel (b)], arising from SRT statistics, can be seen to deviate from the instantaneous ensemble average Aμ (y(t)) [or the second cumulant Cμ(2) (x(t)) in panel (b)]. The corresponding SRT component is much smoother than the ensemble average (or second cumulant16 ). The strong fluctuations observable in the bias Aμ (δτ (t)) [or Aμ (δτ(2) (t)) in panel (b)] thus originate in the ensemble average Aμ (y(t)) [or the second cumulant Cμ(2) (x(t)) in panel (b)]. The presence of fluctuations in the latter is a characteristic of the temporal evolution of the snapshot attractor and of its natural measure in our particular model. Due to the fluctuations in the bias Aμ (δτ(n) (t)), n = 1,2, as a function of t, the bias repeatedly crosses the value of zero, with a fixed τ . These crossings compose, however, a set of measure zero on the time axis t, and the set would change for other choices of τ . Therefore, the bias Aμ (δτ(n) (t)), n = 1,2, indicates faithfully the nonergodic property either if one takes finite intervals for the time of observation t or if one investigates multiple choices for the window length τ .
the windows) would restrict the nonzero vales to the climate change period strictly. 16 From Fig. 8 one might guess that Aμ (Cτ(2) (x(t))) is a moving average of Cμ(2) (x(t)). We numerically verified, however, that Aμ (Cτ(2) (ϕ(t))) − Aτ (Cμ(2) (ϕ(t))) �= 0.
(C1)
As for the spread σμ (δτ(n) (t)), n = 1,2, it is surprisingly close in Fig. 8 to a constant during both the stationary and the changing climate period. This means that the spread of the individual realizations has, when the underlying probability measure changes in time, approximately the same importance in SRT statistics as when it does not change. This is in harmony with the observation that the nonergodic mismatch pdfs in Fig. 7, with a fixed window length, move in time but do not change their shape or width. This is likely a consequence of the pdfs being determined only by the laws of large numbers (cf. Sec. III B). The ergodicity deficit Aμ (|δτ(n) (t)|), n = 1,2, is found in Fig. 8 to lie away from zero during its full time evolution, i.e., the error of the single-realization temporal statistics is always considerable. This means again that a single realization cannot be used for extracting relevant information about the instantaneous ensemble properties. One sees, furthermore, that the ergodicity deficit Aμ (|δτ(n) (t)|) is very close, during the full time evolution, to the larger of the values of σμ (δτ(n) (t)) and |Aμ (δτ(n) (t))|. This is in harmony with the behavior of Aμ (|δτ(1) (t)|) in Fig. 4 corresponding to particular time instants but showing different possible values for τ . APPENDIX D: RESULTS IN ADDITIONAL EXAMPLE SYSTEMS
In order to illustrate that our results are generic, we carry out the main investigations with two additional driving functions in the Lorenz 84 model, and also with two similar driving
022214-10
QUANTIFYING NONERGODICITY IN NONAUTONOMOUS . . .
0.6
PHYSICAL REVIEW E 94, 022214 (2016)
(a) Year 74 |Aμ(δτ)| σμ(δτ) Aμ(|δτ|)
0.8
δτ
0.4
(d) Aμ(δτ) σμ(δτ) Aμ(|δτ|)
0.6
0.2 0
0.6
0
25
50
75 τ [years]
100
125
150
δτ
0.4 0.2 0
(b) Year 160
-0.2
|Aμ(δτ)| σμ(δτ) Aμ(|δτ|)
-0.4 Aμ(y) Aμ(Aτ(y))
δτ
0.4
0.8
0.2
0.6
0.6 0
25
50
75 τ [years]
100
125
150
A(y)
0
(c) Year 190
0.2
|Aμ(δτ)| σμ(δτ) Aμ(|δτ|)
0
δτ
0.4
0.4
9
0
F0
0.2
8 7
0
25
50
75 τ [years]
100
125
150
0
50
τ = 72 years
100
150 t [years]
200
250
FIG. 9. Results concerning the nonergodic mismatch δτ based on the variable y in the Lorenz 84 model driven by a double ramp, calculated for a numerical ensemble of 5 × 10⁵ trajectories. (a)–(c) The ergodicity deficit Aμ (|δτ |), compared to the magnitude |Aμ (δτ )| of the bias and to the spread σμ (δτ ), as a function of the window length τ . The time instants t of observation are indicated in the panels. (d) The time dependence of a few characteristic statistical measures as indicated in the legend. The window length is τ = 72 yr. The driving function F0 (t) is indicated in the bottom plot, in orange (gray in print). The time instants considered in panels (a)–(c) are marked by vertical gray dot-dashed lines.
functions in a completely different dynamical system, the wellstudied H´enon map. As our first new driving function [see the orange line (gray in print) in the lowest part of Fig. 9(d)—we call it a double ramp in what follows] in the Lorenz 84 model, we start with a stationary climate with a different value of F0 compared to the original setup, include a first ramp with a different slope, and, after a plateau, include a symmetric ramp back to reach another plateau with the starting value of F0 . By this choice we test the sensitivity to the details of the driving function when its main characters are kept. Corresponding numerical results are shown in Fig. 9 and are very similar to those of Figs. 4(b), 6 and 8, i.e., to those of the original setting. Next we take a driving function of very different nature: an ever-changing, quasiperiodic signal [see the orange line (gray
in print) in the lowest part of Fig. 10(d)]: �ω � �ω � t + 0.5 cos t . F0 (t) = 8.5 + 0.5 cos 10 5π
(D1)
The frequencies are chosen such that they are much smaller than the seasonal frequency ω = 2π/T [see Sec. II, and Eq. (2) in particular]. By obtaining, as exhibited in Fig. 10, the same qualitative behavior as with the original driving function we confirm that our results and conclusions are not sensitive to the particular form of the nonperiodic driving. So far we considered the Lorenz 84 model which is defined in continuous time, and our version contained also a periodic, relatively fast component (the seasonal component) in the driving, the effect of which was then filtered out (cf. Sec. II). The idea of testing our conclusions in a different dynamical system naturally arises. For this purpose, we take a map in
022214-11
´ ´ ´ DROTOS, BODAI, AND TEL
0.6
PHYSICAL REVIEW E 94, 022214 (2016)
(a) Year 74 |Aμ(δτ)| σμ(δτ) Aμ(|δτ|)
δτ
0.4
0.8 0.2
0.6
Aμ(δτ) σμ(δτ) Aμ(|δτ|)
0.6 0.4 0
25
50
75 τ [years]
100
125
150
δτ
0
(d)
0.2 0
(b) Year 160
-0.2
|Aμ(δτ)| σμ(δτ) Aμ(|δτ|)
-0.4
δτ
0.4 0.2
0.6
0.8 0.6 0
25
50
75 τ [years]
100
125
150
A(y)
0
Aμ(y) Aμ(Aτ(y))
(c) Year 190
0.2
|Aμ(δτ)| σμ(δτ) Aμ(|δτ|)
0
δτ
0.4
0.4
9.5
0
F0
0.2
8.5 7.5
0
25
50
75 τ [years]
100
125
150
0
50
τ = 72 years
100
150 t [years]
200
250
FIG. 10. Same as Fig. 9 for the Lorenz 84 model driven by the quasiperiodic signal (D1), calculated for a numerical ensemble of 5 × 10⁵ trajectories.
which there is no need to filter out some component of the dependence on “time.” In particular, we choose the H´enon map, because its properties are well understood [6]. We consider the form xt+1 = 1 − αt xt2 + yt ,
(D2)
yt+1 = 0.32xt ,
(D3)
where t represents discrete time, and the coefficient 0.32 is chosen to provide a regime in α, α ∈ [1.15,1.35], where only tiny periodic windows exist in the autonomous system with αt = const. This property is needed because the existence of a unique natural measure in the nonautonomous system is guaranteed only if the dynamics is irregular [15], and this kind of dynamics arises if chaos dominates the autonomous system in the corresponding parameter regime. We vary the parameter αt within the mentioned regime according to two functions similar to those applied in the Lorenz 84 model. The double ramp is given as the orange
line [the line in the bottom plot (gray in print)] in Fig. 11(d), while the quasiperiodic signal reads as
1 2π t + 0.05 cos t , (D4) αt = 1.25 + 0.05 cos 100 25 which is also illustrated, in the bottom plot of Fig. 12(d) (in orange [gray in print]). The corresponding numerical results in Figs. 11 and 12 demonstrate clearly that the main conclusions for the bias and for the ergodicity deficit (as detailed in the main text) hold also in this system. This is so in spite of the fact that the particular functional forms of these quantities (as functions of the window length τ and time t) in Figs. 11 and 12 considerably differ from those in Figs. 9 and 10. APPENDIX E: ANALYZING AN ALTERNATIVE CONCEPT OF ERGODICITY
Ergodicity is generally defined via temporal statistics along a single realization. In the literature, however, an alternative
022214-12
QUANTIFYING NONERGODICITY IN NONAUTONOMOUS . . .
δτ
0.04
PHYSICAL REVIEW E 94, 022214 (2016)
(a) t = 740 |Aμ(δτ)| σμ(δτ) Aμ(|δτ|)
0.06
0.02
(d) Aμ(δτ) σμ(δτ) Aμ(|δτ|)
0.04
τ
500
750
0
(b) t = 1600 |Aμ(δτ)| σμ(δτ) Aμ(|δτ|)
-0.02
0.02
0
0.04
Aμ(y) Aμ(Aτ(y))
0.14
0.12 0
250
τ
500
750
0.1
(c) t = 1900 |Aμ(δτ)| σμ(δτ) Aμ(|δτ|)
0.08
0.02
1.35 α
δτ
250
A(y)
δτ
0.04
0.02 0
δτ
0
1.25 1.15
0
0
250
τ
500
0
750
τ = 730
500
1000
1500 t
2000
2500
FIG. 11. Same as Fig. 9 for the H´enon map (D2)–(D3) driven by a double ramp, calculated for a numerical ensemble of 5 × 10⁵ trajectories.
definition showed up recently [15], relying on an unusual way of taking temporal averages and with an ensemble of trajectories. The members of this ensemble are initiated at different time instants. This definition corresponds in effect to an average taken over the endpoints of these members, although the averaging is formally expressed by an integral over time. More precisely, let a value of the observable ϕ at time t be denoted by ϕ(t; t0 ,x0 ) that emerges from an (arbitrarily chosen) initial position x0 of the phase space at time t0 . An artificial time average over a window of length τ (ordered to the final instant t) can be evaluated [15] by considering different trajectories of temporal length t − t � which start from the same initial position x0 at time t � � t and yield the value ϕ(t; t � ,x0 ) at the final instant t, then integrating these values over the time instants t � as � 1 t ϕ(t; t � ,x0 )dt � . (E1) τ t−τ We call this average artificial because the integration is taken over the initial time instants t � , and this is impossible to carry
out in any single time series. In fact, this integration defines an averaging over the endpoints of trajectories initiated in different time instants. This is why this average is essentially also an ensemble average in itself. Reference [15] claims that it is usual among nonautonomous dynamical systems that for almost every initial position x0 in the phase space the following ergodic property is satisfied: � 1 t ϕ(t; t � ,x0 )dt � = Aμ (ϕ(t)), (E2) lim τ →∞ τ t−τ for any sufficiently smooth observable ϕ. Relation (E2) was originally formulated for a random dynamical system in Ref. [15]; we apply it here to a deterministic nonautonomous case. Qualitatively speaking, the left hand side of (E2) is an average of points on the snapshot attractor belonging to time instant t since trajectories rapidly forget their initial conditions (after time tc ), due to dissipation. The endpoints of only those trajectories are not on the attractor that started at t � > t − tc , but they form a negligible proportion of all the trajectories taken (with the exception of small values of the window
022214-13
´ ´ ´ DROTOS, BODAI, AND TEL
δτ
0.04
PHYSICAL REVIEW E 94, 022214 (2016)
(a) t = 740 |Aμ(δτ)| σμ(δτ) Aμ(|δτ|) 0.06
0.02
(d) Aμ(δτ) σμ(δτ) Aμ(|δτ|)
0.04
250
τ
500
750
0.02 0
(b) t = 1600 |Aμ(δτ)| σμ(δτ) Aμ(|δτ|)
-0.02
0.02
0
0.04
Aμ(y) Aμ(Aτ(y))
0.14
0.12 0
250
τ
500
750
A(y)
δτ
0.04
0
δτ
0
(c) t = 1900
0.1
0.02
0
1.35
|Aμ(δτ)| σμ(δτ) Aμ(|δτ|) 0
250
τ
500
α
δτ
0.08
1.25 1.15
750
0 τ = 730
500
1000
1500 t
2000
2500
FIG. 12. Same as Fig. 9 for the H´enon map (D2)–(D3) driven by the quasiperiodic signal (D4), calculated for a numerical ensemble of 5 × 10⁵ trajectories.
length τ ). One thus expects that for window lengths τ � tc , the endpoints populate the snapshot attractor representing faithfully its natural measure, and the two sides of (E2) are then practically equivalent. It is intuitively appealing that such a relation, generalizing Birkhoff’s ergodic theorem for general nonautonomous systems, may exist, but one must not forget that the time average on the left hand side is not the natural time average over a time series. For any particular initial value x0 we define the nonergodic mismatch dτ with this artificial time average on a window length τ as17 � 1 t dτ (t) = ϕ(t; t � ,x0 )dt � − Aμ (ϕ(t)). (E4) τ t−τ
17 The nonergodic mismatch δτ based on a lagging window, like here, would read, instead of (7), as
δτ (t) =
1 τ
�
t
t−τ
ϕ(t � )dt � − Aμ (ϕ(t)).
(E3)
Similarly to δτ (t), dτ (t) has a probability distribution, numerically obtainable from different initial positions x0 . The observable ϕ may be a dynamical variable, we choose ϕ = y in the Lorenz model. We plot the numerically obtained pdf P (dτ (t)) of the nonergodic mismatch dτ (t) [calculated with a yearly sum instead of an integral in (E4)] for the variable y in Fig. 13 for the same three window lengths τ and two time instants t (one in the stationary and one in the changing climate) as in Fig. 1. In both kinds of climate, the distributions appear to be symmetric with respect to zero, and their width shrinks with increasing τ . This indicates that a changing climate is similar to a stationary one from the point of view of the ergodicity concept in (E2). For a more detailed investigation, we plot in Fig. 14 the τ dependence of the bias Aμ (dτ ), of the spread σμ (dτ ), and of the ergodicity deficit Aμ (|dτ |) for the same two time instants t as in Fig. 13. As mentioned, the endpoints of trajectories initiated at time instants t � > t − tc are not yet on the snapshot attractor. As long as such trajectories dominate the “integral” in (E4), the bias Aμ (dτ ) differs from zero
022214-14
QUANTIFYING NONERGODICITY IN NONAUTONOMOUS . . .
PHYSICAL REVIEW E 94, 022214 (2016)
(a) Year -75
6
6
τ = 4yr τ = 72yr τ = 148yr
τ = 4yr τ = 72yr τ = 148yr
P(dτ)
4
P(dτ)
4
(b) Year 76
2
2
0
-0.6
-0.4
-0.2
0 dτ
0.2
0.4
0
0.6
-0.6
-0.4
-0.2
0 dτ
0.2
0.4
0.6
FIG. 13. The pdf P (dτ (t)) of the nonergodic mismatch dτ (t) (E4) based on the variable ϕ = y of (1)–(3), calculated over a numerical ensemble of N = 10 000 trajectories. In each panel we compare three different values of the window length τ . The time instants t of observation are as in Fig. 1. The bin size is 0.025.
considerably, which is a feature that is not common with Aμ (δτ ). This is seen up to τ < tc ≈ 5 yr in Fig. 14. For larger τ , however, the bias Aμ (dτ ) takes on the value of zero. The spread σμ (dτ ), of course, converges to zero as well [we find that it follows the same power law as σμ (δτ ) in Fig. 3]. As a consequence, the ergodicity deficit Aμ (|dτ |) also converges to zero with increasing τ , which means that the difference
0.5
(a) Year -75
0.5
Aμ(dτ) σμ(dτ)
0.4
(b) Year 76 Aμ(dτ) σμ(dτ)
0.4
Aμ(|dτ|)
Aμ(|dτ|)
0.3
dτ
dτ
0.3
between “temporal” and ensemble averages disappears. We conclude that the alternative ergodicity concept of Ref. [15] is trivially fulfilled in our deterministic system, and presumably also in any typical nonautonomous system. In a sense, this alternative view artificially eliminates the striking difference between ergodic and nonergodic cases, expressed, e.g., by Fig. 2 or Fig. 4.
0.2
0.2
0.1
0.1
0
0 0
25
50
75
100 125 τ [years]
150
175
200
225
0
25
50
75
100 125 τ [years]
150
175
200
225
FIG. 14. The bias Aμ (dτ ), the spread σμ (dτ ), and the nonergodic mismatch Aμ (|dτ |) as “continuous” functions of the window length τ , calculated for a numerical ensemble of 10 000 trajectories, where the nonergodic mismatch dτ is based on the variable y, as in Fig. 13. The time instants t of observation are indicated in the panels.
[1] L. E. Reichl, A Modern Course in Statistical Physics, 2nd ed. (Wiley, New York, 1998). [2] J.-P. Eckmann and D. Ruelle, Rev. Mod. Phys. 57, 617 (1985). [3] L.-S. Young, J. Stat. Phys. 108, 733 (2002). [4] S. E. Scott, T. C. Redd, L. Kuznetsov, I. Mezi´c, and C. K. Jones, Physica D 238, 1668 (2009).
[5] S. E. Scott, in Applied and Numerical Harmonic Analysis, Excursions in Harmonic Analysis Vol. 3, edited by R. Balan, M. J. Begu´e, J. J. Benedetto, W. Czaja, and K. A. Okoudjou (Springer International Publishing, New York, 2015), pp. 143–154. [6] E. Ott, Chaos in Dynamical Systems (Cambridge University Press, Cambridge, UK, 1993).
022214-15
´ ´ ´ DROTOS, BODAI, AND TEL
PHYSICAL REVIEW E 94, 022214 (2016)
[7] G. Haller, Annu. Rev. Fluid Mech. 47, 137 (2015). [8] I. Dobson, H. Glavits, C.-C. Liu, Y. Tamura, and K. Vu, IEEE Circuits Devices Mag. 8, 40 (1992). [9] T. Nishikawa and E. Ott, Chaos 24, 033107 (2014). [10] M. Ghil and R. Vautard, Nature (London) 350, 324 (1991). [11] Climate Change 2013: The Physical Science Basis. Contribution of Working Group I to the Fifth Assessment Report of the Intergovernmental Panel on Climate Change, edited by T. F. Stocker, D. Qin, G.-K. Plattner, M. Tignor, S.K. Allen, J. Boschung, A. Nauels, Y. Xia, V. Bex, and P. M. Midgley (Cambridge University Press, Cambridge, UK and New York, NY, 2013). [12] F. J. Romeiras, C. Grebogi, and E. Ott, Phys. Rev. A 41, 784 (1990). [13] L. Arnold, Random Dynamical Systems (Springer-Verlag, Berlin, 1998). [14] M. Ghil, M. D. Chekroun, and E. Simonnet, Physica D 237, 2111 (2008). [15] M. D. Chekroun, E. Simonnet, and M. Ghil, Physica D 240, 1685 (2011). [16] P. Kloeden and M. Rasmussen, Nonautonomous Dynamical Systems. Mathematical Surveys and Monographs, 176 (American Mathematical Society, Providence, 2011), p. 264. [17] A. N. Carvalho, J. A. Langa, and J. C. Robinson, Attractors for Infinite-Dimensional Nonautonomous Dynamical Systems. Applied Mathematical Sciences, 182 (Springer, New York, 2013). [18] L. Yu, E. Ott, and Q. Chen, Phys. Rev. Lett. 65, 2935 (1990). [19] L. Yu, E. Ott, and Q. Chen, Physica D 53, 102 (1991). [20] J. C. Sommerer and E. Ott, Science 259, 335 (1993). [21] J. Jacobs, E. Ott, T. Antonsen, and J. Yorke, Physica D 110, 1 (1997). [22] Z. Neufeld and T. T´el, Phys. Rev. E 57, 2832 (1998). [23] J. L. Hansen and T. Bohr, Physica D 118, 40 (1998). [24] G. K´arolyi, T. T´el, A. P. S. de Moura, and C. Grebogi, Phys. Rev. Lett. 92, 174101 (2004). [25] T. B´odai, G. K´arolyi, and T. T´el, Phys. Rev. E 83, 046201 (2011). [26] A. Pikovsky, in Nonlinear and Turbulent Processes in Physics, edited by R. Z. Sagdeev (Harwood Academic, Reading, UK, 1984), Vol. 3. [27] A. Pikovsky, Izv. VUZ. Radioelektronika 27, 576 (1984).
[28] J. D. Daron and D. A. Stainforth, Environ. Res. Lett. 8, 034021 (2013). [29] J. D. Daron and D. A. Stainforth, Chaos 25, 043103 (2015). [30] G. Dr´otos, T. B´odai, and T. T´el, J. Clim. 28, 3275 (2015). [31] E. N. Lorenz, Tellus A 36A, 98 (1984). [32] E. N. Lorenz, J. Atmos. Sci. 20, 130 (1963). [33] C. Masoller and A. C. S. Schifino, Phys. Lett. A167, 185 (1992). [34] R. A. Pielke and X. Zeng, J. Atmos. Sci. 51, 155 (1994). [35] C. Masoller, A. C. S. Schifino, and L. Romanelli, Chaos, Solitons Fractals 6, 357 (1995). [36] C. Nicolis, S. Vannitsem, and J.-F. Royer, Quart. J. R. Meteorol. Soc. 121, 705 (1995). [37] P. J. Roebber, Tellus A 47, 473 (1995). [38] A. Shil’nikov, G. Nicolis, and C. Nicolis, Int. J. Bifurcation Chaos 05, 1701 (1995). [39] A. Provenzale and N. J. Balmforth, “Chaos and structures in geophysics and astrophysics (Woods Hole lecture notes)”, 1999, available online at http://www.whoi.edu /fileserver.do?id=21476&pt=10&p=17353]. [40] A. Leonardo, Numerical Studies on the Lorenz-84 Atmosphere Model, master thesis, State University of Utrecht, 2005. [41] T. T´el and M. Gruiz, Chaotic Dynamics (Cambridge University Press, Cambridge, UK, 2006). [42] J. G. Freire, C. Bonatto, C. C. DaCamara, and J. A. C. Gallas, Chaos 18, 033121 (2008). [43] T. B´odai, G. K´arolyi, and T. T´el, Nonlin. Processes in Geophys. 18, 573 (2011). [44] T. B´odai, G. K´arolyi, and T. T´el, Phys. Rev. E 87, 022822 (2013). [45] E. N. Lorenz, Tellus A 42, 378 (1990). [46] W. Feller, An Introduction to Probability Theory and its Applications, Wiley Series in Probability and Mathematical Statistics (Wiley, New York, 1966), Vol. 2. [47] P. N´andori, D. Sz´asz, and T. Varj´u, J. Stat. Phys. 146, 1213 (2012). [48] S. Pierini, J. Phys. Oceanogr. 44, 3245 (2014). [49] S. Pierini, M. Ghil, and M. D. Chekroun, J. Climate 29, 4185 (2016). [50] M. Herein, J. M´arfy, G. Dr´otos, and T. T´el, J. Climate 29, 259 (2016). [51] W. L. Ku, M. Girvan, and E. Ott, Chaos 25, 123122 (2015).
022214-16