Environmental Sciences Division, Oak Ridge National Laboratory, Oak Ridge, TN 37831, USA. Keywords: scale ... set of experiments is used to examine the problem associated with iden- ...... Ridge Associated Universities. Publication No.
Landscape Ecology vol. 3 nos. 3/4’pp 217-227 (1989) SPB Academic Publishing bv, The Hague
Quantifying scale-dependent effects of animal movement with simple percolation models* R.H. Gardner, R.V. O’Neill, M.G. Turner and V.H. Dale Environmental Sciences Division, Oak Ridge National Laboratory, Oak Ridge, TN 37831, USA Keywords: scale, landscape, critical threshold, extrapolate
Abstract A simple model of animal movement on random and patterned landscapes was used to explore the problems of extrapolating information across a range of spatial scales. Simulation results indicate that simple relationships between pattern and process will produce a variety of scale-dependent effects. These theoretical studies can be used to design experiments for determining the nature of scale-dependent processes and to estimate parameters for extrapolating information across scales.
Introduction Ecological systems are directly affected by the spatial heterogeneity of many physical and biological processes. Models which simulate the relationships between pattern and process and thus incorporate the effects of spatial heterogeneity are useful for developing and testing quantitative rules for .predicting across scales. Predictions from such models can also assist in the development of parsimonious sampling schemes to quantify prediction errors. This paper presents a simple model that relates landscape pattern to the movement of animals, uses this model to explore the effect of changing spatial scale on movement patterns, and estimates the problems of extrapolating this information across spatial scales. The next section discusses the methods of generating random and patterned landscapes, the algorithms for simulating animal move-
ment, and the techniques used to analyze the simulation results. The results of a series of simulation experiments are then presented, and scale-dependent effects are examined. A final set of experiments is used to examine the problem associated with identifying critical thresholds in landscape pattern and estimating its effect on the extrapolation process. . Movement in random and patterned landscapes Percolation theory (Stauffer 1985) can be used to generate two-dimensional gridded patterns that are visually similar to maps of landscapes (Gardner et al. 1987). Two-dimensional percolation maps are formed by randomly assigning a particular habitat type (such as forest or grassland) to each grid site with a probability, p. The value of p is usually estimated empirically as the fraction of the landscape covered by the habitat. According to the rules of
*The submitted manuscript has been authored by a contractor of the U.S. Government under contract No. DE-ACOS-840LR21400. Accordingly, the U.S. Government retains a nonexclusive, royalty-free license to publish or reproduce the published form of this contribution, or allow others to do so, for U.S. Government purposes.
218 percolation theory, clusters form when adjacent sites (e.g., nearest neighbors) are of the same habitat type. Few clusters larger than three sites are formed when p is less than 0.3, with the average size of the clusters increasing as p increases. As p approaches 0.6, adjacent clusters coalesce to form a single large cluster that spans the map or ‘percolates’ from one side to the other. The threshold value, pc, at which a percolating cluster will be formed has been empirically determined for very large maps (> lo6 sites) as p = 0.5928 (Stauffer 1985). The patterns generated from random maps and the changes in pattern as the size of the map and the value of p vary have been described (Gardner et al. 1987). Percolation methods have also been used to investigate the relationships between landscape pattern and the spread of disturbances (Turner et al. in press). The disturbance simulations have shown that effects depend on the value of p for the susceptible habitat: whenp is less thanp,, habitat clusters are fragmented, disturbance does not readily spread across the landscape, and the frequency of disturbance is the primary determinant of landscape effects; when p is greater than p,,, the habitat clusters are more continuous, the disturbance readily spreads across the landscape, and the intensity of disturbance becomes the important factor in determining landscape effects. These results indicate that relationships between pattern and process will affect the extrapolation of information across spatial and temporal scales. A simple m’odel of random movement (SRM) A Simple Random Movement (SRM) model of animals across random or patterned landscapes was developed to investigate the scale-dependent effects of pattern and process. For each set of simulations, the extent, m, of the landscape was specified as the number of rows or columns of a square grid (i.e., a map of extent m parameters has exactly m2 sites). Each site on the map was defined as either suitable or unsuitable habitat for the animal being simulated. At each time step the simulated animal was allowed to move to the nearest neighbor sites within the suitable habitat types but was not allowed to move across sites of unsuitable habitat. For patterned maps the locations of suitable habitat sites
were deterministically defined, while for random maps the fraction of suitable habitat, p, was specified and the location of sites randomly generated. Based upon percolation theory (Stauffer 1985), an animal can move across a map if p is greater than pc (p, = 0.5928 for very large maps). Because we are only interested in percolating systems, random maps with values ofp equal to 0.6,0.8, and 1 .O were simulated. Most simulations were begun by releasing animals at a randomly chosen point on the ‘north’ side of the map and allowing each animal to move at each time step to connecting sites (north, south, east, or west) with equal probability. The mean number of time steps, T,, of those individuals emerging from the southern end of the map and the percent, P,, of simulated animals that successfully emerged were calculated. Any animals that emerged to the north were considered to have been unsuccessful in traversing the landscape. Unless otherwise noted, the maps were ‘wrapped’ in the east-west axis so that an animal that emerged from the east side immediately stepped back onto the map on the west side. Because animals do no always move at random and sometimes tend to walk in a relatively straight line, we introduced a directional bias, B, into the simulation procedure. Bias is calculated as a normalized ratio of the probabilities of moving at each step in a northerly or southerly direction. (The probabilities of moving east or west remained fixed at 0.25 for all simulations.) When S > N, where N and S are the probabilities of moving in a northerly or southerly direction, then B = (1 .O - N/S). For example, when N = 0.25 and S = 0.25, then B = 0.0, and there is an equal probability of the animal moving in any direction. When N = 0.1 and S = 0.4, then B = 0.75, and there is a much higher probability of moving in a southerly direction. A subscripted bias term, B,, is used to indicate those experiments where the bias for movement is toward the north [i.e. N > S and, therefore, B, = (1.0 S/N)]. Figure 1 illustrates the general behavior of the SRM model for 100 simulated animals on 10 replicate maps of m = 8 (total of 64 sites per map) for various levels of B and p (a total of 1000 simulations per combination of B and p). The percent emerging to the south, P,, increases monotonically
219 the landscape and emerge to the south, T,, varies inversely withp and B. When B = 0.0, then T, = 97.5 at p of 0.6 but drops to 59.3 at p of 1 .O. The faster transit times are due to the shorter average path taken through the habitat. When the directional bias is high (B = 0.88), then T, = 78.4 at p of 0.6 and declines to 19.4 at p of 1.0. This latter value of T, is only twice as long as the minimum possible route across the map. Effects of changing landscape size on movement
0 0.6
0.0 1 .o FRACTION OF MAP WITH SUITABLE HABITAT (p)
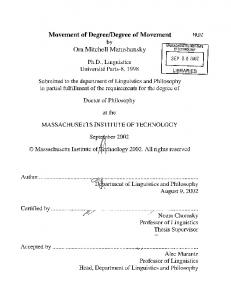
1. The percent of animals that emerge to the south (P,) as a function of the directional bias moving south (B) and the fraction of the map with suitable habitat (p). Ten replicate maps of size 8 x 8 and 100 animals were simulated (total of 1000 simulations) for each combination of p and B.
Fig.
as the available habitat, p, increases because, as p increases, the habitat becomes more continuous and the animal can take a more direct path to the south. Lower values of p tend to keep an animal moving about within the landscape, reducing the probability that the animal will successfully traverse from north to south. Thus, the slope of the relationship is shallow when the bias to move south, B, is zero because animals will frequently emerge on the north side after relatively few steps. Under these conditions the behavior of the animal is not linearly dependent on the extent of the landscape or on p, the proportion of available habitat. As bias increases, the majority of animals move in a more directed fashion, and many more emerge to the south (Fig. 1). The average time it takes for animals to traverse
The SRM model was used to explore the effects of changes in the size of the simulated landscape on the predicted pattern of movement. Ten replications of maps of different extent (m = 3 to m = 10) and values of p were simulated, and the movement of 100 animals per map was performed (total of 1000 movement patterns per map type). When the bias, B, to move south is low (B = 0.33), the percent of animals emerging south, P,, decreases as map size increases (Fig. 2). At low values of bias (lower three curves), the larger landscapes provide a longer possible path length. The animals remain within the landscape for a longer period of time, increasing the probability of exiting north. When the bias to move south is high (B = 0.88, the upper three curves in Fig. 2), animals continue to emerge to the south as the size of the landscape increases. For example, at p = 1.0, 90% of the animals emerge to the south, and this percentage is independent of landscape size. However, at p = 0.6, the heterogeneity of habitat patches forces the simulated animal to take a convoluted path to avoid unfavorable habitat, and, therefore, animals are more likely to emerge from the north side of the grid. Under these circumstances, there is a slight effect of landscape size (m) on the percent of animals that successfully traverse the landscape, P,. The mean time required to traverse the landscape, T,, increases with landscape size under all conditions (Fig. 3). Larger landscapes simply require more steps to get across. In addition, if the landscape has a greater heterogeneity of habitat shapes (p = 0.6), many sidetracks are required and the path lengths become quite long. At p = 1 .O and B = 0.88 (Fig. 3c), the animal walks in a directed
-
220
140 -
I
I
P = 0.6
P = 1.0
90 ,r
0
120
-
0 6 IO.0 A 6 - 0.88
100 -
80 -
F 2 60 Y z i+ Yw
,
g 40 % B 0. 30 -
- HIGH BIAS ---- LOW BIAS
100
I P - 0.8
I
I
5
6
80 60
3
4
5
6
7
6
9
-
10
EXTENT (m)
Fig. 2. The effect of landscape size (m) on the percent of animals that emerge to the south (P,) for values of p from 0.6 to 1 .O and for low and high levels of directional bias (B).
path across the landscape, and the mean transit time, T,, is linearly related to the size of the landscape. When there is no directional bias (B = O.O), there is a tendency for the animal to wander back north at each step, increasing the average path length. The effect of low bias is intensified when p is also low because the suitable habitat patches are more irregular in shape, causing the simulated animal to follow a convoluted path across the landscape. Therefore, the time to move across the landscape is shortened by increased habitat availability and increased bias (Fig. 4).
Extrapolating results across scales The need utilize information available from laboratory, greenhouse, or field experiments at the land-
3
4
EXTENT (m)
Fig.
3. The relationship between the mean time of transit (T,), map extent (m), and bias for values of p of (a) 0.6, (b) 0.8, and (c) 1.0.
scape level has resulted in a number of papers that attempt to understand how processes and data are transformed as temporal and spatial scales are changed (King et al. in press; O’Neill 1979; Turner et al. this issue). Four alternative responses to changes in scale can be defined: 1) The process
221
140
120
2 100 t Y ,$ !8
60 .oo
60
;
20
0
0.6
-
1
.
0.6 FRACTION OF MAP WITH SUITABLE HABITAT (p)
0
1.0
0
Fig. 4. A three-dimensional plot of mean transit time (T,), directional bias (B), and fraction of the map with suitable habitat (p).
under consideration is insensitive to or unaffected by changes in scale. The rate or measurement on the fine scale is then identical to the rate or measurement at broad scales, and no transformation is required. 2) The process remains similar across scales, and a simple transformation (e.g., a linear relationship) can be derived. 3) The dominant process remains similar, but additional processes and constraints add ‘noise’ to the prediction process. In this case, fine-scale information can explain much, but not all, of the variance of large-scale processes. 4) In the most difficult case, a change in scale causes a change in the importance of a process or process constraints, and extrapolation is risky or impossible. We will illustrate the quantitative effects of each of these alternatives with the SRM model. Scale-independent
processes
When a process is insensitive to scale, fine-scale information can be immediately applied at broader
scales. Consider, for example, the reflectance of a vegetated surface as seen in a satellite image. For a completely uniform, closed-canopy ecosystem, the reflectance at the plot scale (e.g., Landsat image at 30 x 30 m resolution) is the same as the reflectance at the landscape scale (e.g., AVHRR image at 1 x 1 km). Therefore, knowledge of the reflectance at the fine scale is immediately applicable to the broad scale. However, scale-independent relationships may not always be reciprocal. For example, when the surface is not uniform, many different combinations of vegetation and bare ground can lead to identical reflectance values at broad spatial scales. Therefore, knowing only the reflectance at the broad scale does not necessarily lead to knowledge about the reflectance on each smaller plot within the landscape. Scale-independent processes can be illustrated by simulating the movements of 5000 animals on landscapes that are 1 site wide and 3 sites long and comparing these results to landscapes that are 3 sites wide and 3 sites long. All sites on each landscape were occupied by suitable habitat (p = l.O), and the animal faced no barriers to movement. For each experiment, the fraction of animals emerging at the south (P,) and the mean time of transit (T,) were recorded. Landscapes were bounded east and west by unsuitable habitat (i.e., the maps were not wrapped in an east-west direction), allowing animals to emerge from only the north and south borders of the map. Animals that left the landscape to the north were considered to be unsuccessful in traversing the landscape. Sets of simulations were performed at different levels of northerly (B,) or southerly (B,) bias. Table 1 shows that the percent of the simulated animals that emerge to the south, P,, for the two landscape types are essentially identical, being unaffected by either the width of the landscape or the assumptions about the directional bias of animal movement. Thus, information provided by the observations taken for one landscape can be reliably extrapolated to the other. However, the mean time of transit, T,, increases with increasing landscape area because the wider landscape permits a more erratic path to be taken before the simulated animal
222 Table 1. Percentage of animals emerging from the south (P,) and mean time of transit (T,) for two sizes of landscape.*
Landscape Directional B
0.0 0.5 0.67 0.75
bias B” 0.75 0.67 0.5 0.0
1.0 2.0 7.0 25.0 53.0 68.0 76.0
3 x 3
TS
PS
Ts
4.1 4.0 4.3 4.8 4.6 4.2 3.9
1.0
7.2
2.0 6.0 25.0 53.0 68.0 75.0
7.5 7.7 8.4 7.6 7.1 6.6
* For each combination of landscape size and directional bias, 5000 individuals were simulated by placing the simulated animal at a random point on the north side of the map. The percent of animals (P,) that emerge from the south side and the mean number of time steps (T,) required to traverse the map were measured. The directional bias, B, indicates a tendency to move in a southerly direction, while B, indicates a tendency to move in a northerly direction.
finally emerges. Thus, under identical conditions one feature of the landscape (i.e, , P,) may be scale independent while another (i.e., Ts) may be scale dependent.
Scale-dependent,
similar
89M-1903
size
1x3 PS
ORNL-DWG
processes
Few scale problems occur when a process is similar in its effect across many scales. For instance, estimates of primary production on a landscape covered by uniform vegetation can be extrapolated to broad scales by simple multiplication. Another more specific example is provided by King et al. (1987) who assumed that a process (carbon dioxide exchange between tundra vegetation and the atmosphere) was similar across northern latitudes, with differences in CO, exchange due to differences in climatic driving variables. Models of finescale processes associated with ‘point’ estimates were then extrapolated by Monte Carlo integration across the known spatial variability in climate. Another scale transformation for processes that are similar across a range of scales is discussed in measurement theory (Mandelbrot 1983). The theory
7i3 t E 2'
'1
2
4
3
5
6
In (m2) Fig.
5. The natural logarithm of mean transit time (T,) plotted against the natural logarithm of map size (m is the number of rows and columns on the map and m2 is the total number of map sites).
states that when the process is self-similar, then no additional processes or constraints need to be accounted for as the scale of observation changes. The measured value of the process is then related to the scale of the measurement (e.g., the length of the ruler) raised to a fractal power, d. If the log of the measurement is graphed against the log of scale, such relationships show a straight line with a slope d. Examples of fractal scale transformation have been found in measurement sets (Burrough 1981, 1983; Lovejoy 1982; Lovejoy et al. 1987; Morse et al. 1985; Mandelbrot 1967) with several recent examples in landscape ecology (Milne 1988; Sugihara in press). To illustrate a fractal scale transformation, we used the SRM model to simulate the movement of animals across landscapes that ranged in size from 3 x 3 to 10 x 10. For each landscape, 5000 simulated animals were released into the north end of the landscape, and the mean transit time (T,) for animals that emerged to the south was recorded. The landscapes contained no unsuitable habitat (p = l.O), and the animals moved completely randomly without any southerly bias (B, = 0.0). Figure 5 shows a graph of the natural logarithm of T, versus the natural logarithm of landscape size (m2). The results show a straight line with a slope of 1.0, meaning that the scale transformation is a
Fig. 7.’ Fig.
6. The percent of animals that emerge to the south (P,) and mean transit time (T,) for three different landscape maps.
simple geometric change with a change in area of the landscape. Such a simple scale transformation can be expected only if no changes in process or constraints occur as one changes scales.
Scale-dependent,
dominant
processes
Even when a single process dominates the pattern at many scales, additional processes and constraints may still introduce uncertainty into any attempt to extrapolate fine-scale information to broad spatial scales. This problem can be illustrated with the SRM model by simulating movement across landscapes that differ slightly in their fine-scaled detail. The movement of 5000 animals was simulated across 4 x 4 landscapes with different fine-scale patterns (Fig. 6). Each landscape contained seven sites with favorable habitat and nine sites that were unsuitable. The landscape had a constant value of p, but the spatial arrangement of the habitat differed. The animals moved at random (i.e., without directional bias), and those that emerged to the north, east, or west were considered to have been unsuccessful in traversing the landscape (i.e., landscapes were not wrapped in an east-west direction). The percent emergence and mean transit time varied among three different landscapes (Fig. 6). The distinction between the landscapes is that the
The percent of animals that emerge to the south (P,) and mean transit time (T,) for five similar landscape patterns.
longest north-south path length differs with the spatial pattern. On landscape type I (Fig. 6), the longest north-south path length is 2. Therefore, an animal can never take more than 2 steps in a southerly direction without confronting a barrier. As a result, fewer than 2% of the animals succeeded in moving through the landscape, and the average time of transit (T,) was 12 steps. Landscape type II (Fig. 6) has a single north-south pathway of length 3, permitting more animals (4.3%) to emerge to the south with a mean time of transit of 10.4 steps. Landscape type III (Fig. 6) contains a single direct path from north to south through the landscape, allowing animals to move directly through the landscape without detours. As a result, more than 10% of the animals emerge to the south with a mean transit time of about eight steps. The longest direct path length seemed to be correlated with the percent of animals that successfully traversed the landscape. To determine if this one pattern parameter is sufficient, we simulated a set of 5 x 3 landscapes, all of which had a longest path length of 5 and only two sites of unfavorable habitat. If the length of the direct path controls movement, then these four landscape configurations should produce the same results. Knowledge of the longest path length seemed to predict percent emergence (Fig. 7). However, despite the similarities among the five systems, there were important differences in transit time. Because the movement of 5000 animals was simulated for
224 each landscape type, these differences are all statistically significant. The mean transit time is related to the size of the contiguous habitat areas on the landscape. When the contiguous area is large (12 sites in landscape type IV, Fig. 7), the random path taken by each animal tends to be longer. When the area is smaller (in system types I and III, where the area is 9 units), the transit time decreases. The map with the shortest mean transit time (Fig. 7, system III) has the fewest contiguous sites, providing less opportunity for wandering around on long path lengths before emerging. Our search for a simple set of pattern parameters which allow results to be resealed was not successful. The fine-scale detail of landscape structure (i.e., the specific arrangement of suitable habitat sites) made a difference in determining the rate of movement at larger scales. The system constraints (e.g., the longest path length and the largest contiguous area) seem to be the best predictors of animal movement and might explain much of the variance in percent emergence and transit time at larger scales. Scale-dependent processes across hierarchical levels Perhaps the most complex scale transformations occur when movement from fine scale to broad scale involves a movement across a hierarchical level (Allen and Starr 1982; O’Neill et al. 1986). In this case the dominant process may change completely, or new constraints may affect processes occurring at fine scales. O’Neill (1979) provides a number of examples of how changing hierarchical levels can change the expression of a process. A landscape example of a scale transformation across hierarchical levels is given by Krummel et al. (1987). Forest patches dominated by human activities tended to be small, and their shapes were simple. Large forest patches, however, were relatively free of human activities, and their complex shapes were determined by constraints associated with the topography of the landscape. Transformation of information between landscapes which differ in grain size can also be demon-
25 -
A I:4
1:3 NORTH:
I:2 SOUTH
I:,
2:i PROBABILITY
3:1 RATIO
Fig.
8. Changes in the percent emergence south (P,) as a function of the bias in movement and the grain of the landscape map.
strated with the use of the SRM model. A series of simulations was conducted in which the percent of the simulated animals emerging to the south for a coarse-grained 1 x 3 landscape was compared with those for a finer-grained 3 x 9 landscape. (These simulated landscapes were of equal extent and thus differ only in grain.) Unlike the simple identities we found in Table 1, the probability of successfully traversing the landscape is now a complex function of bias or directionality in animal movement. A large southerly bias (B, = 0.75) results in 75% of the animals emerging to the south irrespective of landscape grain (Fig. 8). Similarly, strong northerly bias (B, = 0.75) results in no animals emerging from the south side of the grid. At intermediate levels of bias, the finer-grained landscape provides many opportunities for the animal to take complex pathways before emerging to the north, east, or west. As a result, the 1 x 3 landscape shows a greater probability of animals emerging to the south. Because the fine-grain (3 x 9 landscape) information can predict the large-grain (1 x 3 landscape) behavior only at the extremes of bias, there does not appear to be a simple rule for transformation across these scale differences. For complex scale transformations, the only approach is to gather direct observations at both small and large scales. Given observations at both scales, it may be possible to move between scales by using the observed empirical relationships, e.g., Fig. 8.
225
But, in fact, no apriori extrapolation of the broadscale process is possible if only the fine-scale dynamics are known. Therefore, knowledge of critical thresholds can be useful in defining where extrapolations can occur for hierarchical systems. There has been a great deal of interest in the literature on percolation theory concerning the determination of scaling relationships near the critical threshold, p,, with results well established for infinite networks (Ohtsuki and Keyes 1988; Voss et al. 1982; Margolina et al. 1984). These authors have shown that the time, t, required to move across a random map scales as t = md, where m is the linear dimension (extent) of the map and d is the fractal exponent relating space to time [see arguments presented by Stauffer (1987) justifying this use of a fractal dimension]. The exponent, d, can be experimentally determined for any percolation model by simulating movement from the center of a map of size m , measuring the time, t, necessary for the animals to reach the map edge, and then calculating d as [ln(t)/ln(m)]. A series of Monte Carlo simulations of the SRM model was performed to determine scaling relationships for maps which differ in grain (k) and extent (m). Organisms were started in the center of the map (rather than the north end) and moved at random (e.g., no directional bias) with probability i until they reached the edge of the map. The value of i is the probability of an animal moving to an adjacent site during one time step. (It had been set at 1.0 for all previous simulations.) Results show that d varies as a function of p, the fraction of occupied sites, and i, the probability of movement (Fig. 9). The adjustment necessary to obtain the exact relationship for finite systems is t = l/k(m/2)d, where k is the grain size of the map. The division of m by 2 is necessary because the simulations were started in the center of the map. As an example, suppose that a 100 x 100 grid is placed over a landscape map with the scale of each grid unit equal to 10 km. The grain of the map, k, is equal to the length of each grid unit, and the extent of the map, m, is then 1000 km (100 x 10 km). Thus, for this example the time, t, to reach the map boundary will scale as 1/10(1000/2)d.
0.6 0.4
I
I
I
I
I
0.5
0.6
0.7
0.8
0.9
1.0
pxi
Fig. 9. Estimates of the critical exponent, d, for scaling predictions when p. the fraction of susceptible sites, and i, the probability of movement, are varied.
Figure 9 indicates that critical phenomena occur as a function of the product of p and i. When (p * z) = 1 .O, then d = 1 .O, and results scale as a direct function of the extent of the map. When (p * i) c p,, the landscape pattern prevents the animals from moving (note the break in the curve for values of p * i near 0.6). Because uncertainties are largest near the critical threshold, the movement parameter, i, is best esimated when (p * z) is greater than pc. If d = 1.0, then (p * i) must also equal 1.0; however, when d > 1 .O andp is known, then values of i can be estimated independently of the grain and extent of the map. (For more details on the ecological applications of percolation theory for exploring critical phenomena see Cox and Durrett 1988; Grassberger 1983; MacKay and Jan 1984; von Niessen and Blumen 1988). Similar methods can be devised for extrapolating predictions of the spread of annual plants (e.g., percent site, Table 1) as a function of the grain and extent of the map.
Summary A simple model of animal movement on patterned and random landscapes has been used to illustrate the translation of information across scales. The results show that simple relationships between pattern and process can result in a variety of scaledependent effects. Four alternative responses to changes in scale were considered: (1) processes
226 unaffected by changes in scale, (2) processes remaining similar across scales, (3) dominant processes remain similar but affected by additional constraints creating ‘noise’ in scale-dependent predictions, and (4) processes altered by scaledependent changes in constraints that cause the extrapolation to be risky or impossible. These examples may provide some guidance for studies relating pattern to process at several scales. When a process is insensitive to scale (response l), then fine-scale information is of great value because it can be immediately applied at broader scales. Likewise, few scale problems occur when a process is similar in its effect across many scales (response 2). For instance, Fig. 5 shows a graph of the natural logarithm of T, versus the natural logarithm of landscape size (m2) that can be used to rescale the time required for an animal to move across a landscape to be resealed to landscapes of different size. Devising a simple set of deterministic pattern parameters that would allow results to be easily rescaled was a failure for scale-dependent relationships (response 3) because the fine-scale detail of landscape structure (i.e., the specific arrangement of habitat sites) is important in determining the rate of movement at larger scales. The system constraints (e.g., the longest path length and the largest contiguous area) seem to be the best predictors of animal movement and might explain much of the variance in percent emergence and transit time at larger scales. Perhaps the most complex scale transformations occur when movement from fine scale to broad scale involves a movement across a hierarchical level (response 4). In this case the dominant process may change completely, or new constraints affecting the processes may be involved. Presently, the only satisfactory approach to this class of scaledependent problems is an empirical one - to gather direct observations at both small and large scales. Given observations at both scales, it may be possible to move between scales by using the observed empirical relationships (e.g., Fig. 8), but no apriori extrapolation of the broad-scale process is possible if only the fine-scale dynamics are known. An alternative approach to the problems of ex-
trapolating information across a hierarchical system (response 4) is to identify critical thresholds below or above which extrapolations may be possible. Critical thresholds exist when slight changes in landscape pattern produce sudden changes in the response of the process. These thresholds have been identified by a number of theoretical studies (Rosen, this issue) and can be shown to place ultimate limits on the extrapolation of fine-scale measurements to broader spatial scales. Thus, extrapolation of information across a critical threshold requires information on the behavior of the system on both sides of the threshold. In addition to the many practical difficulties of performing studies at several scales, the results presented here show that careful experimental techniques are necessary to prevent process from being confounded with pattern. For example, the uppermost curve on Fig. 2 shows that, at high values of directional bias in animal movement (B = 0.88) and habitat availability (p = 1 .O), there is no relationship between percent of animals that emerge from the southern edge of the landscape, P,, and landscape size. If experiments were conducted under these conditions, one would conclude that size has no effect on the process. This conclusion may be erroneous because information was gathered only across a limited range of values of the parameters defining landscape pattern. At other combinations of B and p the interaction of pattern and process is dramatically different (Fig. 2). The complexity of the relationships requires that all of the factors influencing movement on the landscape be considered before reaching general conelusions . The use of our simple model for relating pattern and process is not intended to predict the response of actual animals to real landscape patterns. However, as our understanding of relationships between pattern and process improves, we believe that theoretical investigation of scale-dependent relationships will provide important insights for new empirical studies and lead to a useful predictive landscape theory.
227 Acknowledgments Research was supported in part by the Ecological Research Division of the Office of Health and Environmental Research, U.S. Department of Energy under contract DE-AC05-840R21400 with Martin Marietta Energy Systems, Inc., and in part by the Ecosystem Studies Program, National Science Foundation under grant BSR 8614981. Support for M.G. Turner was provided by the Department of Energy’s Alexander P. Hollaender Distinguished Postdoctoral Fellowship, administered by Oak Ridge Associated Universities. Publication No. 3356, Environmental Sciences Division, Oak Ridge National Laboratory.
References Allen, T.F.H. and Starr, T.B. 1982. Hierarchy: perspectives for ecological complexity. The University of Chicago Press, Chicago. Burrough, P.A. 1981. Fractal dimensions of landscapes and other environmental data. Nature 294: 240-242. Burrough, P.A. 1983. Multiscale sources of spatial variation in soil: The application of fractal concepts to nested levels of soil variation. J. Soil Sci. 34: 577-587. Cox, J.T. and Durrett, R. 1988. Limit theorems for the spread of epidemics and forst fires. Stochastic Processes and Their Applications 30: 171-191. Gardner, R.H., Milne, B.T., Turner, M.G. and O’Neill, R.V. 1987. Neutral models for the analysis of broad-scale landscape pattern. Landscape Ecol. 1: 19-28. Grassberger, P. 1983. On the critical behavior of the general epidemic process and dynamical percolation. Math. Biosci. 63: 157-172. King, A.W., DeAngelis, D.L. and Post, W.M. 1987. The seasonal exchange of carbon dioxide between the atmosphere and the terrestrial biosphere: extrapolation from site-specific models to regional models. ORNL/TM-10570. Oak Ridge National Laboratory, Oak Ridge, TN. King, A.W., Emanuel, W.R. and O’Neill, R.V. Linking mechanistic models of tree physiology with models of forest dynamics: problems of temporal scale. In Proceedings of Conference on Forest Growth: Process Modeling of Response to Environmental Stress, Gulf Shores Conference, April 19-22, 1988. Timber Press, Auburn, Alabama (in press).
Krummel, J.R., Gardner, R.H., Sugihara, G., O’Neill, R.V. and Coleman, P.R. 1987. Landscape patterns in a disturbed environment. Oikos 48: 321-324. Lovejoy, S. 1982. Area-perimeter relation for rain and cloud areas. Science 216: 185-187. Lovejoy, S., Schertzer, D. and Tsonis, A.A. 1987. Functional box-counting and multiple elliptical dimensions in rain. Science 235: 1036-1038. MacKay, G. and Jan, N. 1984. Forest fires as critical phenomena. J. Phys. A: Math. Gen. 17: L757-L760. Mandelbrot, B.B. 1967. How long is the coast of Britain? Statistical self-similarity and fractional dimension. Science 156: 636-638. Mandelbrot, B.B. 1983. The fractal geometry of nature. Freeman, New York. Margolina, A., Nakanishi, H., Stauffer, D. and Stanley, H.E. 1984. Monte Carlo and series study of corrections to scaling in two-dimensional percolation. J. Phys. A: Math. Gen. 17: 1683-1701. Milne, B.T. 1988. Measuring the fractal geometry of landscapes. Appl. Math. Comput. 27: 67-79. Morse, D.R., Lawton, J.H., Dodson, M.M. and Williamson, M.H. 1985. Fractal dimension of vegetation and the distribution of arthropod body lengths. Nature 314: 731-733. Ohtsuki, T. and Keyes, T. 1988. Scaling theory of hydrodynamic dispersion in percolation networks. Phys. Rev. A 37: 2669-2672. O’Neill, R.V. 1979. Transmutations across hierarchical levels. In Systems Analysis of Ecosystems. pp. 59-78. Edited by G.S. Innis and R.V. O’Neill. International Cooperative Publishing House, Fairland, Maryland. O’Neill, R.V., DeAngelis, D.L., Waide, J.B. and Allen, T.F.H. 1986. A hierarchical concept of ecosystems. Princeton University Press, Princeton, New Jersey. Rosen, this issue. Stauffer, D. 1985. Introduction to percolation theory. Taylor and Francis, London. Stauffer, D. 1987. Random boolean networks: analogy with percolation. Phil. Mag. B 56: 901-916. Sugihara, G. Applications of fractals in ecology. Trends in Ecology and Evolution (in press). Turner, M.G., Dale, V.H. and Gardner, R.H. Predicting across scales: theory development and testing (this issue). Turner, M.G., Gardner, R.H., Dale, V.H. and O’Neill, R.V. Predicting the spread of disturbance across heterogeneous landscapes. Oikos (in press). von Niessen, W. and Blumen, A. 1988. Dynamic simulation of forest fires. Can. J. For. Res. 18: 805-812. Voss, R.F., Laibowitz, R.B. and Allessandrini, E.I. 1982. Fractal (Scaling) clusters in thin gold films near the percolation threshold. Phys. Rev. Lett. 49: 144-1444.