formerly introduced measures of SR based on the residence-time distribution and compare with those based on the response function. S1063-651X9808005-2.
PHYSICAL REVIEW E
VOLUME 57, NUMBER 6
JUNE 1998
Quantifying stochastic resonance in bistable systems: Response vs residence-time distribution functions Mee H. Choi, R. F. Fox, and P. Jung* School of Physics, Georgia Institute of Technology, Atlanta, Georgia 30332-0430 ~Received 10 September 1997! A wealth of research on stochastic resonance ~SR! during the past decade has led to different ways of defining this phenomenon. Most prominent are measures based on the response function and on the residencetime distribution function. While the theory for the response functions is well developed, a first fully systematic theory for the residence-time distribution functions is developed in this paper. Subsequently we reconsider formerly introduced measures of SR based on the residence-time distribution and compare with those based on the response function. @S1063-651X~98!08005-2# PACS number~s!: 05.40.1j I. INTRODUCTION
In the early 1980s, Benzi et al. @1# and Nicolis et al. @2# discovered a phenomenon that they have termed stochastic resonance @3#. This effect allows the enhancement of a periodic signal by a bistable device when a certain dose of noise is added. Since the effect was introduced in conjunction with a ~rather specific! model to explain the more or less periodic occurrences of ice ages, it took until the late 1980s before the universality and general applicability of this effect were recognized. A wealth of theoretical and experimental papers followed, extending the notion of stochastic resonance ~for extensive reviews, see @4,5# and for a collection of papers, see @6,7#! and discovering new applications. During these times, new measures of stochastic resonance were introduced. In the original papers mentioned above, the enhancement of the periodic signal was characterized by the response amplitude at the frequency of the periodic signal. Fauve and Heslot @8# and McNamara, Wiesenfeld, and Roy @9# introduced the signal-to-noise ratio ~SNR! to quantify SR, a quantity used in engineering to describe the quality of a signal within a noise background. While both quantities, the amplitude and the SNR, undergo a resonancelike curve as a function of the noise level, the maxima are located at different values of the noise strength. Although the location of the maximum of the response amplitude ~in contrast to the SNR! can be understood approximately in terms of a time-scale matching condition @10#, it was shown by Lu and Fox @11# that this matching condition does not become exact in any limit. Furthermore, neither the response amplitude nor the SNR undergoes a maximum when the driving frequency is varied. Other measures of SR, based on the residence-time distribution of a bistable, periodically driven system @12–14#, have been introduced to characterize SR. Zhou et al. @13# studied the heights of peaks in the residence-time distribution at odd multiples of the half-period of the driving. They go through maxima as a function of the noise. Gammaitoni et al. @15# introduced the area under the peak of the resi-
dence-time distribution at the half-period of the driving as a measure for SR. They have shown that this area goes through a maximum as a function of the noise or the driving frequency and concluded that SR is a bona-fide resonance. The noise strength that maximizes the area under the peak, however, does not match either the value of the noise that maximizes the response amplitude or that which maximizes the SNR. Although it seems generally known that all these quantifiers of SR yield different maximizing noise strengths, it has not yet been attempted to quantitatively pin down these differences. The paper is organized as follows. In Sec. II, we briefly introduce the model, i.e., a periodically forced Brownian particle, moving overdamped in a bistable potential. In Sec. III, we review the properties of the linear response amplitude. In Sec. IV, escape-time distributions and residence-time distribution are discussed. Although they are of importance especially in the context of neurophysiological applications, a fully systematic theory has not yet been put forward. Based on a rate equation, we extend earlier theories by Zhou, Moss, and Jung @13# and Lofstedt and Coppersmith @16# to obtain a fully systematic analytic expression for the residence-time distribution for weak periodic signals ~linear regime! and an asymptotic theory for the strongly nonlinear regime. Based on this fully analytical result, it is then shown ~at least for small signal amplitudes! that SR is not a bonafide resonance, notwithstanding the conclusions in @15#. II. MODEL AND BASIC EQUATIONS
From the early times in SR research on, the standard model for study was an overdamped particle moving in a symmetric bistable potential under the influence of noise and periodic forcing. Although things can be formulated much more generally, we will also adopt this model in this paper. The Langevin equations for this model reads in suitable normalized units @4#, x˙ 52V 8 ~ x ! 1A sin~ Vt ! 1 j ~ t ! , with the potential 1 1 V~ x !5 x 42 x 2 4 2
*Present address: Department of Physics and Astronomy, Ohio University, Athens, OH 45701. 1063-651X/98/57~6!/6335~10!/$15.00
57
~1!
6335
~2!
© 1998 The American Physical Society
6336
MEE H. CHOI, R. F. FOX, AND P. JUNG
and white, zero mean Gaussian noise j (t) characterized by
^ j ~ t ! & 50, ^ j ~ t ! j ~ t 8 ! & 52D d ~ t2t 8 ! ,
] P ~ x,t u x 0 ,t 0 ! 5L~ x,t ! P ~ x,t u x 0 ,t 0 ! , ]t
~4!
with the Fokker-Planck operator L~ x,t ! 52
] ]2 ~ x2x 3 1A sin Vt ! 1D 2 ]x ]x
~5!
and the initial condition P ~ x,t 0 u x 0 ,t 0 ! 5 d ~ x2x 0 ! .
~6!
III. THE RESPONSE TO PERIODIC DRIVING AND STOCHASTIC RESONANCE
Although there are many ways to describe the response of a particle moving in the double well potential due to the periodic forcing, we use here the ensemble average ^ x(t) & @averaged over the realizations of the noise term j (t)#, defined via the transition probability density as
^x~ t !&5
E
`
2`
P ~ x,t u x 0 ,t 0 ! xdx
U
.
~7!
t 0 →2`
This asympototic mean value vanishes in the absence of periodic forcing for the symmetry of the double well system and can be written in leading order of the driving amplitude ~see, e.g., @4#! as
^ x ~ t ! & 5A x ~ V,D ! exp~ iVt ! 1c.c.,
~8!
with the susceptibility x (V,D). In a two-state picture that only considers instantaneous jumping between the potential wells, the susceptibility assumes the simple form
x ~ V,D ! 5
1 2r K ~ D ! ^ x 2 & 0 . D 2r K ~ D ! 1iV
~9!
The Kramers’ escape rate r K (D) @17# ~in our dimensionless units! is given by r K~ D ! 5
1
A2 p
2
S D
exp 2
1 , 4D
~10!
and the moment ^ x & 0 of the unperturbed (A50) stationary probability density reads @4# 2
^ x 2& 05
1
D23/2~ 21/A2D !
2 A2D D21/2~ 21/A2D !
which contains the parabolic cylinder functions Dn (x). The response amplitude a(V,D), given by the modulus of the susceptibility
~3!
where D describes the strength of the noise. We call A the amplitude and V the frequency of the periodic driving. Equivalently, this Markovian, stochastic process is described by a Fokker-Planck equation for the transition probability density P(x,t u x 0 ,t 0 ),
,
~11!
57
a ~ V,D ! 5A u x ~ V,D ! u 5
A ^ x 2& 0 D
2r K ~ D !
A4r 2K ~ D ! 1V 2
, ~12!
runs through a maximum as a function of the noise strength D. This phenomenon has been termed stochastic resonance @1#. The noise value D 0 , at which the amplitude assumes a maximum, is given by the zero of a transcendental function. We also want to note that the square of the response amplitude a(V,D) 2 is proportional to the intensity of the spike in the power spectrum of the stochastic process x(t) at the driving frequency V and, therefore, a measure of how periodic the stochastic motion is. With intuitive arguments, Jung and Ha¨nggi @10# have conjectured that the maximum should be defined by the condition that the period of the driving T52 p /V matches twice the dwell time T K (D)51/r K (D) of the system in one well since the hopping is then optimally synchronized with the driving. We denote the value of the noise at which this timescale matching ~TSM! condition is fulfilled by D TSM , i.e., V5 p r K (D TSM). It has turned out, however, that although this condition is fulfilled approximately and the predictions by using it are qualitatively correct, there is no limit in which it becomes exact @11#. As a matter of fact, the relative deviation between D 0 and D TSM exhibits a minimum at a finite value of the driving frequency, but increases as the driving frequency becomes smaller or larger @11#. Comparison with full numerical solutions of the Fokker-Planck equation shows @11# that the disagreement of D 0 with D TSM is not due to a technical shortcoming of the linear response approximation ~always assuming that the modulation amplitude A is kept small in comparison with the noise strength D! but is rather an inherent property of the system. Another important property of the response amplitude is that it—unlike for a dynamical resonance—decays monotonically as a function of the frequency. This behavior underpins the statistical nature of SR. Another common measure of SR related to the response amplitude is the signal-to-noise ratio ~SNR!. It is based on the shape of the power spectrum, consisting of a broad Lorentzian-like background with additional d spikes at odd multiples of the driving frequency. The d spikes reflect the periodic component of the motion of the particle in the double well potential. The weight of the d spike at the frequency of the driving, g V , which describes the intensity of this periodic component, has been shown to be proportional to the square of the response amplitude a(V,D) ~see, e.g., @4#!, i.e.,
p g V 5 u a ~ V,D ! u 2 5 ~ 1/2! p A 2 u x ~ V,D ! u 2 . 2
~13!
To leading order of A, the signal-to-noise ratio is obtained from Eq. ~13! by dividing twice @18# the weight g v by the power spectrum of the unperturbed system at the driving frequency, i.e.,
57
QUANTIFYING STOCHASTIC RESONANCE IN . . .
S 0~ V ! 5
4r K ~ D ! ^ x 2 & 0 4r 2K ~ D ! 1V 2
~14!
6337
with the forward and reverse transition rates r 2 (t) and r 1 (t) given by ~see, e.g., @4#! r 6 ~ t ! 5r K ~ D !
yielding R
pA2 5 2 r K~ D ! ^ x 2& 0 . D
SNR
S
3 69 3 17 A sin~ Vt1 f 0 ! 2 A 2 sin2 ~ Vt1 f 0 ! 4 32
~15!
The SNR runs through a maximum as a function of the noise, but at a value D SNR that does not agree with D TSM or D 0 . Most notably, D SNR does not even depend on the driving frequency @at least, within the approximation leading to Eq. ~15!#. It is evident that the peak position in the signal-tonoise ratio therefore does not directly reflect synchronization between the hopping and the driving @19#. IV. RESIDENCE-TIME DISTRIBUTION FUNCTION
Other measures for stochastic resonance are based on the residence-time distribution of the system in one potential well. In the absence of periodic driving, the two basins of attraction of our model, x,0 and x.0, are separated by the saddle point x u 50. Escaping from one potential well into the other one, the particle has to pass the unstable point x u . The residence times for a particle in one well are the times between successful crossings of x u ; successful meaning that it does not immediately recross in the boundary layer around x u . The residence times are statistically distributed according to the residence-time distribution function ~RTDF!. In the presence of periodic forcing, the point x u 50 is not the separation point of the basins of attractions at all times. It has been shown ~see, e.g., @4#! that the basins of attraction are separated by an unstable periodic orbit located in the vicinity of the top of the barrier. The attractors are, in the presence of periodic forcing, stable limit cycles located in the vicinity of the former potential minima ~as long as the driving amplitude is small!. The residence times are now defined as the time intervals between two successful crossings of the unstable periodic orbit. In the presence of driving, we distinguish between residence-time and escape-time distribution functions. The escape-time distribution function describes the distribution of times the particle spends in one well, conditioned by the entrance phase of the external driving, i.e., by the phase of the external driving when the particle enters the respective well. The residence-time distribution function is the distribution of times the particle spends in one well, irrespective of the entrance phase of the external driving. In the absence of periodic driving, both distribution functions are equivalent.
S
3exp 6
A 3A 2 sin~ Vt1 f 0 ! 2 sin2 ~ Vt1 f 0 ! D 4D
D D
~17! and the Kramers’ escape rate r K (D) of the unperturbed system Eq. ~10!. The expressions Eq. ~17! for the escape rate have been derived under the assumptions that the periodic modulation is slower than the local relaxation rate ~i.e., V !1!, and that the amplitude of the driving is small against the barrier height, i.e., A! A4/27 ~in our dimensionless units!. The reduction from the full Fokker-Planck equation to the rate equation is based on the clear-cut time-scale separation between relaxational modes within the potential well and the relaxation mode across the barrier, valid if the noise is small against the barrier height, i.e., D!0.25. The time scale separation is quantified by one exponentially small eigenvalue of the Fokker-Planck operator, which dominates the relaxational dynamics across the barrier. The time scale on which the master equation is correct is large in comparison to relaxation times within the potential wells. Note that within these inequalities, the ratio a [A/D and b [r K (D)/V can still be small or large. In the following, we consider, without loss of generality, the escape out of the right potential well, i.e., particles are absorbed after they escape the right well. The particle enters the right well at time t 0 ; we specify the phase of the periodic driving at time t 0 by f 0 5Vt 0 . Starting to measure the time, t, when the particle enters the right well, the escape-time distribution of the right well is obtained from the rate equation ~16! as
SE
1 r r ~ t u f 0 ! 5 r 2 ~ t ! exp 2 Z
t
0
D
r 2 ~ t ! dt ,
~18!
where Z is a normalization constant. Throughout this paper, we use the convention that escape-time distributions vanish identically for negative times t. In the limit a 5A/D→0, the integral in Eq. ~18! can be solved approximately, yielding for the escape-time distribution of the right well
A. Escape-time distributions
A theory for escape time distributions has been put forward by Zhou et al. @13# on the basis of a rate equation for the populations of the left „p l (t)… and right „p r (t)… basin of attraction ~termed ‘‘wells’’ from now on!, i.e.,
3exp„2 b ~ 11 41 a 2 ! V t …
~19!
with
p˙ r ~ t ! 5r 1 ~ t ! p l ~ t ! 2r 2 ~ t ! p r ~ t ! , p˙ l ~ t ! 5r 2 ~ t ! p r ~ t ! 2r 1 ~ t ! p l ~ t ! ,
r ra →0 ~ t u f 0 ! 5r K ~ D !@ 11 a f 1 ~ t , f 0 ! 1 a 2 f 2 ~ t , f 0 !#
~16!
f 1 ~ t , f 0 ! 52sin~ V t 1 f 0 ! 2 b @ cos~ V t 1 f 0 ! 2cos~ f 0 !# ~20!
6338
MEE H. CHOI, R. F. FOX, AND P. JUNG
f 2~ t , f 0 ! 5
57
one finds the conditional probability density for the exit phase f of the right well ~see also @16#!,
1 sin2 ~ V t 1 f 0 ! 2 1 1 b @ sin„2 ~ V t 1 f 0 ! …2sin~ 2 f 0 !# 8
P r~ f u f 0 ! 5
1 1 b 2 @ cos~ V t 1 f 0 ! 2cos~ f 0 !# 2 2 1 b sin~ V t 1 f 0 !@ cos~ V t 1 f 0 ! 2cos~ f 0 !# .
1 r ra →` ~ t u f 0 ! 5 exp„2 a sin~ V t 1 f 0 ! … Z
F H SA
3exp 2 bg 2n2erf 1erf
SA
a ~ f 0 23 p /2! 2
a ~ V¯t 1 f 0 23 p /2! 2
DJG
,
D
~22!
where ¯t is the time t modulo the period of the driving T, n5int( t /T), g [ Ap /(2 a ) exp(a) and erf(x) is the error function. The Gaussian approximation also requires that the driving frequency is larger than the Kramers rate r K (D); otherwise, most of the escape takes place before the integrand reaches its maximum and the Gaussian is not an accurate approximation. For the case V!r K (D) one can derive the following expression for the escape-time distribution: 1 r ra →`, b →` ~ t u f 0 ! 5 exp„2 a sin~ V t 1 f 0 ! … Z 3exp$ 2V tb exp@ 2 a sin~ f 0 !# % . ~23! The escape-time distribution r ra →` ( t , f 0 ) consists of a series of exponentially decaying peaks, separated by the period T of the driving. For our symmetric double well potential, the escape-time distribution of the left well is obtained from the escape-time distribution of the right well by a phase shift of p, i.e.,
r l~ t u f 0 ! 5 r r~ t u f 01 p ! .
~24!
B. Entrance and exit phase distribution
Given the entrance phase f 0 for the right well, the exit phase f 5 f 0 1V t can be obtained from the escape-time distribution by transforming from time t to phase f. Taking into account the infinite valuedness of this transformation,
( rr n52`
S
D
1 ~ f 2 f 0 12n p ! u f 0 . ~25! V
This is a periodic function of the exit phase f. The exit phase distribution W ex r ( f ) of the right well is given by the integral
~21! In order to obtain this result, terms of order A, A 2 , and A 2 /D have been neglected compared with terms of order a 5A/D and a 2 5A 2 /D 2 . The purely exponential decay in the absence of the driving is weakly modulated. For large A/D, the integrals in Eq. ~18! can be evaluated by first integrating over integer multiples of the period and then replacing the remaining integrand in Eq. ~18! by a Gaussian centered around its maximum, yielding @13#
`
1 V
W ex r ~ f !5
E
2p
0
P r ~ f u f 0 ! W entr r ~ f0!df0 ,
~26!
where W entr r ( f ) is the entrance phase distribution of the right well. For the left well we can write down the analogous relation W ex l ~ f !5
E
2p
0
P l ~ f u f 0 ! W entr l ~ f0!df0 .
~27!
The underlying assumption of these integral relations is the statistical independence of subsequent escape events. Since escape events are rare events, the system spends most of the time in the potential wells. Correlations between escape events are therefore negligibly small and the integral relations above are a good approximation. Since the exit distribution of the left attractor serves as the entrance distribution of the right attractor and vice versa, we obtain the closed set of integral equation ~see also @16#!, W entr r ~ f0!5
E
W entr l ~ f0!5
E
2p
0
2p
0
P l ~ f 0 u f 8 ! W entr l ~ f 8 !d f 8,
P r ~ f 0 u f 8 ! W entr r ~ f 8 !d f 8.
~28!
In the case of the symmetric potentials that we are discussing here, the conditional probabilities for the exit phases in the right and left wells are identical up to a phase shift by p. In Ref. @16#, these integral equations have been solved numerically and an analytical solution has been attempted. In the following, we show that these integral equations can be solved exactly in the limit of small A/D leading to a number of relevant terms additional to those obtained in @13# and @16#. 1. Phase distributions for A/D˜0
Fitted with an approximate expression for the escape-time distribution Eq. ~19! for weak periodic forcing (A/D→0), we are now in the position to compute the exit and entrance phase distributions. As a matter of fact, to compute the residence-time distribution function up to order a 2 , we need the phase distributions only up to leading order a. The kernels of the integral equations ~28! can be constructed by using Eq. ~25! yielding
QUANTIFYING STOCHASTIC RESONANCE IN . . .
57
P r,l ~ f u f 8 ! 5
6339
b exp„2 b ~ f 2 f 8 ! … $ 17 a sin~ f ! 12exp~ 22 p b ! 7 ab @ cos~ f ! 2cos~ f 8 !# % ,
~29!
where f and f 8 are defined within the interval @0:2p# and have to be taken modulo 2p. The kernels are also periodic functions of f and f 8 with a discontinuity at f 5 f 8 , which is inherited from the escape-time distribution ~discontinuity at t 50!. In the absence of driving (A50), the kernel depends only on the difference of the phases f and f 8 . The uniform phase distribution is therefore the consistent solution of the set of integral equations. We are solving the integral equations ~28! by using a series expansion. The starting point is the uniform entrancephase distribution of the right well, i.e., W r ( f )51/(2 p ). The first iterate yields for the entrance phase distribution of the left well
W entr l ~ f !5
F
G
a 1 12 sin~ f 1 d 1 ! , 2p A11 b 2
~30!
with the shift tan d15b. The second iteration yields an entrance phase distribution for the right well, W entr r ~ f !5
F
a 1 11 sin~ f 1 d 1 ! 2p A11 b 2 2
G
ab sin~ f 1 d 1 1 d 2 ! , 11 b 2
~31!
with the additional shift tan d2521/b . By carefully inspecting the additional terms due to further iterations of the integral equations, one finds that they are self-similar from iteration to iteration, allowing exact summation, i.e.,
W entr r,l ~ f ! 5
F
a 1 16 sin~ f 1 d ! 2p A11 b 2 7
a
`
( A11 b 2 n51
G
b n ~ 21 ! n11 sin~ f 1 d 1 1n d 2 ! . ~ 11 b 2 ! n/2 ~32!
The summation can be converted into a geometric series, allowing exact evaluation. Eventually one arrives at the simple result W entr r,l ~ f ! 5
F
a 1 16 sin~ f 1¯d! 2p A114 b 2
G
~33!
with tan(¯d)52b. For frequencies large compared to the rate r K , we recover in leading order an entrance phase distribution for the left ~right! well proportional to exp„7A/D sin(f)…, first obtained heuristically in @13#. It shows a maximum at the phase f m 5(3/2) p ( f m 5 p /2), i.e., when the potential is tilted fully to the left ~right!. These maxima signify preferred jump phases
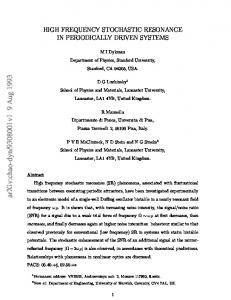
FIG. 1. The exit-phase distribution of the left well is shown for ~a! D50.10, A50.01, and V50.01. Results of a numerical simulation of the Langevin equation ~1! ~wiggly line! are compared with the analytical solution in Eq. ~33! ~dashed line!. In ~b! we have used the larger driving frequency V50.05. Most important, the maximum moves for decreasing driving frequencies away from p /2 to smaller angles.
at f 5(3/2) p ( f 5 p /2). Our present systematic analysis shows that for decreasing frequencies ~increasing b!, the peak shifts to smaller phases and the phase distribution flattens out @see Figs. 1~a! and 1~b!#. The amplitude of the variation from the uniform phase distribution is, in leading order of a, a monotonic function of the frequency and the noise strength and shows no evidence of a resonant behavior. 2. Phase distributions for A/D˜`
For large A/D, we have to distinguish the case of small driving frequencies V!r K (D) and large ~yet adiabatically slow in comparison to intrawell relaxation! driving frequencies r K !V!2. Note that for large A/D and small A, e.g., A,0.1, the noise has to be of the order of 0.01 or smaller, implying a Kramers’ rate of the order exp(225) or smaller. The first case V!r K (D), therefore, requires extremely small frequencies. The summation in Eq. ~25! collapses into a single term and the phase integration over the initial phase can be carried through, yielding a uniform phase distribution. In the case r K !V!2, we obtain by inserting Eq. ~22! into Eq. ~25! the conditional probability for the phase
MEE H. CHOI, R. F. FOX, AND P. JUNG
6340
57
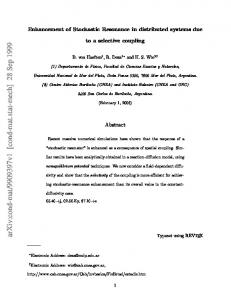
FIG. 2. The exit-phase distribution of the left well is shown for A50.2, D50.05, and V50.05 obtained from simulation of the Langevin equation ~1! ~wiggly line!, from the numerical solution of the rate equations ~16! and ~17! ~dashed line!, and from the analytical result ~35!, valid for large A/D ~diamonds!. The phase distribution is sharply peaked at p /2, the preferred jump-phase.
P r,l ~ f u f 8 ! 5
1 exp„7 a sin~ f ! … 12exp~ 22 g !
F
XA S
3exp 2 gb erf 1 gb erf
XA S
a 3 f2 p 2 2
a 3 f 82 p 2 2
D CG
DC
.
~34!
Since for V@r K , g is a small quantity, the contributions of the error functions can be neglected and the conditional probability for the exit phase becomes identical with the exit phase distribution of the right well or equivalently with the entrance phase distribution of the left well, i.e., W entr l,r ~ f ! 5
1 exp„7 a sin~ f ! …, I 0~ a !
~35!
where I 0 (x) is the first order modified Bessel function. The entrance phase distributions are sharply peaked around f 5(3/2) p ~left well! and f 5 p /2 ~right well!. In Fig. 2, we compare full exit phase distributions of the right well obtained from full numerical simulations of the Langevin equations with numerical solutions of the rate equation and the approximative result in Eq. ~35!. The numerical solution of the rate equation agrees very well with the simulation of the Langevin equation, indicating again that the rate equations ~16! and ~17! represent an excellent approximation. C. Residence-time distribution function for small A/D
Fit with the escape-time distribution, conditioned at a fixed phase, and the entrance phase distribution, the residence-time distribution is obtained by averaging the escape-time distribution by the entrance-phase distribution. For symmetric potentials, the residence-time distribution is the same for both potential wells
FIG. 3. The residence time distributions are shown at D50.1 and A50.06 for V50.01 ~a!, V50.05 ~b!, and V50.1 ~c!. The time and the distribution function are measured in dimensionless units. Results obtained from simulations of the Langevin equation ~1! ~dots! are compared with the analytical result in Eq. ~37!. The agreement is excellent. The deviations for small times are due to the failure of the rate-equation approach. The failure for small times is responsible ~via the normalization! for the slight underestimation at later times.
r~ t !5
E
2p
0
r r ~ t u f ! W entr r ~ f !df,
and is obtained in a straightforward calculation as
~36!
57
QUANTIFYING STOCHASTIC RESONANCE IN . . .
6341
FIG. 4. The residence time distribution is shown for A50.2, D50.05, and V50.05 obtained from simulation of the Langevin equation ~1! ~wiggly solid line! and from numerical solution of the rate equations ~16! and ~17! ~solid line!. The time and the distribution functions are measured in dimensionless units.
X S D CF
a2 112 b 2 1 r ~ t ! 5 exp 2r K 11 t 12 a 2 b sin~ V t ! Z 4 114 b 2
S
D
G
1 112 b 2 2 a2 1 b 2 cos~ V t ! , 2 114 b 2
~37!
with the normalization constant
Z5
F S
D
G
1 1 314 b 2 1 1 12 a 2 2 a 2 b . V b 4 2 114 b 2
~38!
Although the leading order correction to the uniform phase distribution is of second order in a, only terms of the entrance phase distribution linear in a contribute. We want to mention here that the result in Eq. ~37!, in contrast to earlier results @13,16#, has been obtained in a systematic way and is exact in leading order a 2 . For small b, i.e., when the driving frequency V is larger than the Kramers rate r K (D), we recover the results in @13# and @16#. For driving frequencies of the order of the Kramers rate or smaller ~the relevant regime for studying SR!, our result in Eq. ~37! shows differences. In Fig. 3, we compare the numerically obtained residence time distribution ~by simulation of the Langevin equation! with the approximation in Eq. ~37!. The agreement is excellent. The agreement is good up to large values of A/D51, where the theory was not expected to work. The basic features of the residence-time distribution are periodically occurring bumps on an exponentially decaying background. It has been attempted to characterize SR in terms of the residence-time distribution. In the first paper @13#, the peak heights at t n 5(2n11)T/2 have been shown to exhibit bell-shaped curves as a function of the noise strength. It is tempting to interpret these maxima as evidence of stochastic resonance. However, the reader can easily convince himself that the residence-time distribution function even in the absence of periodic driving, i.e.,
S
r ~ t n ! A50 5r K ~ D ! exp 2
D
2n11 r K~ D ! T , 2
~39!
exhibits a bell-shaped curve as a function of the noise D as long as the driving frequency is smaller than the relaxation rates in the wells. The maxima of the peak heights in the presence of periodic driving cannot be used as clear-cut evidence of stochastic resonance since they are sitting on an exponential background that itself goes through a maximum as a function of the noise. Even more misleading, the maxima of r (t n ) A50 in the absence of the driving as a function of the noise are determined by Tr K (D)52/(2n11), which is for n50 exactly the time scale matching condition V5 p r K (D), discussed in Sec. II for the response. Subtracting the exponential background from Eq. ~37! yields an exponentially decaying oscillatory function. The amplitude ¯a of this function at t 5T/2 ~the deviation from the undriven residence-time distribution!, i.e., 1 ¯a /V5 a 2 b ~ 314 b 2 ! exp~ 2 p b ! , 4
~40!
exhibits a resonant shape as a function of the noise strength. The maximizing value of the noise strength, however, is not equivalent with D TSM , D 0 , or D SNR . Similar to the response amplitude ~12!, ¯a depends on the driving frequency in a monotonous fashion. The amplitude ¯a is the only meaningful quantity we were able to extract from the residence-time distribution, which shows resonant behavior in D as a consequence of the periodic driving. The frequency dependence of ¯a is monotonic. D. Residence-time distribution function „RTDF… for large A/D
Similar to the case of small A/D, we are fitted with the necessary tools to compute the residence-time distribution by averaging the escape-time distribution ~conditioned with an
6342
MEE H. CHOI, R. F. FOX, AND P. JUNG
57
entrance phase f! over the distribution of entrance phases obtained in the above sections. For small V, i.e., V!r K , the phase distribution was uniform and we simply have to integrate the escape-time distribution over the entrance phase f. This integration cannot be done in closed form, but the result can be expressed in the simple form
r~ t !5 H~ r Kt !5
E
2p
0
1 H 8~ r Kt ! , 2p exp„2r K t g~ f ! …d f ,
g~ f ! 5exp„2 a sin~ f ! …,
~41!
which expresses nonexponential decay. In the regime r K !V!2, the entrance phase distribution for the escape out of the right well is sharply peaked at p /2, and in a first approach we can simply set the entrance phase in the escapetime distribution to p /2 to obtain ~see also @13#!
r a →` ~ t ! 5N 0 exp„2 a cos~ V t ! …exp@ 2 bg exp~ a ! $ 2n11 1erf„Aa ~ V¯t 1 f 0 2 p ! …% # .
~42!
The residence-time distribution consists of a sequence of sharp peaks located at odd multiples of the half-period of the driving. In Fig. 4, we show the residence-time distribution for A50.2, D50.05, and V50.05 obtained by full simulation of the Langevin equations and by solving numerically the rate equations with the adiabatic rates. In contrast to the case of small A/D, the effect of driving is not perturbative, i.e., the peaks are well separated from the background. The value A/D54 is not large enough for the asymptotic expression in Eq. ~42! to apply. To observe SR in the limit of large A/D, however, the driving frequency has to be extremely small. For, e.g., A50.1 and D50.01 (A/D510), the rate and, therefore, the driving frequency required for SR has to be of the order of 10211. We consider this frequency range practically irrelevant and do not discuss it further. E. ‘‘Bona-fide’’ stochastic resonance
Gammaitoni and collaborators @15# have introduced the concept of stochastic resonance as a bona-fide resonance. They have computed the area under the peak of the residence-time distribution function ~RTDF! at T/2 and have shown that it runs through a maximum as a function of the noise and as a function of the driving frequency. According to Gammaitoni et al., a maximum area under the peak at T/2 corresponds to the situation in which the statistical waiting time between two successful interwell transitions T K (D) 51/r K (D) matches half the period of the driving T/2, i.e., V5 p r K (D). We have tested this criterion in the case of a moderate value of A/D. In Fig. 5~a!, the residence time distributions are shown at a fixed value of the noise strength for four values of the driving frequency. One important observation in Fig. 5~a! is that a clear-cut separation of the peak structure and the background is only established for frequencies much larger than
FIG. 5. ~a! The residence time distribution is shown at D 50.08 and A50.1 for several different frequencies, i.e., V 50.01, 0.03, 0.05, 0.10. The distribution function and the time are measured in dimensionless units. The area F(V,D) ~in dimensionless units! under the peak centered at the half-period of the driving T/2 is plotted ~b! as a function of the driving frequency V ~in dimensionless units!. In ~c!, the area under this peak ~in dimensionless units! is shown as a function of the noise strength ~in dimensionless units! at the frequency that maximizes the area in ~b!. The dashed line indicates the value of the noise strength D50.08 used in ~b!. The shift of the dashed line with respect to the maximum indicates that maximizing the area as a function of the noise is not mutually equivalent to maximizing the area as a function of the frequency.
the average rate of decrease of the residence-time distribution. For frequencies where the decay rate and the driving frequency are of the same order ~the regime where SR takes place!, there is no clear-cut separation. The area under the first peak centered at T/2 ~integrated from T/22T/4 to T/2 1T/4! is shown in Fig. 5~b! as a function of the frequency at
QUANTIFYING STOCHASTIC RESONANCE IN . . .
57
a fixed value of the noise strength. It peaks at about V m 50.03, as predicted by the time-scale matching conditon V5 p r K (D). The area under the first peak of the residencetime distribution as a function of the noise @see Fig. 5~c!# for V5V m peaks, however, at a different value of the noise than that used in Fig. 5~b!. This shows immediately that the resonance conditions as a function of the frequency and the noise strength are not mutually equivalent, and therefore not described by the single time-scale matching condition V 5 p r K (D). As a matter of fact, the discrepancy increases with increasing amplitude A of the driving. As we lower the modulation amplitude A, the peak structure in the residence-time distribution becomes less pronounced and eventually, for vanishing modulation amplitude, disappears. Nevertheless, even in the absence of the modulation A50, the integral of the residence-time distribution from T/22T/4 to T/21T/4 goes through a maximum as a function of the noise strength D and the frequency V 52 p /T. This can be shown readily by integrating the modulated residence-time distribution r(t) 5r K (D)exp„2r K (D) t … from T/22T/4 to T/21T/4, yielding F ~ V,D ! 5
E
T/21T/4
T/22T/4
S
5exp 2
r K ~ D ! exp„2r K ~ D ! t …d t
D S
D
p 3p r K ~ D ! 2exp 2 r ~D! . 2V 2V K
6343
integration domain. Note also that the ‘‘resonance condition’’ V5„p /ln(3)…r K (D) is close to the time-scale matching conditon discussed in Sec. III since ln(3) is close to 1. V. DISCUSSION AND CONCLUSIONS
We have given a very accurate analytical expression for residence-time distributions in periodically driven, noisy bistable systems. The method used is systematic, produces very accurate results, and is broadly applicable to many other systems. We have shown, notwithstanding the bulk of literature on SR, that the earlier introduced quantifiers of SR based on the residence-time distribution do not ~at least for small driving amplitudes! provide clear-cut evidence of stochastic resonance. Especially, the so-called ‘‘bona-fide’’ criterion with its claim to detect SR even as a function of the driving frequency appears questionable. We feel that this is an important issue since in many neurobiological applications of SR, exactly these measures we are questioning have been used and are being used. We have introduced a measure to characterize SR based on the residence-time distribution, i.e., the difference of the residence-time distribution in the presence of modulation and the residence-time distribution in the absence of the modulation at t 5T/2. In qualitative agreement with the response amplitude, this measure shows a resonancelike curve as a function of the noise strength, but a monotonic frequency dependence.
~43!
ACKNOWLEDGMENTS
The area F(V,D) exhibits a maximum as a function of the noise strength and/or as a function of the frequency when the condition V5„p /ln(3)…r K (D) is fullfilled, although there is no periodic driving present. We conclude here that the ‘‘resonance’’ in the area under the first peak of the residence-time distribution observed by Gammaitoni et al. is no clear-cut evidence of stochastic resonance, but rather presents a property of the exponential function and the choice of
M.H.C. thanks the Scientific Visualization Laboratory of the Graphics Visualization and Usability ~GVU! center in the College of Computing at Georgia Tech for the use of their computers, and also thanks Markus De Shon for generating some graphics and helping to correct the manuscript. R.F.F. was supported by NSF Grant No. PHYS-9514853. P.J. was supported by the Deutsche Forschungsgemeinschaft within the Heisenberg program.
@1# R. Benzi, A. Sutera, and A. Vulpiani, J. Phys. A 14, L453 ~1981!; R. Benzi, G. Parisi, A. Sutera, and A. Vulpiani, Tellus 34, 10 ~1982!; R. Benzi, A. Sutera, G. Parisi, and A. Vulpiani, SIAM ~Soc. Ind. Appl. Math.! J. Appl. Math. 43, 565 ~1983!. @2# C. Nicolis and G. Nicolis, Tellus 33, 225 ~1981!. @3# The term stochastic resonance has been used before in a different context, e.g., for the intermittent large amplitude peaks caused by constructive multiple scattering in 1D random wave propagation. @4# P. Jung, Phys. Rep. 234, 175 ~1993!. @5# F. Moss, Stochastic Resonance: From Ice Ages to the Monkey’s Ear, in Contemporary Problems in Statistical Physics, edited by G. H. Weiss ~SIAM, Philadelphia 1994!, pp. 205– 253. @6# Proceedings of the NATO ARW on Stochastic Resonance in Physics and Biology, edited by F. Moss, A. Bulsara, and M. F. Shlesinger @J. Stat. Phys. 70, 1 ~1993!#. @7# International Workshop on Fluctuations in Physics and Biol-
ogy: Stochastic Resonance, Signal Processing and Related Phenomena, edited by A. Bulsara, S. Chillemi, L. Kiss, P. V. E. McClintock, R. Mannella, F. Marchesoni, G. Nicolis, and K. Wiesenfeld @Nuovo Cimento D 17, 653 ~1995!#. S. Fauve and F. Heslot, Phys. Lett. 97A, 5 ~1983!. B. McNamara, K. Wiesenfeld, and R. Roy, Phys. Rev. Lett. 60, 2626 ~1988!. P. Jung and P. Ha¨nggi, Phys. Rev. A 44, 8032 ~1991!. R. F. Fox and Y. Lu, Phys. Rev. E 48, 3390 ~1993!. L. Gammaitoni, F. Marchesoni, E. Menichella-Saetta, and S. Santucci, Phys. Rev. Lett. 62, 349 ~1989!. T. Zhou, F. Moss, and P. Jung, Phys. Rev. A 42, 3161 ~1990!. A. Bulsara, T. C. Elston, C. R. Doering, S. B. Lowen, and K. Lindenberg, Phys. Rev. E 53, 3958 ~1996!. L. Gammaitoni, F. Marchesoni, and S. Santucci, Phys. Rev. Lett. 74, 1052 ~1995!. R. Lo¨fstedt and S. N. Coppersmith, Phys. Rev. Lett. 72, 1947 ~1994!; Phys. Rev. E 49, 4821 ~1994!.
@8# @9# @10# @11# @12# @13# @14# @15# @16#
6344
MEE H. CHOI, R. F. FOX, AND P. JUNG
@17# H. Kramers, Physica ~Utrecht! 7, 284 ~1940!. @18# Since the spectral density of the undriven process is defined on the whole frequency axis, the weights of both spikes in the power spectrum at 6V have to be added, yielding the factor of 2.
57
@19# Careful analysis of SR in terms of information gain @20# has shown that the information gain is not maximized at the noise strength where SNR assumes a maximum but rather at D 0 . @20# L. Schimansky-Geier ~private communications!.