Quantifying System Vulnerability as a Performance Measure for Systems Investment Evaluation and Decision-making S. Labi1 , I. Kumar1 , A. Ahmed1 , P. Anastasopoulos 1. School of Civil Engineering, Purdue University, 550 Stadium Mall Drive, W. Lafayette, IN 47907 1 PH (765)494-5926, email:
[email protected] 1 PH (765) 494-7011, email:
[email protected] 1 PH (765)494-2206, email:
[email protected] 1 PH (765) 494-7011, email:
[email protected] ABSTRACT Civil engineering systems are vulnerable to natural and man-made threats. In recent years, agencies are paying increased attention to investments that are geared towards reducing system vulnerability. For purposes of analyzing the effectiveness of such investments and also for vulnerability monitoring, a procedure is nee ded to quantify the level of system vulnerability at any time. This paper identifies vulnerability types and presents a general procedure for establishing the overall level of vulnerability of a system. The procedure quantitative ly assesses the threat likelihood and consequence. The paper expresses threat likelihood as a function of the system environment (threat type); and consequence, as a function of the system attributes. Specifically, the consequence of failure due to the threat is evaluated on the basis of possible failure modes and the extent of public exposure in the event of failure. Public exposure, which is a function of the occupancy (or traffic) and the class of the system, reflects the effect of system failure on users and the surrounding community. INTRODUCTION Civil engineering systems are vulnerable to natural and man-made threats that arise from the environment in which the y are located. Natural threats include floods, landslides, earthquakes, and hurricanes; man-made threats include overloading due to excessive traffic or occupancy, and accidental or malicious collisions between man-made objects (such as land, sea, or airborne vehicles) and the structure. In recent years, agencies are paying increased attention to continuous monitoring of imminent threats and also to evaluating and implementing investments that reduce system vulnerability. The highly-publicized disaster events such as the 1994 Northridge Earthquake, the 2005 Hurricanes Katrina and Rita, and the 2007 I-35W Mississippi River bridge collapse, all underscored the vital importance of monitoring the vulnerability to civil engineering systems to external or internal threats and to assess the effectiveness of actions intended to reduce their vulnerability to such disaster events. The looming specter of global warming (IPCC, 1994) and the subsequent change in sea and groundwater levels, wind speeds, and other environmental changes are expected to cause potentially widespread and deleterious impact on civil structures (ASCE, 2007; Lenkei, 2007) and thus poses another natural threat that engineers will need to contend with. At the current time, however, there are few or no consistent and objective methodologies that civil engineers can use to assess, and hence constantly monitor, the vulnerability of their systems, and thus agencies continue to seek such methodologies irrespective of civil system type and the nature of the threat. It is also envisaged that any such methodology could also be used to analyze the effectiveness of investments that directly or indirectly address vulnerability. This paper presents a vulnerability rating procedure synthesized from various procedures from the literature and based on the likelihood and consequence of a threat. The threat likelihood, assessed on the basis of threat type, and is a function of the system environment and not of the facility itself. The threat consequence, or impact of failure, is based on the possible failure scope and the extent to which the facility is exposed to the threat – both of these are specific to the facility in question and not to the threat type. The exposure to the threat is a measure of the effect that a failure of the facility will have on its users – this is related to the occupancy of traffic volume of the facility and the importance of the facility in the area socio-economic development or national defense.
REVIEW OF EXISTING LITERATURE The essential elements of risk assessment (Ezell et al. 2000) are consistent with systems vulnerability analysis: what could go wrong, what is the likelihood that it will go wrong, and what are the consequences? With regard to what could go wrong, a number of studies have identified or quantified the types of threats to civil systems. These threats, which are related to environmental factors or to system characteristics (Hawk, 2003), include hydraulic factors, overload, steel or concrete structural details, collision, and earthquake, condition-related reduction in load capacity (Shirole and Loftus, 1992; Kuprenas et al., 1998; Stein et al., 1999); Small, 1999; Monti and Nistico (2002). Some of these studies developed methods to assess civil structure vulnerability and to select those in need of improvement to guard against imminent threats. Vulnerability assessments have also being carried out in other disciplines besides civil engineering, and offer valuable lessons. Luers et al. (2003) developed a framework to assess the vulnerability of agricultural systems in Mexico’s Yaqui Valley. Phillips and Swiler (1998) presented a flexible graph-based approach to security network vulnerability analysis, and used probability theor y and various graph algorithms to identify attack paths that have maximum probability of success. Eakin and Luers (2006) investigated the vulnerability of social-environmenta l systems, and Moy et al. (1986) investigated the reliability in water supply reservoir operation by exploring system vulnerability and system resilience. Ezell (2007) presented a model for quantifying the vulnerability of critical infrastructure, using vulnerability density functions derived from value functions and weights. DESCRIPTION OF THREAT TYPES Flooding Throughout the course of history, increases in the levels of rivers, lakes, and the ocean levels have threatened the stability or functionality of civil structures and facilities located near these features. These facilities include not only riverports, harbors and seaports, but also highways and hydraulic structures such as levees, weirs, and dams. The rise in water levels may be a cyclical or random event (during hurricanes and offshore-epicentered earthquakes) or part of a long-term global warming trend that is causing the polar ice caps to melt and thus increase in sea water levels. IPCC (2007) reported that since 1961, global average sea level had risen at an average rate of 1.3-2.3 mm/yr; between 1993 and 2003, the rate increased above the previous period to 2.4-3.8 mm/yr. Erosion, Scour, and Sedimentation The foundations of c ivil engineering structures foundered or situated near water bodies or at areas of strong wind are vulnerable to erosive forces of water and wind. Also affected are hydraulic and other civil structures downstream where sedimentation of eroded material impairs hydraulic and other functional efficiencies. Features of the environment that increase such vulnerability include the type and nature of the water body (river, lake, or sea) and the erodibility of the residual soils. In the case of rivers, important factors include water volume , velocity, river slope, the shape and nature of the river bed. Also, engineers can obtain clues of erosion and sedimentation vulnerability by measuring the proximity to river confluence, whether the system is affected by backwater, historic scour depth, historic maximum flood depth, and the availability of overflow/relief hydraulic structures. In the case of scour vulnerability, the frequency of floating debris and ice are factors, and the vulnerability of foundations of bridges, culverts, and other hydraulic civil structures can be measured on the basis of the existence of scour countermeasures such as, whether the abutment is located at a river bend, angle of inclination, and embankment encroachment. For piers, vulnerability to scour is influenced by the skew-angle, pier/pile bottom below streambed, and pier width, among other considerations. The elements of erosion and scour vulnerability were established by Shirolé and Holt (1991) and Shirolé and Loftus (1992) for bridge structures but could be easily adapted for other civil structures founded near water bodies. In the current era of climate change, it is expected that increased tropical storm frequencies and strengths will cause increased erosion of soil around civil structures and deposition of the eroded material at other civil
structures downstream. These and other similar considerations could be use to derive a measure that describes the existing threat from erosion and scour. Landslides Landslides, geological phenomena that include rock falls, deep failure of slopes and shallow debris flows, occurs due to gravity but is triggered or facilitated by a number of contributing factors such as slope stability. Landslides impair the structural integrity or functional efficiency of civil engineering structures, and have jeopardized safety at highways and bridges at mountainous areas. General long-term changes in general climatic conditions worldwide are expected to translate into increased geotechnical activity such as rockfalls and landslides in mountainous areas, particularly due to increased rates of groundwater seepage through rock joints and increased groundwater pressure (Beniston, 2004). Also, the trigger mechanisms for landslides are associated with pressure-release joints following glaciations. In assessing the vulnerability of civil syste ms to landslides, it is needed to address slope instabilities. Fatigue Failure of Concrete Structures Concrete is a primary material type used for civil structures, but is prone to a variety of failure modes, the most surreptitious of which is fatigue. Fatigue, a progressive and localized structural damage, occurs when a material is subjected to repeated loading and unloading , and structural element fatigue failure often occurs with little or no warning. NYSDOT (1997) provided a methodology for assessing the fatigue failure of concrete and steel bridges. With some modification, this could be extended to other types of civil structures. For bridges, this procedure consists of evaluating the superstructure, the substructure and a general assessment of the entire structure. Superstructure assessment considerations include skew, curvature, redundancy, flagging history, deterioration of beams, reinforcement corrosion, concrete deterioration, unreinforced concrete members , deflection conditions , prestressed concrete members, and post-tensioned concrete members. Substructure assessment includes elements such as deterioration of components, stress related cracking at joints , stress related condition of pier capbeams cracking due to differential settlement, punching shear condition, hammerhead pier, solid pier, concrete rigid frame, pier bents with concrete piles , concrete pier caps. General assessment includes bridge location, year of construction, wearing surface condition ratings, debris accumulation on concrete. Fatigue Failure of Steel Structures Like concrete structures, steel structural elements are prone to sudden failure due to material fatigue. The procedure to assess the steel-detail vulnerability class consists of evaluating the superstructure and the substructure (NYSDOT, 1999). The vulnerability of steel structural components is assessed on the basis of three elements: (i) primary member (redundancy, fatigue resistance , occupancy level and fatigue design, material toughness, distortion-induced cracking, truss, (ii) external connections (that is whether the connection type is bearing, framed, or suspended or hinged support), (iii) accumulated damage (ever flagged, reason flagged, painted steel, deterioration factors, condition rating factors). Seismic Events Earthquakes are caused by rupture of geological faults, volcanic activity, and nuclear tests . A fifth of the half-million earthquakes that occur worldwide each year, can be felt and a fraction of these are severe enough to pose a threat to civil infrastr ucture. The failure of structures during seismic events is due to: ground shaking and rupture; local amplification of movement due to transfer of seismic energy from deep harder deep soils to superficial softer soils; and ground rupture which is a visible break and displacement of the Earth’s surface along the trace of the fault. The vulnerability of a structure to earthquake damage or failure can be assessed as the product of the structural vulnerability and seismic hazard rating for the location of the structure (NYSDOT, 2002). The structural vulnerability is based on
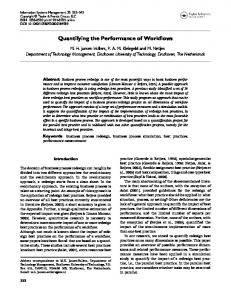
(i) the vulnerability of connections, bearings and seat widths (which considers the bearing types, support lengths, support skew), the pier vulnerability (which considers the pier design, and shear failure), and flexural failure), (iii) abutment vulnerability, and (iv) liquefaction vulnerability. The seismic hazard rating (E) is a function of design seismic acceleration coefficient and also soil profile type to allow for soil amplification effects. Collision Civil engineering structures are always prone to accidental damage from its users or nearby activity. Such vulnerability is influenced by the type of occupancy (traffic), nature of occupancy (example, for traffic, number of large trucks and their average speeds), height of the structure, location (for example, in a navigation channel), etc. For bridge structures, the NYSDOT (1996b) developed a collision vulnerability rating that is based on superstructure vulnerability to truck under bridge collision, pier vulnerability to truck under bridge collision, superstructure vulnerability to water vessel collision, pier vulnerability to water vessel collision, superstructure vulnerability to train under bridge collision, and pier vulnerability to train under bridge collision. Man-made Threats The vulnerability of a civil engineering system to malicious man-made threats could be assessed on the basis of a number of criteria including: c ommerce (average and maximum daily truck traffic), detour length, contribution of the facility to overall system operations (such as overall network connectivity or accessibility), navigational access, international access (whether the facility borders on a neighboring country), and designation of the facility in military operations or movement. Rummel et al. (2002) developed a similar set of criteria to develop a criticality index for assessing the vulnerability of bridge structures specifically to man-made threats. Other Threats Other threats to civil systems include high wind speed, wind impulses, and variations in wind profile (Lenkei, 2007): these can render tall buildings vulnerable to unsafe occupancy. Occupancy overload can be considered a man-made threat. The overload vulnerability of a civil structure can be measured on the basis of load expectancy (the likelihood that a load heavy enough to cause a failure will ever use the facility), structural capacity, resistance (capacity of a structure to resist applied loads), and condition (the effect of structural deterioration based on condition ratings) (NYSDOT 1996c). Also, the stability of the foundations of existing structures can be threatened by cyclical variations or long-term increases in subsoil pore water pressures due to rises in sea level or local groundwater level. For example, at certain locations and circumstances, the water table could be increased due to deglaciation resulting from water accumulation behind unstable moraines of isolated blocks of ice that broke off from the leading edges of retreating glaciers (Beniston, 2004). A GENERALIZED PROCEDURE TO QUANTIFY SYSTEM VULNERABILITY Figure 1 presents a general procedure followed for various types of vulnerability assessments like erosion, scour, fatigue/fracture, earthquake, and collision. The procedure to assign a vulnerability class is specific to the type of vulnerability which is discussed in subsequent sections. Table 1 presents guidelines on assigning scores to arrive at a vulnerability score. Step 1. Computation of Vulnerability Likelihood Level For a given facility, the vulnerability likelihood level is generally independent of the facility type and rather depends on the environment: the greater the threat from the environment, generally, the higher the likelihood level. Thus, generally, the vulnerability likelihood level, L, can be expressed as a function of the vulnerability, E, as follows:
L = f L(E) …………………………………………………………………………… (1) f L(E) could be obtained using direct assignment of scores by experts (as done by the New York State DOT in its vulnerability manuals) or utility functions. A more objective measurement of f L(E) could be the use of geographical maps that indicate the variation of the threat level at each location (See Appendix). L EVEL OF FACILITY VULNERABILITY TO T HREAT (Specific to Threat Type)
FAILURE SCOPE
LEVEL OF THREAT LIKELIHOOD
(Specific to Vulnerability Type) Table 1A
LEVEL OF EXPOSURE TO THREATS (TABLE 1B)
OCCUPANCY/TRAFFIC
OVERALL RATING OF FACILITY VULNERABILITY
LEVEL OF THREAT CONSEQUENCE
Table 1B.1
FACILITY CLASS Table 1B.2
FIGURE 1 Procedure for Rating the Vulnerability of Civil Systems Step 2. Computation of Vulnerability Consequence Level Unlike the vulnerability likelihood, the vulnerability consequence is specific to the civil engineering facility and not the threat. The vulnerability consequence is a function of the exposure of the facility to the threat and the domain of possible failure scopes of the facility, as discussed herein. (a) Exposure Level For any given facility, the vulnerability exposure level is defined as a function of the occupancy (or traffic volume) and facility class (or, level of importance) follows: EL = f EL(O, C) …………………………………………………………………… (2) O and C can be determined from f O(γi) and f FC(π i), respectively. Examples of Equation (2) include: EL = Φ1 Oα + Φ2 Cβ …………………………………………………………… (3) α β EL = χ1O * χ2C …………………………………………………………………… (4) The New York State DOT, in its vulnerability rating procedure (NYSDOT, 2002-2006) used the simple weighted linear additive form by setting Φ 1 = Φ2 = 1, and α = β = 1. Thus, in that state’s procedure, Vulnerability Exposure Level = Occupancy Score + Facility Class Score. (b) Consequence Level For any given facility, the vulnerability consequence level is defined as a function of the exposure level and failure scope as follows: C = f C(EL, FS) …………………………………………………………………… (5) The failure scope, FS, can be determined from f FS(δi). Examples of Equation (5) include: C = Ω1ELω + Ω2 FS ν …………………………………………………………… (6) C = Ψ1ELω * Ψ2FS ν …………………………………………………………… (7) For example, in the New York State DOT, the vulnerability rating procedure (NYSDOT, 20022006) uses a simple weighted linear additive form by setting Ω1 = Ψ2 = 1, and ω = ν = 1. Thus, in that state’s procedure, Vulnerability Consequence = exposure level + failure scope.
TABLE 1 Facility-Specific Vulnerability Parameters FAILURE SCOPE
A. Failure Scope (Possible Failure Mode)
Failure Scope, FS Level 1, Catastrophic (δ1) Level 2, Partial Collapse (δ2) … Level NFT , Light structural damage (δ N,FS )
Failure Type Level f FS(δ1) f FS(δ2) f FS (δN,FS)
LEVEL OF EXPOSURE
B.1 Occupancy Or Traffic
\ B.2 Facility Class (Level of Importance)
Occupancy, O Level 1, High occupancy, (γ1) Level 2, Medium occupancy, (γ2) … Level NOT , Low occupancy (γN,O) Facility Class, C Level 1, Highest Class (π 1) Level 2, Mid-upper Class (π 2) … Level NC , Lowest Class (π N,C)
Occupancy Level f EL(γ1) f EL(γ2) f EL(γN,O) Class Level f FC(π 1) f FC(π 2) f FC(π N,C)
Adapted from (NYSDOT, 1992-1997)
Step 3. Computation of Overall Vulnerability Rating of the Facility For each vulnerability type, a vulnerability rating level, VR, is defined as a function of the likelihood level (L) and consequence level (C) as follows: VR = f VR(L, C) …………………………………………………………………… (8) Examples of this function could include: VR = Λ1 Lη + Λ2 Cτ …………………………………………………………… (9) VR = Θ1 Lη * Θ2 Cτ ……………………………………………………………. (10) The New York State DOT, in its vulnerability rating procedure (NYSDOT, 2002-2006) used the simple weighted linear additive form by setting Λ1 = Θ 2 = 1, and η = τ = 1. Thus, in that state’s procedure: Vulnerability Rating = Likelihood Score + Consequence Score. In general, vulnerability rating can calculated using the appropriate functional for Equation (8), scaled on a 0-100 scale, and then interpreted in Step 4. Step 4. Interpretation of the Overall Vulnerability Rating Figure 2 and Table 2 provides a possible interpretation of the overall vulnerability rating calculated using the above procedure. In Figure 2, the boundaries between the vulnerability descriptions are based on expert judgments. The authors of this paper are currently carrying out research to determine the appropriate boundaries using more objective techniques. VULNERABILITY DESCRIPTIONS V ERY L OW
L OW
V ULNERABILITY
V ULNERABILITY
0
10
20
L OW -TO-MEDIUM V ULNERABILITY
MEDIUM -TO-HIGH
V ULNERABILITY
40 30 50 60 70 VULNERABILITY LEVEL (CONTINUOUS SCALE) FIGURE 2 Scale for Vulnerability Interpretation
HIGH V ULNERABILITY
80
V ERY HIGH V ULNERABILITY
90
100
TABLE 2: Interpretation of 0-100 Vulnerability Rating Vulnerability Interpretation Rating 0-9.9 Designates that there is no exposure to a specific type of vulnerability. 10-29.9 Designates a vulnerability to failure which is less than or equal to the vulnerability of a pavement built to the current design standards. Likelihood of failure is remote. 30-49.9 Designates a vulnerability to failure presenting minimal risk providing that anticipated conditions do not change. Unexpected failure can be avoided during the remaining service life of the pavement by performing standard scheduled inspections with attentions to factors influencing the vulnerability. 50-69.9 Designates a vulnerability to failure resulting from events that are possible but not likely. This risk can be tolerated until a normal capital project can be implemented. 70-89.9 Designates a vulnerability to failure resulting from events that may occur. Actions to reduce the vulnerability is not an immediate priority but may be needed in near future. 90-100 Designates a vulnerability to failure resulting from events that are likely to occur. Remedial work to reduce the vulnerability is an immediate priority. Adapted from NYSDOT (1992-1997) and O’Connor (2000).
CONCLUSION Civil engineers always face the challenge of protecting their systems from natural or man-made threats. This challenge has gained prominence in recent years and civil systems agencies are increasing the levels of investments to reduce system vulnerability or to enhance system resilience to disasters. Often, there is a need to ascertain the feasibility of such investments or to evaluate and co mpare alternative investment options, and thus a systematic procedure is needed to quantify the level of system vulnerability before and after investment actions. This paper identifies a number of threat types and presents a general procedure for establishing system vulnerability to these threats. The procedure assesses the threat likelihood and consequence quantitatively. The threat likelihood is a function of the system environment (threat type); and threat consequence is a function of the system attributes. The consequence of system failure due to the threat is described on the basis of possible failure modes and the extent of public exposure to the event. The exposure, in turn, is a function of the system occupancy (or traffic) and the importance (class) of the system to the society; this reflects the effect of system failure on users and the surrounding community. REFERENCES ASCE (2007). Impact of Global Climate Change, ASCE Policy Statement 360, Energy, Environment, and Water Policy Committee of ASCE, Reston, VA. Beniston, M. (2004). Climatic Change and its Impacts, Springer. Eakin, H., Luers, A.L. (2006). Assessing the Vulnerability of Social-Environmental Systems. Annual Review of Environment and Resources, 31, 365-394. Ezell, B.C., Farr, J.V., Wiese, I. (2000). Infrastructure Risk Analysis Model. ASCE Journal of Infrastructure Systems, Vol. 6, No. 3, pp. 114-117. Ezell, B.C. (2007). Infrastructure Vulnerability Assessment Model, Risk Analysis, 27(3), 571-583. Hawk, H. (2003). NCHRP Report 483: Bridge Life-Cycle Cost Analysis, Transp. Research Board. IPCC (1994) Climate Change. Cambridge University Press, Cambridge. IPCC (2007). Climate Change 2007: The Physical Science Basis. Contribution of Working Group I to the Fourth Assessment Report of the I ntergovernmental Panel on Climate Change, Solomon, S. et al. (eds.). Cambridge University Press, Cambridge, U.K. Kuprenas, J. A., Madjidi, F., Vidaurrazaga, A, Lim, C. L. (1998). Seismic Retrofit Program for Los
Angeles Bridges. ASCE Journal of Infrastructure Systems, Vol. 4, No. 4, pp. 185-191. Lenkei,P. (2007). Climate change and structural engineering. Periodica Polytechnica. P. 47-50. Luers, A.L., Lobell, D.B., Sklar, L.S., Addams, C.L., Matson, P.A. (2003). A method for quantifying vulnerability, applied to the agricultural system of the Yaqui Valley, Mexico. Global Environmental Change, 13(4), 255-267. Moy, W.-S., Cohon, J.L., ReVelle, C.S. (1986). A Programming Model for Analysis of the Reliability, Resilience, and Vulnerability of a Water Supply Reservoir. Water Res. Res. 22(4), 489-498. NYSDOT (1996-2002). Vulnerability Manuals, Dept. of Transp., Albany, NY. Monti, G. and Nistico, N. (2002). Simple Probability-based Assessment of Bridges under Scenario Earthquakes. ASCE Journal of Bridge Engineering, Vol. 7, No. 2, pp. 104-114. Phillips, C., Swiler, L.P., 1998. A graph-based system for network-vulnerability analysis. Proceedings of the New Security Paradigms Workshop, 22-25 September 1998, doi>10.1145/310889.310919. Rummel, T., Hyzak, M., Ralls, M. L. (2002). Transportation Security Activities in Texas. International Bridge Conference. Shirole, A. M., Loftus, M. J. (1992). Assessment of Bridge Vulnerability to Hydraulic Failures. Transportation Research Record 1347, pp. 18-24. Shirole, A. (1995). Seismic Vulnerability Evaluation of New York State Bridges, presented to America Society Civil Engineers, Structures Congress, Boston, Massachusetts. Shirole, A., Holt, R.C. (1991). P lanning for a Comprehensive Bridge Safety Assurance Program, Transportation Research Record 1290, pp. 39–50. Small, E. P. (1999). Examination of Alternative Strategies for Integration of Seismic Risk Considerations in Bridge Management Systems. 8th International Bridge Management Conference. Sivakumar, B., Minervino C, M., Edberg, W. (2003). New Bridge Performance Measures for Prioritizing Bridges, Procs., 9th International Bridge Management Conf., Orlando, FL. Stein, S. M., Young, G. K., Trent, R. E. Pearson, D. R. (1999). Prioritizing Scour Vulnerable Bridges Using Risk. Journal of Infrastructure Systems, Vol. 5, No. 3, pp. 95-101. APPENDIX: Landslide Incidence & Susceptibility, and Earthquake History, Indiana & Surrounding Areas