INSTITUTE OF PHYSICS PUBLISHING
PHYSICS IN MEDICINE AND BIOLOGY
Phys. Med. Biol. 47 (2002) 3519–3534
PII: S0031-9155(02)37748-0
Quantitative imaging and correction for cascade gamma radiation of 76Br with 2D and 3D PET Mark Lubberink1,2, Harald Schneider2, Mats Bergstr¨om2 and Hans Lundqvist1 1
Section of Biomedical Radiation Sciences, Rudbeck Laboratory, Uppsala University, 751 85 Uppsala, Sweden 2 Uppsala Research Imaging Solutions AB/Uppsala University PET Centre, University Hospital, 751 85 Uppsala, Sweden E-mail:
[email protected]
Received 7 June 2002, in final form 30 July 2002 Published 18 September 2002 Online at stacks.iop.org/PMB/47/3519 Abstract Several positron emitting nuclides with applications in PET, such as 76Br, 124 110m I, In and 86Y, also emit gamma radiation in their decays. Measured coincidences between annihilation photons and this cascade gamma radiation are essentially true coincidences and the standard PET corrections do not account for them. We investigated the performance of 76Br in 2D and 3D PET, the effect of the gamma radiation emitted by 76Br on quantitative accuracy and the distribution of cascade gamma radiation coincidences in 2D and 3D PET sinograms. A correction method for cascade gamma radiation coincidences was implemented and evaluated. Count rate linearity was affected by the gamma radiation from the 76Br decay. Spatial resolution and sphere recovery were slightly worse for 76Br compared to 18F. Correction for cascade gamma radiation coincidences by subtraction of a linear projection tail fit improved total correction accuracy to similar values as for positron-only emitters such as 18 F, and improved image contrast significantly.
1. Introduction A number of positron emitters besides the commonly used 18F, 11C, 15O, 15N or 82Rb have in recent years found an application in PET. 76Br was used in studies of monoclonal antibody kinetics (L¨ovqvist et al 1999), which requires a radionuclide with a longer half-life than the standard PET nuclides, and in brain studies (Ribeiro et al 1999). 124I (Pentlow et al 1991) and 66Ga (Graham et al 1997) were used for similar purposes. Positron emitting analogues of therapeutic nuclides, such as 86Y (Herzog et al 1993), 110mIn (Lubberink et al 2002), 83Sr (Lundqvist et al 1999, R¨osch et al 1996) and also 124I (Flower et al 1994) have been suggested for improved dosimetry of radionuclide therapy with 90Y, 111In, 89Sr and 131I, respectively. 0031-9155/02/193519+16$30.00
© 2002 IOP Publishing Ltd Printed in the UK
3519
3520
M Lubberink et al
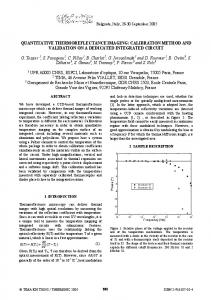
Figure 1. From left to right: random coincidences, coincidences of scattered photons and coincidences involving cascade gamma radiation.
Figure 2. Simplified decay scheme of 76Br (t1/2 = 16.2 h), showing positrons and gamma radiation with abundances over 5%. From Lo¨ vqvist et al (1999), with data from Chu et al (1999).
The iron isotope 52Fe has been used in, for example, studies of anaemia (Beshara et al 1999). Several copper isotopes, among them 60Cu (Martin et al 1995), have also been suggested for use with PET. All of these nuclides emit gamma radiation in cascade with positrons. Detection of essentially true coincidences of these gamma with each other or with annihilation photons introduces a bias in the images which is not corrected for by the standard PET corrections (Martin et al 1995, Kohlmyer et al 1999, Lubberink et al 1999, Pentlow et al 2000, Herzog et al 2002), see also figure 1. This effect is probably largest for 86Y, 76Br, 52m Mn and 110mIn. These nuclides emit a large amount of gamma radiation with energies over 300 keV, 309%, 198%, 100% and 98% per decay, respectively, compared to 33%, 54%, 97% and 62% positrons. In 26% of all 76Br decays a positron is emitted simultaneously with one 559 keV gamma, and in 22% of the decays a positron is emitted in cascade with more than one gamma among which in most cases the same 559 keV gamma, a 657 keV gamma or a 563 keV gamma (figure 2). High-energy gamma emitted by 76Br or 86Y can also give pair production (Kohlmyer et al 1999) but this has a low probability. Apart from an increased image background, the increased singles rate due to the gamma radiation may also lead to inaccurate dead time correction (Martin et al 1995). Recently, two other publications compared PET with 18F and 76Br, mainly focusing on the higher positron energies and resulting degradation of resolution (L¨ovqvist et al 1999,
Quantitative imaging of 76Br with 2D and 3D PET
3521
Ribeiro et al 1999). The observed loss of contrast for 76Br compared to 18F was contributed to positron range (Ribeiro et al 2000). We previously reported results of 2D PET measurements with 76Br showing that the distribution of cascade gamma radiation coincidences is reasonably uniform (Lubberink et al 1999), and two other groups also suggested a correction for cascade gamma radiation from 86Y in 2D PET by subtraction of a uniform background (Pentlow et al 2000), a linear fit to the projection tails (Kohlmyer et al 1999) or a convolution subtraction technique (Beattie et al 2001). The aim of this work was to study the performance of 2D and 3D PET with 76Br and to implement and study the effects of a correction for cascade gamma coincidences. Measurements of correction accuracy, resolution, recovery, contrast, count rate performance, uniformity and influence of radioactivity outside the field of view (FOV) are presented.
2. Materials and methods 2.1. Tomographs Measurements were made using an ECAT Exact HR+ (CTI/Siemens, Knoxville) tomograph (Adam et al 1997, Brix et al 1997) and in some cases also with a Scanditronix/GEMS 4096 + WB (Scanditronix AB, Uppsala, Sweden) tomograph (Rota Kops et al 1990). The HR+ system has retractable tungsten septa (thickness 0.8 mm, length 66.5 mm), whereas the 4096 has non-removable lead septa (thickness 3 mm, length 195 mm). These larger septa make the 4096 system much less sensitive to radiation reaching its detectors at oblique angles, and thus for scatter, randoms and gamma radiation. The measurements with the 4096 system will only be discussed when there is a considerable difference in methods or results compared to the HR+ measurements. Standard corrections for scattered radiation were used: convolution subtraction (Bergstr¨om et al 1983) in 2D mode for both scanners, and a simulation-based method for the HR+ in 3D mode (Watson et al 1997). Attenuation correction was either made analytically or based on a transmission scan.
2.2. Correction for cascade gamma radiation coincidences The aim of a cascade gamma coincidence correction is to subtract all cascade gamma coincidences, in order to provide a ‘proper’ sinogram for further corrections and reconstruction. An important advantage of this approach, as opposed to including correction for cascade gamma coincidences in a scatter correction, is that no nuclide-specific corrections are required. Two methods have been suggested: projection tail fit subtraction method, using either a linear fit (Kohlmyer et al 1999) or a uniform background (Lubberink et al 1999, Pentlow et al 2000) or a convolution subtraction correction (Beattie et al 2001). These methods were suggested for General Electric Advance and 4096 WB scanners (General Electric Medical Systems, Milwaukee) in 2D mode. Here, we implemented a correction that subtracts all counts under a linear fit between the outermost elements at each projection tail of the uncorrected projections. Based on the fact that the outermost HR+ projection elements are not zero even for 18F, as seen in the phantom measurements in the next paragraph, the cascade gamma coincidence background in the outermost projection elements was assumed to be 80% of the measured counts in 3D mode, and 90% in 2D mode. In short, the five outermost projection elements at both tails are multiplied by 0.8 (3D) or 0.9 (2D), and the cascade gamma contribution is determined by a linear fit to these outermost projection elements. Subsequently, all counts under this linear fit
3522
M Lubberink et al
are subtracted from the projection. In the case of the 4096 scanner, all counts in the outermost projection elements were assumed to be cascade gamma radiation coincidences. 2.3. Scatter, attenuation and cascade gamma correction accuracy The NEMA phantom (Karp et al 1991) was filled with approximately 40 MBq of 76Br or 18F and placed centrally in the FOV. This 20 cm diameter, 18.5 cm long fillable cylinder contains cold 5 cm diameter cylindrical water, air and Teflon inserts positioned at 6 cm from the phantom axis in 120◦ increments. A series of six 10 min emission scans was made both in 2D and in 3D acquisition mode, followed by a 10 min hot (i.e. in the presence of radioactivity in the phantom) transmission scan. The 4096 hot transmission scan was corrected for emission counts by subtraction of a short emission scan. Approximately 20 h after the 18F measurement a second, cold (i.e. without radioactivity in the phantom), transmission scan was made to assess the effect of the radioactivity in the phantom on correction accuracy. Images were reconstructed using the standard corrections, including scatter and attenuation correction, and cascade gamma correction. The correction error in each insert was determined by dividing the measured radioactivity concentration in a 3 cm diameter volume of interest (VOI) in that insert by the radioactivity concentration in four similar VOIs in the radioactive solution. To calculate the relative number of cascade gamma coincidences, the 18F projections were scaled by the total counts inside the phantom relative to the total counts inside the 76Br phantom, determined by subtraction of a background calculated by linear interpolation of projection elements just outside the phantom. The number of cascade gamma coincidences in the scaled 76Br sinogram was determined by subtraction of a scaled 18F sinogram from the 76 Br sinogram. 2.4. Spatial resolution Transaxial resolution was measured using a 1 mm inner diameter catheter crossing a 5 × 20 × 45 cm polyethylene block, placed centrally in the FOV of the camera, at 0, 5, 10 and 20 cm from the centre of the block. The catheter was filled with 10–20 MBq of 76Br or 18F and a 15 min emission scan was made. Attenuation correction was based on a 10 min cold transmission scan. Images were reconstructed with a pixel size of 1.03 mm (HR+) or 2 mm (4096). Spatial resolution, as full width at half maximum (FWHM) and tenth maximum (FWTM) of the point spread function, was calculated by linear interpolation between points in a horizontal and vertical profile through the peak maximum. 2.5. Recovery A phantom containing spheres with diameters ranging from 10 mm to 38 mm was filled with water. To ensure a similar radioactivity concentration in each sphere, approximately 50 MBq of 76Br or 18F was diluted in 100 ml water and all spheres were filled from this solution. Fifteen-minute 2D and 3D emission scans were made, on the HR+ acquiring approximately 20 million (2D) or 100 million (3D) gross trues per slice in the slices containing the spheres. For the 4096 scanner, on which the phantom can be mounted in a fixed position, a cold transmission scan was done before the start of the measurement. For the HR+, analytical attenuation correction based on a definition of an ellipse was applied. This gives a small error because of the presence of the patient bed, but attenuation correction based on a hot transmission scan leads to severe image artefacts in this case. Images were reconstructed to a pixel size of 1.03 mm (HR+) or 1 mm (4096). Hot-spot recovery coefficients (HSR) for
Quantitative imaging of 76Br with 2D and 3D PET
3523
each sphere were calculated by dividing the radioactivity concentration in a region of interest (ROI) with the same diameter as the spatial resolution in that sphere by the radioactivity concentration in a similar ROI in the largest sphere. This is a somewhat simplified procedure compared to the IEC guidelines (Adam et al 1997). Alternatively, 1 cm diameter ROIs and half-maximum ROIs, drawn at 50% of the maximum radioactivity concentration, were used. The area of these last ROIs was compared to the true sphere size to assess the accuracy of size prediction using a half-maximum ROI. In a measurement with the same phantom, the spheres were filled with cold water and the rest of the phantom with circa 40 MBq of 76Br or 18F. This measurement was not done on the 4096 system. Emission scans in 2D and 3D modes were made, acquiring 2 × 10⁹ gross trues to ensure similar image statistics as in the hot spot recovery measurements, and in the reconstruction analytical attenuation correction and cascade gamma coincidence corrections were applied. Again, analytical attenuation correction leads to a small error because of the presence of the patient bed, but a hot transmission could not be used because the spheres were clearly visible in the attenuation image, even after segmentation using the method included in the HR+ software. Images were reconstructed to a pixel size of 1.03 mm. Cold-spot recovery coefficients (CSR) were calculated by division of the mean of the measured radioactivity concentrations in spatial resolution sized ROIs in three image planes through each sphere by the mean of the radioactivity concentration measured in 15 cm diameter ROIs in five image planes not containing the spheres. 2.6. Contrast The effect of cascade gamma coincidence correction on image contrast was evaluated assuming that the measured radioactivity concentration in a sphere is determined by the following equation: As,m = HSR · As,t + CSR · Ab,m
(1)
where A is radioactivity concentration and the indices s, b, t and m indicate sphere, background, true and measured. HSR and CSR are hot-spot and cold-spot recovery coefficients. This is based on a linear system performance, which assumes accurate attenuation and scatter correction (Geworski et al 2000). Measured sphere-to-background ratio (As,m /Ab,m ) as a function of the actual radioactivity concentration ratio As,t /Ab,t in each sphere is then, assuming that all data are properly corrected, calculated as As,t 1 As,m = · HSR · + CSR. (2) Ab,m g Ab,t This value can also be seen as a measure of contrast. The factor g indicates the overestimation of measured radioactivity caused by cascade gamma radiation coincidences. This factor was determined by division of the mean radioactivity concentration in a 15 cm diameter VOI in five slices, not containing the spheres, in an image that was not corrected for cascade gamma radiation by the same concentration in a cascade gamma-corrected image. Measured sphere-to-background ratio, or image contrast, as a function of true radioactivity concentration ratio, with and without cascade gamma coincidence correction, was calculated using the equation above for spheres of various sizes and true relative uptakes of 2, 4, 8. For comparison with measured data, the spheres in the sphere phantom were filled with 5 kBq ml−1 of 76Br and the rest of the phantom with 0.75 kBq ml−1 of the same nuclide. The phantom was placed centrally in the FOV and a 15 min emission scan was made both in 2D and 3D modes. Images were reconstructed using the standard corrections, including scatter correction and analytical attenuation correction, and linear tail fit background subtraction to
3524
M Lubberink et al
correct for cascade gamma coincidences. The measured radioactivity concentrations in a spatial resolution size ROI in each sphere and the measured radioactivity in a 15 cm diameter VOI in five planes not containing the spheres were used to calculate image contrast. 2.7. Count rate characteristics 2.7.1. Count rate linearity. A 20 cm diameter cylindrical phantom was filled with circa 150 MBq of 76Br or 11C and placed centrally in the FOV of the scanner. Subsequent emission scans were made in 2D and 3D modes during 4 days and 3 h, respectively. After image reconstruction applying standard corrections, measured radioactivity concentration in a 15 cm diameter VOI in all image planes was plotted versus the true phantom radioactivity concentration. 2.7.2. Noise equivalent count rates. NEC rates (Strother et al 1990) were calculated using the following equation, adapted for gamma radiation emitting nuclides: NEC =
T2 T + f G + S + 2f D
(3)
where T is the scatter and cascade gamma corrected trues count rate, S is the scatter count rate calculated as the NEMA scatter fraction (Brix et al 1997) multiplied with the cascade gamma corrected gross trues count rate, G the cascade gamma radiation coincidences count rate, assumed to be 32% of the gross trues count rate in 2D and 45% in 3D based on the NEMA phantom measurements above, f the average fraction of the projection taken up by the object and D the delayed coincidence, or random, count rate. 2.8. Uniformity Uniformity was only measured for the HR+ scanner. A uniformly filled 20 cm diameter phantom was placed in the centre of the scanner and filled with approximately 40 MBq of 76Br or 18F. Emission scans were made until 100 million true counts were acquired for 18F or 100, 145 or 185 million counts for 76Br, either neglecting cascade gamma coincidences or considering a relative amount of cascade gamma coincidences of 32% (2D) or 45% (3D). This procedure was repeated for a standard torso phantom (width 30 cm, height 23 cm; as in NEMA NU2-2001, Performance measurements of positron emission tomographs). This torso phantom was positioned on the patient bed, covering the whole axial FOV, with its widest point in the vertical centre of the FOV. The phantom contained approximately 50 MBq of either 76 Br or 18F and 2D and 3D emission scans were done acquiring similar numbers of counts as for the cylindrical phantom. Emission measurements were followed by a 10 min transmission scan. Images were reconstructed using the normal corrections, applying a 4 mm Hann filter and analytical attenuation correction for the cylindrical phantom and a 6 mm Gauss filter and segmented attenuation correction for the torso phantom, and the suggested cascade gamma coincidence correction. A total of 33 or 39 2 × 2 cm square ROIs were drawn in each slice in the cylinder and torso phantom image, respectively, and maximum and minimum volume nonuniformities (NU+ and NU−) were calculated as described previously (Karp et al 1991). One 22 × 15 cm ellipse-shaped ROI was drawn in each slice in the torso phantom images and one 15 cm diameter ROI was drawn in each cylinder phantom slice, and the slice non-uniformities and the standard deviation of the mean radioactivity concentration in the VOI combining all these ROIs were calculated.
Quantitative imaging of 76Br with 2D and 3D PET
3525
Table 1. Scatter and attenuation correction errors (%) in water, air and Teflon 18F,
Water Air Teflon
HR + 2D
7.7 10.0 8.6
76Br,
HR + 2D
16.6 6.7 27.9
18F,
HR + 3D
7.7 1.5 16.2
76Br,
HR + 3D
26.9 −3.8 55.8
18F,
4096
1.6 8.1 −2.7
76Br,
4096
5.1 7.5 5.0
Table 2. Residual correction errors (%) for 76Br in water, air and Teflon, after linear tail fit cascade gamma coincidence correction
Water Air Teflon
HR + 2D
HR + 3D
4096
8.3 11.2 10.0
8.1 2.7 14.9
0.9 9.0 −5.8
2.9. Radioactivity outside the FOV The NEMA phantom containing only the cold water insert was filled with circa 40 MBq of 76 Br or 18F and placed central in the FOV on the patient bed of the HR+. A 1 ml source with 0.5 cm thick plexiglass walls, also containing approximately 40 MBq of 76Br or 18F, was positioned at 10 cm from the phantom outside the FOV on the camera axis. Emission scans (10 min) were made both with and without the external source. ROIs (3 cm diameter) were drawn in the radioactive solution and in the insert in the NEMA phantom, and the measured radioactivity concentrations with and without the external phantom were compared. In a second measurement, the same 1 ml source, containing approximately 40 MBq of 76Br or 18F, was placed on the patient bed at 50 cm from the axial FOV and step-wise moved towards the centre of the axial FOV. At each position a 2 min emission scan was done. This was repeated with and without the neuro-insert in place, a lead side shield ring that can be inserted at the entrance of the FOV.
3. Results 3.1. Scatter, attenuation and cascade gamma correction accuracy Total correction accuracy is given in tables 1 and 2. Summation of all six frames before cascade gamma correction and reconstruction did not lead to significantly smaller correction errors. A 1 h transmission measurement, and even a 10 min transmission measurement with new rod sources, performed at a later time, lead to much improved values for 76Br, indicating that the relatively large correction errors in table 2 are mainly the sum of a cascade gamma coincidence contribution and attenuation correction errors caused by a low transmission pin source activity at the time of the measurements. The correction accuracy results are not consistent with the results published by Brix et al (1997), which gave correction errors in water of approximately 0% for 18F in both 2D and 3D modes with this phantom positioned 2.5 cm off-centre. The relative number of cascade gamma coincidence was found to be 45% in 3D mode and 32% in 2D mode for the HR+ scanner. In a similar measurement with the 4096, the cascade gamma fraction was 12%. Figure 3 shows measured projections.
3526
M Lubberink et al
Figure 3. Measured profiles of a uniform cylinder in 2D (left) and 3D modes (right) for 76Br and 18F. Note that the projection tails are not zero even for 18F.
Figure 4. Transverse resolution, FWHM, in polyethylene for 76Br and 18F, using a 4 mm Hann filter, for the HR+ (left) and 4096 (right). Central FWTM values were 16.2 and 11.4 mm for the HR+ and 18.1 and 14.2 mm for the 4096, respectively.
3.2. Spatial resolution Figure 4 shows the spatial resolution in polyethylene. Central HR+ spatial resolution is 8.0 mm (FWTM 16.2 mm) for 76Br, compared to 6.0 mm (FWTM 11.4 mm) for 18F, using a 4 mm Hann filter. Using a similar filter, central transverse resolutions on the 4096 scanner were 9.0 and 7.5 mm for 76Br and 18F, respectively. For a 6 mm Gauss filter, used in HR+ whole body studies at our centre, the corresponding values were 9.5 and 8.0 mm. 3.3. Recovery Hot-spot recovery coefficients are given in figure 5 and predicted sphere sizes using a halfmaximum ROI in figure 6. Obviously 76Br recovery is worse than 18F recovery, although recovery measured using a resolution-sized ROI relative to sphere size is approximately similar. Maximum pixel recovery coefficients could also be used, but are usually very dependent on image statistics. Half-maximum ROIs estimate a sphere diameter that is slightly smaller than the true sphere diameter. Size estimation is as accurate for 76Br as for 18F. Figure 7 shows cold-spot recovery and hot-spot recovery calculated using resolution size ROIs. Using hot-spot recovery coefficients divided by 1.08, to account for the residual correction error for radionuclides that do not emit gamma radiation (see table 1), 1-HSR/1.08 is equal to CSR in 2D mode for spheres larger than 1.5 cm, for 18F and also for 76Br after cascade gamma correction. The HR+ system is apparently not linear either for 18F or for 76Br
Quantitative imaging of 76Br with 2D and 3D PET
3527
Size/resolution
Figure 5. Recovery coefficients (HR+) calculated using a 1 cm ROI and a half maximum ROI (left) and a resolution size ROI (right).
Figure 6. Predicted sphere size versus true sphere size using a half maximum ROI; HR+ (left) and 4096 (right).
in 3D mode, but cascade gamma correction does lead to similar results for 76Br as for 18F in the larger spheres. 3.4. Contrast Figure 8 shows predicted and measured sphere-to-background ratios versus actual activity concentration ratios for spheres of different sizes. The predicted values were calculated using hot spot recovery coefficients divided by 1.08, as explained in the previous subsection. A gain in 76Br image contrast of up to 15% was obtained after correction for cascade gamma coincidences, resulting in a similar image contrast as for 18F. The measured data in figure 8 correspond well with the calculated data for the larger spheres (>2 cm), also in 3D mode where this method of contrast calculation is not accurate because of the nonlinearity of the system as shown in the recovery measurements. For the smallest spheres measured contrast is lower than expected from the calculated data. The poor image statistics of the measured data, which are closer to an actual clinical situation, probably lead to a degradation of contrast in the smaller spheres. 3.5. Count rate characteristics The results of the count rate measurement are given in figures 9 and 10. Table 3 shows the corresponding values for the 50% dead time point, the peak NEC rate, and the points at which the gross (trues+scatter+gamma) and net trues rates equal the random rate. The 76Br
3528
M Lubberink et al
Figure 7. Hot spot (HSR) and cold spot (CSR) recovery coefficients, calculated using a spatial resolution size ROI, for 18F (top) and 76Br (bottom), in 2D (left) and 3D (right). Table 3. Results of the HR+ count rate measurements
76Br,
76Br,
50% DT
Peak NEC
T + S(+G) = D
T=D
T = Dobject
3D
450 kcps 16 kBq ml−1
35 kcps 12 kBq ml−1
340 kcps 9 kBq ml−1
– –
140 kcps 10 kBq ml−1
2D
>65 kcps >19 kBq ml−1
>14 kcps >19 kBq ml−1
65 kcps 19 kBq ml−1
23 kcps 10.5 kBq ml−1
>65 kcps >19 kBq ml−1
net trues rate was less than the random rate at any activity concentration. The 3D net trues rate is larger than the randoms rate inside the object for radioactivity concentrations below 10 kBq ml−1. Figure 10 shows that the HR+ dead time correction is not adequate for 76Br, whereas the 4096 dead time correction is correct. 3.6. Uniformity Maximum and minimum non-uniformities are given in tables 4 and 5. 3.7. Radioactivity outside the FOV Figure 11 shows the count rates resulting from a point source on the patient couch, at different distances to the axial FOV and with or without the neuro-insert in place. In figure 12, the radioactivity concentration measured in 3D mode in a cold water insert inside a 76Br-filled cylindrical phantom is shown both with and without the presence of a point source positioned
Quantitative imaging of 76Br with 2D and 3D PET
3529
Figure 8. Measured and predicted sphere-to-background ratios versus sphere size for different actual uptake ratios (uptake ratios: diamonds 8, triangles 6.5 (measured), squares 4 and circles 2; open symbols corrected for cascade gamma coincidences). Top: 18F, bottom: 76Br, left: 2D, right: 3D.
10 cm outside the axial FOV. In 2D mode, there was no significant difference between the measured concentrations with and without external source. 4. Discussion We investigated the effect of 76Br positron energy on PET resolution and recovery and the effect on quantification of cascade gamma radiation coincidences in 2D and 3D PET with 76 Br. An initial degradation of quantitative accuracy of 76Br PET images compared to 18F was shown in the results above. The relative amount of 76Br cascade gamma coincidences was 45% in 3D mode and 32% in 2D mode, of which one-third inside the phantom resulting in a total phantom background of about 46% in 3D mode and 28% in 2D mode including the NEMA scatter fraction (Brix et al 1997). Instead of using f G + S, the NEMA scatter fraction could be measured specifically for 76Br. These values can be compared to 86Y NEMA scatter fractions of 25% in 2D and 67% in 3D for the GE Advance tomograph (Kohlmyer et al 1999). Application of a correction for cascade gamma radiation coincidences leads to residual correction errors of the same order as for 18F. Especially in 2D, nuclidespecific, spatially variant convolution subtraction scatter and cascade gamma correction is an option that may lead to better correction accuracy for more realistic radioactivity distributions than those studied here (Beattie et al 2001). This should be the subject of further investigations. In 3D, adaption of the HR+ model-based scatter correction (Watson et al 1997) to
3530
M Lubberink et al
Figure 9. Top: HR+ prompt, delayed, gross and net trues count rates for 76Br in 2D mode (left) and 3D mode (right). The dashed lines are the trues rates extrapolated from low-activity data. Bottom: 4096 prompt, delayed, gross and net trues count rates for 76Br (left), and NEC rates (right).
Figure 10. Counts per second per voxel after decay, dead time and abundance correction for the HR+ in 3D mode with 11C and 76Br (left), and measured radioactivity concentration for the 4096 with 76Br (right). HR+ results in 2D mode were similar to those in 3D mode.
gamma-emitting nuclides is also an option. The Gauss fit subtraction scatter correction on the GE Advance in 3D mode probably accounts for cascade gamma coincidences (Pentlow et al 2000). The effect of cascade gamma radiation described here can be related to any cascade gamma radiation emitting nuclide, although the exact fraction of cascade gamma radiation coincidences depends on the relative number and energy of the emitted gamma, as well as the properties of the used tomograph. Spatial resolution and recovery were found to be slightly worse for 76Br on both scanners, as previously reported in other publications (L¨ovqvist et al 1999, Ribeiro et al 1999).
Quantitative imaging of 76Br with 2D and 3D PET
3531
Figure 11. Gross trues count rates from a point source on the patient bed versus distance to the edge of the axial FOV, comparing 76Br and 18F without and with neuro-insert. Table 4. Slice and volume uniformity (%) in a cylindrical phantom, for 76Br and 18F, HR+. LC = linear tail fit background subtraction.
18F,
slice slice 76Br, slice, LC 76Br,
18F,
volume volume 76Br, volume, LC 76Br,
NU+
2D NU−
1.6 2.4 2.5
1.5 1.7 2.4
13 14 12
9 13 12
VOI SD/mean
7 10 10
NU+
3D NU−
3.0 3.4 4.0
2.2 5.6 4.5
15 23 17
12 19 19
Table 5. Slice and volume uniformity (%) in a torso phantom for background subtraction.
18F,
slice slice 76Br, slice, LC 76Br,
18F,
volume volume 76Br, volume, LC 76Br,
NU+
NU−
3.9 4.5 6.3
3.7 5.3 4.2
25 32 37
25 25 44
VOI SD/mean
14 24 24
76Br
and
18F.
LC = linear
VOI SD/mean
24 30 35
However, contrast improves significantly after cascade gamma coincidence correction, and previously reported loss of contrast (Ribeiro et al 1999) for 76Br should thus rather be attributed to gamma radiation coincidences than to positron range. The HR+ dead time correction is a quadratic fit of the total dead time to the singles count rate, determined by a decay measurement as that described here. For nuclides that emit only positrons, the singles-to-trues ratio is mainly depending on radioactivity concentration, and thus on the singles rate, which allows the dead time to be described as a function of singles count rate only. However, this ratio is different for cascade gamma radiation emitting nuclides, which results in an incorrect dead time prediction if the same function is used. Gamma that are rejected by the energy discriminator are not considered but do also contribute to
3532
M Lubberink et al
Figure 12. Measured radioactivity concentrations in a 76Br-filled cylindrical phantom with cold water insert in 3D mode, with (left) and without (right) a 40 MBq 76Br-point source at 10 cm from plane 63 outside the axial FOV, on the right-hand side of the figures. Data were corrected for cascade gamma radiation coincidences using a linear fit to the projection tails.
dead time. Specific dead time correction for 76Br can solve this problem. The dead time correction of the 4096 system is adequate for 76Br in the considered radioactivity interval. Dead time measurements were not done for very high radioactivity concentrations reaching the limits of the systems, but realistic radioactivity concentrations in patient studies with 76Br are of the order of a few kBq ml−1 to limit radiation dose to the patient, far below any saturation problems. The increased influence of 76Br radioactivity outside of the FOV limits is applicability in 3D studies. The neuro-insert decreases this effect, but not quite to similar levels as obtained for 18F or 11C without a neuro-insert. Correction for gamma coincidences using the method described here leads to an improvement, but further investigation into the distribution of gamma radiation coincidences originating outside the FOV should be done. Uniformity measurements showed that image noise is much increased for 76Br compared 18 to F for images containing equal numbers of net trues counts. This noise increase is relatively lower in 2D mode than in 3D mode. These results depend on the used radioactivity concentrations: 76Br concentrations relevant in clinical studies would lead to higher levels of image noise than for 18F even if similar numbers of net true counts were to be acquired in long measurements, because of the lower NEC rates at clinically relevant radioactivity concentrations. Random correction based on a delayed sinogram leads to an increase in image noise relative to random correction calculated from singles count rates (Strother et al 1990), which results in the factor 2 in the NEC equation (3). Because of the much higher random coincidence rates for 76Br compared to 18F, calculated random correction or smoothing of delayed projections before subtraction should be considered. In conclusion, the main challenge to PET imaging with 76Br, causing degradation of quantitative accuracy and image contrast, is the cascade gamma radiation emitted in its decay. Specific dead time correction and cascade gamma coincidence correction improve quantitative accuracy, but more refined methods for description of the distribution of cascade gamma coincidences should be considered. The effect of increased levels of randoms could be improved by smoothing of the delayed sinograms before subtraction. On the other hand, the much lower NEC rate at clinically relevant radioactivity concentrations is a problem that cannot be evaded and leads to a degradation in quantitative accuracy and image quality in clinical studies, especially in 3D mode. The lower acceptance of cascade gamma coincidences and randoms due to thick, long septa and the linear count rate behaviour of the 4096 system seem to make this system as suitable for measurements of 76Br or other cascade gammaemitting nuclides as modern systems with thin, short removable septa such as the HR+.
Quantitative imaging of 76Br with 2D and 3D PET
3533
Acknowledgments The authors would like to thank Dr Vladimir Tolmachev, Dr Karl Johan Fasth and Dr Ulrika Yngve for production of 76Br, and the staff at Uppsala University PET Centre and Frank Janssen for help with measurements. Financial support was given by the Swedish Cancer Society, the Swedish Radiation Protection Agency and the Medical Faculty at Uppsala University. References Adam L E, Zaers J, Ostertag H, Trojan H, Bellemann M E and Brix G 1997 Performance evaluation of the whole-body PET scanner ECAT EXACT HR+ following the IEC standard IEEE Trans. Nucl. Sci. 44 1172–9 Beattie B J, Pentlow K S, Finn R D and Larson S M 2001 A method for the removal of spurious activity in PET imaging introduced by cascade gamma rays J. Nucl. Med. 42 201 Bergstr¨om M, Eriksson L, Bohm C, Blomqvist G and Litton J 1983 Corrections for scattered radiation in a ring detector positron camera by integral transformation of the projections J. Comput. Assist. Tomogr. 7 42–50 Beshara S, Lundqvist H, Sundin J, Lubberink M, Tolmachev V, Valind S, Antoni G, Långstr¨om B and Danielson B G 1999 Kinetic analysis and red cell utilization of 52Fe/59Fe-labeled iron (III) hydroxide-sucrose complex following intravenous administration using positron emission tomography Br. J. Haematol. 104 296–302 Brix G, Zaers J, Adam L E, Bellemann M E, Ostertag H, Trojan H, Haberkorn U, Doll J, Oberdorfer F and Lorenz W J 1997 Performance evaluation of a whole-body PET scanner using the NEMA protocol J. Nucl. Med. 38 1614–23 Chu S Y F, Ekstr¨om L P and Firestone R B 1999 WWW Table of Radioactive Isotopes database version 2/28/99 from URL http://nucleardata.nuclear.lu.se/toi/ Flower M A, Al-Saadi A, Harmer C L, McCready V R and Ott R J 1994 Dose-response study on thyrotoxic patients undergoing positron emission tomography and radioiodine therapy Eur. J. Nucl. Med. 21 531–6 Geworski L, Knoop B O, Levi de Cabrejas M, Knapp W H and Munz D L 2000 Recovery correction for quantitation in positron emission tomography: a feasibility study Eur. J. Nucl. Med. 27 161–9 Graham M C, Pentlow K S, Mawlawi O, Finn R D, Daghighian F and Larson S M 1997 An investigation of the physical characteristics of 66Ga as an isotope for PET imaging and quantitation Med. Phys. 24 317–26 Herzog H, R¨osch F, Stocklin G, Lueders C, Qaim S M and Feinendegen L E 1993 Measurement of pharmacokinetics of yttrium-86 radiopharmaceuticals with PET and radiation dose calculation of analogous yttrium-90 radiotherapeutics J. Nucl. Med. 34 2222–6 Herzog H, Tellmann L, Qaim S M, Spellerberg S, Schmid A and Coenen H H 2002 PET quantitation and imaging of the non-pure positron emitting iodine isotope 124I Appl. Radiat. Isot. 56 673–9 Karp J S et al 1991 Performance standards in positron emission tomography J. Nucl. Med. 12 2342–50 Kohlmyer S G, Miyaoka R S, Shoner S C, Lewellen T K and Eary J F 1999 Quantitative accuracy of PET imaging with yttrium-86 J. Nucl. Med. 40 280 L¨ovqvist A, Lundqvist H, Lubberink M, Tolmachev V, Carlsson J and Sundin A 1999 Kinetics of 76Br-labeled anti-CEA antibodies in pigs; aspects of dosimetry and PET imaging properties Med. Phys. 26 249–58 Lubberink M, Janssen F, Schneider H, Bergstr¨om M and Lundqvist H 1999 Correction for gamma radiation from non-pure positron emitters in positron emission tomography Future Directions in Nuclear Medicine Physics and Engineering (Chicago, 21–23 March 1999) (Chicago: The University of Chicago) Lubberink M, Tolmachev V, Widstr¨om C, Bruskin A, Lundqvist H and Westlin J E 2002 110mIn-DTPA-D-Phe1octreotide for imaging of neuroendocrine tumors with positron emission tomography J. Nucl. Med. 43 (10) Lundqvist H, Lubberink M, Tolmachev V, L¨ovqvist A, Sundin A, Beshara S, Bruskin A, Carlsson J and Westlin J E 1999 Positron emission tomography and radioimmunotargeting—general aspects Acta Oncol. 38 335–41 Martin C C, Christian B T, Satter M R, Nickerson L D H and Nickles R J 1995 Quantitative PET with positron emitters that emit prompt gamma rays IEEE Trans. Med. Imag. 14 681–7 Pentlow K S, Graham M C, Lambrecht R M, Cheung N K V and Larson S M 1991 Quantitative imaging of I-124 using positron emission tomography with applications to radioimmunodiagnosis and radioimmunotherapy Med. Phys. 18 357–66 Pentlow K S, Finn R D, Larson S M, Erdi Y E and Humm J L 1999 Effects of cascade gamma rays in PET imaging and quantitation J. Nucl. Med. 40 280 Pentlow K S, Finn R D, Larson S M, Erdi Y E, Beattie B J and Humm J L 2000 Quantitative imaging of yttrium-86 with PET: the occurrence and correction of anomalous apparent activity in high density regions Clin. Posit. Imag. 3 85–90
3534
M Lubberink et al
Ribeiro M J, Almeida P, Strul D, Ferreira N, Loc’h C, Brulon V, Trebossen R, Maziere B and Bendriem B 1999 Comparison of fluorine-18 and bromine-76 imaging in positron emission tomography Eur. J. Nucl. Med. 26 758–66 Ribeiro M J, Remy P, Loc’h C, Brulon V and Trebossen R 1999 The influence of positron range on the measurement of a physiopathalogical antero-posterior gradient in PET imaging of the putamen Eur. J. Nucl. Med. 27 1190 R¨osch F, Blessing G, Linse K H, Herzog H and Qaim S M 1996 Production of the positron emitting strontium isotope Sr-83 and PET phantom measurements preparatory to the evaluation of Sr-89 pharmacokinetics and dosimetry J. Nucl. Med. 37 166 Rota Kops E, Herzog H, Schmid A, Holte S and Feinendegen L E 1990 Performance characteristics of an eight-ring whole body PET scanner J. Comput. Assist. Tomogr. 14 437–45 Watson C C, Newport D, Casey M E, DeKemp R A, Beanlands R S and Schmand M 1997 Evaluation of simulationbased scatter correction for 3D PET cardiac imaging IEEE Trans. Nucl. Sci. 44 90–7