Technetium and Rhenium Complexes by using Molecular Dynamics Calculations. Kazuharu ... and molecular graphics become available at relatively low cost.
Solvent Extraction Research and Development, Japan, Vol. 20, 15 – 27 (2013)
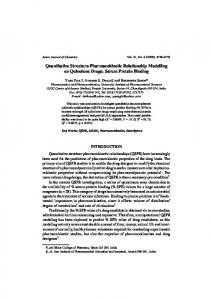
Quantitative Structure Property Relationship of logP for Radiopharmaceutical Technetium and Rhenium Complexes by using Molecular Dynamics Calculations Kazuharu YOSHIZUKA 1, *, Hans-Juergen PIETZSCH 2, Sepp SEIFERT 2 and Holger STEPHAN 2 1. Department of Chemical Engineering, The University of Kitakyushu, Hibikino 1-1, Kitakyushu 808-0135, Japan 2. Institute Fuer Radiopharmazie, Forschungszentrum Dresden-Rossendorf, PF 510 119, D-01314, Dresden, Germany (Received December 25, 2011; Accepted February 1, 2013)
We have developed a novel molecular modelling technique for radiopharmaceutical Tc and Re complexes combined with molecular mechanics (MM) and molecular dynamics (MD) for estimating the partition coefficient of these complexes between water and 1-octanol (logP). The field force parameters developed with a MM program, “MOMEC” were fitted to all relevant X-ray crystal structures of [99mTcO(DMSA)2]- and [188ReO(DMSA)2]- (DMSA: dimercaptosuccinic acid). The force field parameters were transferred to those in a MD program, “Material Explorer”. The MD simulations also indicate that a quantitative structure property relationship (QSPR) was obtained, which relates the internal energy difference between the Tc/Re-DMSA derivatives in the water phase and that in 1-octanol phase with the experimental logP value.
1. Introduction Lipophilicity of a molecule is an important physicochemical property used in chemistry, medicine and pharmacology. The logarithmic coefficients for 1-octanol/water partition (logP) and distribution (logD) are widely used to make estimates for transport and permeation through membranes, interaction with biological receptors and enzymes, toxicity and biological potency. In the design of new compounds, a priori calculation of logP or logD values would be very useful. A number of reviews on lipophilicity estimation for organic compounds have been published [1-6]. However, there are only a few applications to metal complexes due to a lack of parameterization of metal centers [7]. Most of these are related to medicinal
- 15 -
application [8-11]. Computing of the structures and properties of chemical compounds is gaining increasing importance as computational techniques become increasingly accurate, and as high-performance computing and molecular graphics become available at relatively low cost. Computational chemistry is now widely recognized as a powerful tool for the design of new molecules with specified properties, and for interpreting their stabilities, reactivities and other physical properties [12, 13]. Molecular mechanics (MM) calculations are among the simplest and fastest techniques, and are therefore extremely useful when considering very large molecules (e.g. biomolecules) or a large number of structures (e.g. a whole set of isomers or conformers of complex molecules). Molecular dynamics (MD) simulations using empirical potential functions and parameters are being widely applied to elucidate the dynamic behavior and the thermodynamic properties of molecules in dense phases, such as aqueous and organic solutions. By virtue of its ideal nuclear physical characteristics for routine nuclear medicine diagnostics and its ready availability, technetium-99m (99mTc) is still of outstanding interest in the development of novel radiopharmaceuticals. Its congener rhenium in the form of the beta-emitting isotopes, rhenium-186 (186Re) and rhenium-188 (188Re), is an attractive radioisotope for endoradionuclide therapy. A variety of ligands for complexation with technetium and rhenium at oxidation states +5, +3, and +1 has been described in the literature [14]. Among them, dimercaptosuccinic acid (DMSA) is a well-known ligand that forms isomeric complexes with technetium(V) and rhenium(V). Among tumor-seeking agents, the metal-DMSA complex, [MO(DMSA)2]-, has found clinical application for imaging (M =
99m
Tc) and therapy (M = 86Re,
188
Re). A
-
new approach to exploit [MO(DMSA)2] (hereafter, abbreviated as Tc/Re-DMSA) as a potential radiopharmaceutical medicine consists in the functionalization of the DMSA ligand with ester groups. Recent studies have shown that the introduction of one or two non-hydrolysable ester groups into the Tc/Re-DMSA molecule leads to a decrease in bone accumulation without deterioration of the tumor uptake [14]. Comba et al. determined the MOMEC force field parameters for these compounds [8]. They showed that MM calculations can be utilized for the rational design of tailor-made ligand structures, which enable: (i) the highly stable, pharmacologically acceptable linking of 99mTc or 188Re to biomolecules and (ii) the determination of physicochemical parameters such as solubility, dissociative partition coefficients, lipophilicity and protein binding. Since the lipophilicity of radiotracer complexes is well correlated to the biodistribution [15, 16], it is of great interest to develop a novel estimation method of logP for radiotracers. We are now developing such an estimation method for logP for Tc/Re-DMSA derivatives combined with molecular mechanics (MM) and molecular dynamics (MD). In this paper, we describe the novel molecular modelling of Tc/Re-DMSA derivatives combined with both the computational chemistry and quantitative structure-property relationship (QSPR) for estimating logP for Tc/Re-DMSA derivatives. Figure 1 shows the chemical structures of the Tc/Re-DMSA derivatives used in this study, that is [99mTcO(DMSA)2]-, [188ReO(DMSA)2]- and their trimethyl,
- 16 -
tetramethyl, triethyl and tetraethyl ester derivatives. Abbreviations of these complexes are also shown in Figure 1.
S
HOOC
O
S
COOH M = 99mTc, 188Re
M S
HOOC
S
COOH
Tc-DMSA, Re-DMSA
S
H3COOC
O
S
S
H5C2OOC
COOCH3
M S
H3COOC
S
S
O
S
S
H5C2OOC
COOH
S
COOC2H5
S
COOH
Tc-3EDMSA, Re-3EDMSA
S
H5C2OOC
COOCH3
O
S
COOC2H5
S
COOC2H5
M
M H3COOC
S
M
Tc-3MDMSA, Re-3MDMSA
H3COOC
O
S
S
H5C2OOC
COOCH3
Tc-4MDMSA, Re-4MDMSA
Tc-4EDMSA, Re-4EDMSA
Figure 1. Tc-DMSA and Re-DMSA derivatives used in this study.
2. Experimental 2.1 Measurement of logP for Tc/Re-DMSA derivatives The radioactive derivatives of DMSA with
99m
Tc and
188
Re have been prepared according to
methods described in the literatures [15-17]. Partition experiments were performed at 298 1 K in 2 cm3 micro
centrifuge
tubes
by
mechanical
shaking
using
the
system
Tc/Re-DMSA
derivatives-buffer-H2O/1-octanol. The phase ratio of the volume of 1-octanol to that of the aqueous solution was set at unity (0.5 cm3 each). The shaking period was 30 min. All samples were centrifuged after partition equilibrium. The counting rate in both phases was determined radiometrically using the -radiation of
99m
Tc or
188
Re with a NaI(Tl) scintillation counter (Wizard 3” 1480). The pH of the aqueous phase was
adjusted using a 0.05 mol·dm3 CH3COONa/HCl buffer solution for pH 2.0-5.2, and a 0.05 mol·dm3 KH2PO4/Na2HPO4 buffer solution for pH 5.4-7.8, respectively. The distribution ratio, D, was calculated as the ratio of the concentration of Tc/Re-DMSA derivatives in 1-cotanol to that in water. 2.2 MM calculations and MD simulations The MM calculations were performed with the strain minimization program, “MOMEC97” [18, 19]. Within the molecular mechanics frame work, the structure of a molecule is modified in order to
- 17 -
minimize its total strain energy (Etotal) consisting of bond length deformation (Eb), valence angle deformation (E), torsion angle deformation (E) and non-bonded interaction (Enb), as expressed by Eq.(1). E total
E E E E b
θ
φ
(1)
nb
where
Eb
1 k b (r r0 ) 2 2
Eθ
1 k θ (θ θ 0 ) 2 2
Eφ
1 k φ (1 cos(mφ φ 0 ) 2 ) 2
E nb
qi q j
r
Arij12 Brij1
,
where kb, k and k are the potential constants, and r0, 0 and 0 are the ideal values of bond length, bond angle and torsion angle, respectively, and q, , A and B are the partial charge on atom, dielectric constant and the constants of the Lenard-Jones potential function for expressing the van der Waals interaction, respectively. A harmonic M-L stretching potential is also used for the metal-donor interaction. The angular geometry around the metal center is modelled by interligand nonbonded interactions, and torsional potentials, while non-bonded interactions involving the metal center are neglected [7, 8, 21]. Terms for out-of-plane deformation and hydrogen bonding were excluded in the present study. The MOMEC force field parameters for Tc/Re-DMSA derivatives were obtained from the literature data [8]. Input coordinates were obtained from X-ray crystal structure data contained in the Cambridge Crystallographic Data Centre (CCDC) [14-16, 20]. The constant values of force field parameters were adjusted until an optimal agreement between calculated and observed structures was obtained throughout the entire range of available structures. The MD simulations were performed using the MD program, “Material Explorer 4.0” [22]. The potential parameters for MD calculations were transferred from those for MM as described above. The structure, position and orientation of 267 molecules of water and 25 molecules of 1-octanol were optimized in a ca. 1.6×1.6×6.1 nm quadratic prism boundary cell at 298 K, to obtain the practical density of the binary system (ρ = 0.914 g/cm3). The temperature was maintained by Nose-Hoover thermostats [22]. Each bulk phase was optimized in advance for 100 ps at 298 K under the NPT ensemble. The periodic boundary conditions were applied to all three directions. One molecule of Tc/Re-DMSA is set either in the water phase or in the 1-octanol phase. All the Tc/Re-DMSAs used for calculation are monovalent anionic species. Calculation was performed by each 0.1 fs for 100 ps under the NTV ensemble at 298 K.
- 18 -
3. Results and Discussion 3.1 logP for Tc/Re-DMSA derivatives Figures 2 – 4 shows the relationship between the logarithm of the distribution ration (logD) and the pH of the aqueous solution, for the tetra-acid derivatives, tetra-ester derivatives and tri-ester derivatives of Tc/Re-DMSA, respectively.
-2.0 -2.2
Tc-DMSA Re-DMSA
-2.4
logD
-2.6 -2.8 -3.0 -3.2 -3.4 -3.6 -3.8 2
3
4
5
6
7
8
pH Figure 2. logD vs. pH for the tetra acid derivatives of Tc/Re-DMSA.
1.0
logD
0.5 Tc-4MDMSA Tc-4EDMSA Re-4MDMSA Re-4EDMSA
0.0 -0.5 -1.0
2
3
4
5
6
7
8
pH Figure 3. logD vs. pH for the tetra-ester derivatives of Tc/Re-DMSA.
- 19 -
0.5 Tc-3MDMSA Tc-3EDMSA Re-3MDMSA Re-3EDMSA
0.0
logD
-0.5 -1.0 -1.5 -2.0 -2.5 -3.0 2
3
4
5
6
7
8
pH Figure 4. logD vs. pH for the tri-ester derivatives of Tc/Re-DMSA.
Since Tc/Re-DMSA exists either as an undissociated monovalent anionic species or a dissociated divalent anionic species, Tc/Re-DMSA derivatives are partition between the aqueous phase and the organic phase by the following ion-pair extraction mechanism: Ka ComH-・C+
Com2-・2C+ Aqueous phase Pdis
Pundis
Organic phase ComH-・C+
Com2-・2C+
where Pundis and Pdis are the partition coefficients of the undissociated form (ComH-・C+) and the dissociated form (Com2-・2C+) of Tc/Re-DMSA, and Ka is the dissociation constant of the Tc/Re-DMSA carboxylic acid. Though the counter cation (C+) is co-extracted as an ion pair with Tc/Re-DMSA, the species of counter cation has not been identified at this time. These constants are expressed as follows:
Pundis
[ComH-・C ] org [ComH-・C ] aq
Pdis
[Com2-・2C ]org [Com2-・2C ]aq
The distribution ratio of the metal complex, D, is expressed by:
- 20 -
Ka
[Com2-・2C ]aq [H ]aq [ComH-・C ]aq
(2)
D
C org C aq
[ComH-・C ] org [Com2-・2C ] org [ComH-・C ] aq [Com2-・2C ] aq
[ComH-・C ] org [Com2-・2C ] org K [ComH-・C ] aq 1 a [H ] aq
(3)
By combining Eq.(3) and Eq.(2), the following equations can be obtained. P K [ComH-・C ]or g 1 dis a Pundis [H ]aq D K [ComH-・C ]aq 1 a [H ]aq
D
1 Pundis
Pdis K a Pundis [H ]aq 1
(4)
Ka [H ]aq
Pundis[H ]aq Pdis K a
(5)
[H ]aq K a
When [H+]aq >> Ka, D is nearly equal to Pundis, which is called the usual partition coefficient, P. Table 1 shows the values of Pundis, Pdis and Ka obtained by using nonlinear regression analysis. The solid lines in Figures.2 - 4 are the calculated lines obtained by using Eq.(5) and the constants listed in Table 1. The calculated lines are in quite good agreement with the experimental data.
Table 1. Constants obtained by nonlinear regression analysis. Substance
Pundis [ - ] (logP)
Pdis [ - ]
-3
Ka [mol/L] (pKa) -4
Tc-DMSA
7.98 x 10 (-2.10)
4.75 x 10
4.06 x 10⁻⁴ (3.39)
Re-DMSA
4.96 x 10⁻³ (-2.30)
2.99 x 10⁻⁴
1.27 x 10⁻³ (2.85)
Tc-4MDMSA
3.76 (0.58)
-
-
Tc-4EDMSA
5.56 (0.75)
-
-
Re-4MDMSA
0.0832 (-1.08)
-
-
Re-4EDMSA
0.164 (-0.79)
-
-3
Tc-3MDMSA
0.131 (-0.88)
3.41 x 10
1.52 x 10⁻⁴ (3.82)
Tc-3EDMSA
1.93 (0.29)
1.22 x 10⁻²
3.03 x 10⁻⁴ (3.51)
Re-3MDMSA
7.69 x 10⁻² (-1.11)
3.43 x 10⁻³
3.77 x 10⁻⁴ (3.42)
Re-3EDMSA
1.04 (0.02)
5.69 x 10⁻³
5.76 x 10⁻⁴ (3.24)
3.2 MM calculations and MD simulations Figure 5 shows RMS overlays of the lowest energy structure for the Re-DMSA calculated by MOMEC97 and the crystal structure, cited in the literature [10], as an example. Since both structures are in good agreement (RMS = 0.24Å), we consider that the MOMEC force field parameters [8] are also adaptable for the calculation of similar Tc/Re-DMSA structures. The final differences between observed and computed bond distances are 0.02Å, those for valence angles are 3° for all Tc/Re-DMSA derivatives
- 21 -
in this study.
Figure 5. Overlay of computed MOMEC and X-ray structures of Re-DMSA.
Figure 6 shows the MD snapshot of the tetra acid derivative of Re-DMSA in the 1-octanol/water binary system after 100 ps. The Re-DMSA is stabilized by interaction (solvation) of the DMSA moieties with surrounding 1-octanol molecules.
Re-DMSA Figure 6. MD snapshot of Re-DMSA in the water – 1-octanol binary system: the circle indicates the position of Re-DMSA in the 1-octanol phase.
Figure 7 shows the rate of change in the internal energy of the 1-octanol/water binary system as shown in Figure 6. After 70 ps, since the whole internal energy of the boundary cell of the binary system approaches a constant value, the internal energy reaches an equilibrium state within the micro scale of the interfacial area.
- 22 -
Internal Energy, U x 1017 [J]
1.4
1.2
1.0
0.8
0.6
0.4 0
20
40
60
80
100
Time [ps] Figure 7. Rate of change of the internal energy of Re-DMSA in the 1-octanol/water binary system. 3.3 QSPR for estimating logP for the Tc/Re-DMSA derivatives MD simulations were applied for the estimation of the stabilization energies of the Tc/Re-DMSA derivatives, and for estimating the logP values for the undissociated molecules of Tc/Re-DMSA. Firstly, an MD simulation of the 1-octanol/water binary system with Tc/Re-DMSA was performed to obtain feasible configurations of the solute and solvent molecules, either 1-octanol or water, at the equilibrium state, in order to obtain the overall internal energy, Uall. This internal energy contains all bonding and nonbonding interactions in the binary system. Secondly, after removing the Tc/Re-DMSA from the 1-octanol/water binary system, the internal energy of all solvent molecules in the system, Usol, was calculated Finally, the internal energy of the removed Tc/Re-DMSA in vacuo, Ucom, was calculated [23].
U U all U sol U com
(6)
where Ui (i = all, sol, com) are the relevant internal energies of all molecules in the binary system, solvent molecules in the system and Tc/Re-DMSA alone, respectively. The solute-solvent interaction energy, ΔU, can be calculated for Tc/Re-DMSA in the 1-octanol phase, ΔU1-octanol, and that in the water phase, ΔUwater, in the 1-octanol/water binary system. From the difference in these interaction energies, ΔΔU, the QSPR equation for estimating logP can be obtained:
U U1-octanol U water logP
(7)
- 23 -
where α is the apparent QSPR constant of the above relationship, and the subscripts “1-octanol” and “water” indicate the internal energy difference of Tc/Re-DMSA existing either in 1-octanol phase or water phase in the boundary cell. When ΔΔU has a large negative value, the solute molecule is more stable in 1-octanol (larger logP value), and vice versa. Table 2 shows the ΔΔU values of the Tc/Re-DMSA derivatives obtained by MD calculations. The ΔΔU values of the Tc-DMSA derivatives are smaller (negatively larger) than that of the corresponding Re-DMSA derivatives, indicating that Tc-DMSA derivatives are more lipophilic than Re-DMSA derivatives. Table 2. ΔΔU values for the Tc/Re-DMSA derivatives. ΔΔU [kJ/mol] Substance Tc-DMSA
-8.78
Re-DMSA
-6.45
Tc-4MDMSA
-31.22
Tc-4EDMSA
-41.32
Re-4MDMSA
-13.25
Re-4EDMSA
-23.68
Tc-3MDMSA
-17.46
Tc-3EDMSA
-35.21
Re-3MDMSA
-13.69
Re-3EDMSA
-34.98
Figure 8 shows the relationship between ΔΔU and logP for the Tc/Re-DMSA derivatives. The plot of ΔΔU vs. logP lies on a straight line with a slope of -11.2 (= ) and an intercept of -30.0 with an acceptable correlation factor (r2 = 0.91). ΔΔU for the Tc-DMSA derivatives were smaller than the corresponding Re-DMSA derivatives, which means that the Tc-DMSA derivatives are more lipophilic than the Re-DMSA derivatives. That can be mainly explained on the basis of different van der Waals interactions between complexes and the surrounding 1-octanol molecules. Moreover, it is elucidated that ΔΔU directly reflects the energy difference between the non-bonded interaction of the complex and solvent. The experimentally determined logP values corroborate the calculated results. Currently, we are attempting to obtain the apparent QSPR constant α between the calculated ΔΔU and the experimental values of logP for tumortropic ester derivatives of Tc/Re-DMSA.
- 24 -
10 U = -11.2 logP - 30.0, r 2 = 0.91
U [kJ/mol]
0 -10 -20 -30
Tc-DMSA derivative Re-DMSA derivative
-40 -50 -3.0
-2.5
-2.0
-1.5
-1.0
-0.5
0.0
0.5
1.0
1.5
logP Figure 8 QSPR between U and logP 4. Conclusion We propose a novel molecular modelling of radiopharmaceutical Tc/Re-DMSA derivatives combined with molecular mechanics and the molecular dynamics for estimating logP values for Tc/Re-DMSA derivatives. The distribution ratio D of Tc/Re-DMSA derivatives between 1-octanol and water phases was measured as a function of pH to obtain logP values of Tc/Re-DMSA derivatives. Since there are several hydrolysable carboxylic moieties in the Tc/Re-DMSA derivatives, an extraction mechanism for the partitioning of the nonionic and anionic forms between 1-octanol and water phases associated with the acid dissociation of the carboxylic groups in the Tc/Re-DMSA derivatives was proposed. The partition coefficients of the nonionic and anionic forms and the acid dissociation constants were obtained by non linear regression of the experimental data. The force field parameters of the MM program (MOMEC) for Tc/Re-DMSA derivatives developed in a previous study were transferred from MOMEC to the MD program (Materials Explorer). The MD simulations were carried out to obtain the dynamic behavior and thermodynamic properties of the Tc/Re-DMSA derivatives in the 1-octanol/water binary system. The quantitative structure property relationship (QSPR) between the internal energy differences of the Tc/Re-DMSA derivatives in the 1-octanol/water binary system and the logP value were evaluated. The following results were obtained: (1)
The distribution ratio profiles of Tc/Re-DMSA derivatives against the pH in the aqueous phase can be adequately simulated by the proposed extraction mechanism and the equilibrium constants obtained by non linear regression.
(2)
All Tc-DMSA derivatives are more lipophilic compared to the corresponding Re-DMSA derivatives.
- 25 -
(3)
The logP values for the Tc/Re-DMSA derivatives become greater in the order, tetraethyl ester > triethyl ester > tetramethyl ester > trimethyl ester > tetra acid.
(4)
The ΔΔU values for the Tc/Re-DMSA derivatives calculated by MD simulations become greater in the order, tetraethyl ester > triethyl ester > tetramethyl ester > trimethyl ester > tetra acid; this tendency of the ΔΔU values are identical to that of the logP values.
(5)
The QSPR equation for estimating logP for all Tc/Re-DMSA derivatives can be expressed as ΔΔU = -11.6 logP - 29.2, with high linearity.
(6)
The model was also applied for the prediction of logP values of rhenium derivatives with bridged DMSA ligands and gave a reasonable agreement between experimental and calculated logP values.
Acknowledgements We gratefully acknowledge the financial support under a bilateral program between JSPS and DAAD for staying at Forschungszentrum Dresden-Rossendorf. The present work is also supported by Grant-in-Aids for Scientific Research from the Ministry of Education, Science, Sports and Culture of Japan. The authors would like to thank Karin Landrock for excellent technical assistance.
References 1)
R. Mannhold, R.F. Rekker, C. Sonntag, A.M. ter Laak, K. Dross, E. E. Polymeropoulos, J. Pharma. Sci., 84, 1410-1419 (1995).
2)
H. van de Waterbeemd, Quant. Strut.-Act. Relat., 15, 410-412 (1996).
3)
I.V. Tetko, V.Y. Tanchuk, A.E.P. Villa, J. Chem. Inf. Comput. Sci., 41, 1407-1421 (2001).
4)
R. Mannhold, H. van de Waterbeemd, J. Computer-Aided Molecular Design, 15, 337-354(2001).
5)
D. Erös, I. Kövesdi, L. Örfi, K. Takacs-Novak, G. Acsady, G. Keri, Curr. Med. Chem., 9, 1819-1829 (2002).
6)
R. Mannhold, G.I. Poda, C. Ostermann, I.V. Tetko, J. Pharma. Sci., 98, 861-893 (2009).
7)
P. Comba, K. Gloe, K. Inoue, T. Krüger, H. Stephan, K. Yoshizuka, Inorg. Chem., 37, 3310-3315 (1998).
8)
P. Comba, A. Daubinet, B. Martin, H. J. Pietzsch, H. Stephan, J. Organomet. Chem., 691, 2495-2502 (2006).
9)
S. P. Oldfield, M. D. Hall, J. A. Platts, J. Med. Chem., 50, 5227-5237 (2007).
10) I.V. Tetko, I. Jaroszewicz, J.A. Platts, J. Kuduk-Jaworska, J. Inorg. Biochem., 102, 1424-1437 (2008). 11) P. Sarmah, R. C. Deka, J. Computer- Aided Molecular Design, 23, 343–354 (2009). 12) A. R. Leach, “Molecular Modeling, Principles and Applications”, Longman (1999). 13) K. Yoshizuka, Anal. Sci., 20, 761-765 (2004). 14) S. Seifert, R. Syhre, H. Spies, B. Johannsen, Appl. Radiat. Isot., 48, 1051-1057 (1997). 15) S. Seifert, R. Syhre, H. Spies, B. Johannsen, Nucl. Med. Commun., 24, 1175-1181 (2003).
- 26 -
16) S. Seifert, T. Heinrich, C. Jentschel, C. Smuda, R. Bergmann, H.-J. Pietzsch, Bioconjugate Chem., 17, 1601-1606 (2006). 17) J. Singh, A. K. Powell, S. E. M. Clarke, P. J. Blower, Chem. Commun., 1115-1117 (1991). 18) P. Comba, T. W. Hambley, “Molecular Modeling of Inorganic Compounds”, VCH, Weinheim (1995). 19) P. Comba, T. W. Hambley, N. Okon, “MOMEC97, a molecular mechanics package for transition metal complexes”, University of Heidelberg, Germany (1997). 20) P. Leibnitz, G. Reck, H.-J. Pietzsch, H. Spies, Report FZR-311, Forschungs-zentrum Rossendorf, 46-47 (2001). 21) K. Yoshizuka, K. Inoue, P. Comba, Kagaku Kogaku Ronbunshu, 26, 517 (2000). 22) Fujitsu Co. Ltd., “Material Explorer 4.0” (2006). 23) H. Watarai, Y. One, Solv. Extra. Ion Exch., 19 , 155-166 (2001).
- 27 -