Eur Radiol DOI 10.1007/s00330-015-4101-9
NEURO
Quantitative validation of a visual rating scale for frontal atrophy: associations with clinical status, APOE e4, CSF biomarkers and cognition Daniel Ferreira 1 & Lena Cavallin 2,3 & Tobias Granberg 2,3 & Olof Lindberg 1 & Carlos Aguilar 1 & Patrizia Mecocci 4 & Bruno Vellas 5 & Magda Tsolaki 6 & Iwona Kłoszewska 7 & Hilkka Soininen 8 & Simon Lovestone 9 & Andrew Simmons 10,11,12 & Lars-Olof Wahlund 1 & Eric Westman 1 & for the AddNeuroMed consortium and for the Alzheimer’s Disease Neuroimaging Initiative
Received: 3 September 2015 / Revised: 14 October 2015 / Accepted: 30 October 2015 # European Society of Radiology 2015
Abstract Objectives To validate a visual rating scale of frontal atrophy with quantitative imaging and study its association with clinical status, APOE ε4, CSF biomarkers, and cognition. Methods The AddNeuroMed and ADNI cohorts were combined giving a total of 329 healthy controls, 421 mild cognitive impairment patients, and 286 Alzheimer’s disease (AD) patients. Thirty-four patients with frontotemporal dementia (FTD) were also included. Frontal atrophy was assessed with the frontal sub-scale of the global cortical atrophy scale (GCA-F) on T1-weighted images. Automated imaging
markers of cortical volume, thickness, and surface area were evaluated. Manual tracing was also performed. Results The GCA-F scale reliably reflects frontal atrophy, with orbitofrontal, dorsolateral, and motor cortices being the regions contributing most to the GCA-F ratings. GCA-F primarily reflects reductions in cortical volume and thickness, although it was able to detect reductions in surface area too. The scale showed significant associations with clinical status and cognition. Conclusion The GCA-F scale may have implications for clinical practice as supportive diagnostic tool for disorders
* Data used in preparation of this article were obtained from the Alzheimer’s Disease Neuroimaging Initiative (ADNI) database (adni.loni.usc.edu). As such the investigators within the ADNI contributed to the design and implementation of ADNI and/or provided data but did not participate in analysis or writing of this report. A complete listing of ADNI investigators can be found at: http://adni.loni.usc.edu/wp-content/uploads/ how_to_apply/ADNI_Acknowledgement_List.pdf. * Daniel Ferreira
[email protected]
5
INSERM U 558, University of Toulouse, Toulouse, France
6
3rd Department of Neurology, Aristoteleion Panepistimeion Thessalonikis, Thessaloniki, Greece
1
7
Medical University of Lodz, Lodz, Poland
8
University of Eastern Finland, University Hospital of Kuopio, Kuopio, Finland
9
Department of Psychiatry, Warneford Hospital, University of Oxford, Oxford, UK
10
Department of Neuroimaging, Institute of Psychiatry, King’s College London, London, UK
11
NIHR Biomedical Research Centre for Mental Health, London, UK
12
NIHR Biomedical Research Unit for Dementia, London, UK
2
Division of Clinical Geriatrics, Center for Alzheimer Research, Department of Neurobiology, Care Sciences and Society, Karolinska Institutet, Novum, 5th floor, SE-141 86 Stockholm, Sweden Division of Medical Imaging and Technology, Department of Clinical Science, Intervention and Technology, Karolinska Institutet, Stockholm, Sweden
3
Department of Radiology, Karolinska University Hospital in Huddinge, Huddinge, Sweden
4
Institute of Gerontology and Geriatrics, University of Perugia, Perugia, Italy
Eur Radiol
demonstrating predominant frontal atrophy such as FTD and the executive presentation of AD. We believe that GCA-F is feasible for use in clinical routine for the radiological assessment of dementia and other disorders. Key points • The GCA-F visual rating scale reliably reflects frontal brain atrophy. • Orbitofrontal, dorsolateral, and motor cortices are the most contributing regions. • GCA-F shows significant associations with clinical status and cognition. • GCA-F may be supportive diagnostic tool for disorders demonstrating predominant frontal atrophy. • GCA-F may be feasible for use in radiological routine. Keywords Frontal atrophy . Neuroimaging . Alzheimer’s disease . Mild cognitive impairment . Frontotemporal dementia
Abbreviations MTA medial temporal atrophy PA posterior atrophy GCA global cortical atrophy GCA-F global cortical atrophy – frontal sub-scale SFG superior frontal gyrus MFG middle frontal gyrus IFG inferior frontal gyrus ORB orbitofrontal cortex DACC and dorsal anterior cingulate gyrus
occipital lobes [8], and may thus be useful for the visuospatial and language presentations. Given that executive dysfunction has been extensively associated with atrophy in the frontal lobe [9], a visual rating scale of frontal atrophy may support diagnosis of the executive AD presentation. However, no visual rating scales of frontal atrophy have been specifically validated for AD to date. Since the global cortical atrophy (GCA) scale [10, 11] includes a separate assessment of the frontal lobe (i.e., GCA-F), and has been extensively applied in AD [11–18], it could serve as a framework for assessing frontal atrophy. Such a scale may also be of value for other disorders with predominant frontal atrophy such as frontotemporal dementia (FTD). In the current study we provide a comprehensive validation of the GCA-F scale using quantitative imaging as previously done for other visual rating scales [19–21]. Three different levels of anatomical detail were covered by performing analyses of the entire frontal lobe, the individual frontal subregions, and the whole cortical mantle providing a much finer analysis at the vertex level. We also analyzed three different markers of brain integrity, i.e., cortical volume, cortical thickness, and cortical surface area, and assessed which frontal subregions contributed most to the discrimination between GCAF scores. Fully automated methods were used in a large sample including AD, MCI, and healthy control subjects, and gold standard manual tracings were used in a smaller sample including patients with FTD. Finally, we studied the association between GCA-F and clinical status, cerebrospinal (CSF) biomarkers, and cognition.
Materials and methods Introduction
Subjects
Different clinical presentations of Alzheimer’s disease (AD) are now recognized in the current diagnostic criteria [1]. The amnestic presentation is most common and depicts the typical phenotype of AD characterized by cognitive impairment in episodic memory. The other presentations are non-amnestic in their origin and their diagnosis is often challenging. Since neurodegeneration can be studied with imaging techniques, visual rating scales of regional atrophy may be valuable to support diagnosis of different AD presentations. Their advantage over automated methods is that they are already used in clinical work, can be implemented both in magnetic resonance and computerized tomography images (even in different protocols and quality), and are quick and easy to use. The medial temporal atrophy (MTA) scale [2] has been incorporated in the diagnostic algorithm of AD to assess hippocampal atrophy [1, 3], and shows a well-established association with the amnestic presentation [2, 4–6]. The posterior atrophy (PA) scale [7] has proved useful in cases with atrophy in the parietal and
Data from AddNeuroMed and ADNI studies were combined providing a total of 1036 individuals: healthy controls (n=329), mild cognitive impairment (MCI) (n=421), and AD (n=286). AddNeuroMed is part of the InnoMed European Union FP6 programme and was designed to develop and validate surrogate markers in AD [22]. ADNI was launched in 2003 by the National Institute on Aging, the National Institute of Biomedical Imaging and Bioengineering, the Food and Drug Administration, private pharmaceutical companies, and non-profit organizations [23]. The project was established to develop standardized imaging techniques and biomarkers in AD research. Data were obtained from the ADNI database (adni.loni.usc.edu, PI Michael M. Weiner). Participant recruitment and eligibility criteria were very similar in both cohorts [22, 24]. In addition, thirty-four patients with FTD were enrolled from a previous study [25] in order to test the GCA-F scale in a disorder typically displaying atrophy in the frontal lobe. Briefly, this cohort included patients with the behavioural
Eur Radiol
variant of FTD (bvFTD, n= 12), progressive non-fluent aphasia (PNFA, n =9), and semantic dementia (SD, n = 13). Patients were recruited from the Memory Clinic at Karolinska University Hospital Huddinge, Stockholm, Sweden. Clinical diagnoses were determined on multidisciplinary consensus according to Neary et al. criteria [26]. Further details are provided elsewhere [25]. The study was approved by the Regional Ethical Review Board in Stockholm, Sweden.
participants, providing weighted kappa values of 0.70 and 0.59, respectively. Intraclass correlation coefficients showed averaged absolute agreement of 0.79. L.C. has 8 years of experience using GCA and T.G. is newly trained. Both raters were blind to diagnosis, demographic, and clinical information.
Magnetic resonance imaging and visual rating of frontal atrophy
Cortical reconstruction was performed using FreeSurfer 5.3.0 (http://surfer.nmr.mgh.harvard.edu/) (see Appendix Table 6 for full details and references). This procedure provides measurements of cortical volume, cortical thickness, and cortical surface area for 34 regions for each hemisphere, as well as a measurement of the total intracranial volume (TIV). Frontal regions were combined to provide four functional-anatomical relevant sub-regions, also reducing the number of multiple comparisons: dorsolateral, medial, motor, and orbitofrontal cortices (Fig. 2). In addition, a measurement of the entire frontal lobe was calculated by combining the four frontal sub-regions (i.e., frontal ROI).
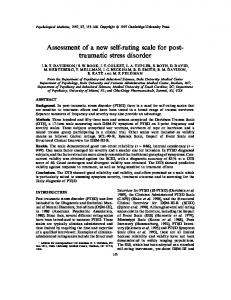
A 3D T1-weighted MPRAGE sequence was acquired in the three samples, AddNeuroMed, ADNI, and the Memory Clinic [22, 25, 27]. The GCA scale was applied in axial plane, restricting the original criteria from Pasquier et al. [10] to the frontal lobe in order to provide a measurement of frontal atrophy (i.e., GCA-F). Scores range from 0 (no atrophy) to 3 (end-stage degree of atrophy) (details in Fig. 1). Intra-rater x(L.C.) and inter-rater (L.C. and T.G.) reliability were tested in 100 randomly selected
Fig. 1 Scoring of the visual rating scale for frontal atrophy (GCA-F). The GCA scale was applied to axial T1-weighted images, restricting the original criteria from Pasquier et al. [10] to the frontal lobe in order to provide a measurement of frontal atrophy (i.e., GCA-F). Briefly, sulcal dilatation is determined as absent (GCA-F=0), mild (GCA-F=1), moderate (GCA-F=2), or severe (GCA-F=3). Clear guidelines for determining sulcal dilatation are provided in Pasquier et al. [10]. The anatomical boundaries of the frontal lobe were defined by the central sulcus at the posterior part, the frontal bone at the anterior and dorsal parts, and the fissure of Sylvius at the ventral posterior part. Ratings were performed on axial reconstructions
Automated reconstruction and parcellation of the cortex, performed in AddNeuroMed and ADNI samples
Eur Radiol
Fig. 2 Cortical parcellation and calculation of the frontal ROI and frontal sub-regions. FreeSurfer 5.3.0 parcellates the cortical surface in to 34 regions for each hemisphere. Regions of the frontal lobe were combined to provide four frontal sub-regions: dorsolateral cortex (also including ventrolateral cortex), medial cortex, motor cortex, and orbitofrontal cortex. The superior frontal gyrus was assigned to the
medial cortex since most of this area is displayed in the medial part of the frontal lobe. In addition, a measurement of the entire frontal lobe was calculated by combining the four frontal sub-regions (i.e., frontal ROI). Values of cortical volume, cortical thickness, and cortical surface area are available for all the regions. Non-frontal regions are displayed in gray
Manual tracing of frontal sub-regions, performed in the Memory Clinic sample
symbol, digit span, semantic fluency (animals), auditory verbal learning test (AVLT), Boston naming test (BNT), and clock test.
Volumetric values for the FTD patients including the following frontal regions (left and right) and the TIV were taken from our previous study [25]: superior frontal gyrus (SFG), middle frontal gyrus (MFG), inferior frontal gyrus (IFG), orbitofrontal cortex (ORB), and dorsal anterior cingulate gyrus (DACC). Methods for manual tracing and volume calculation are fully described elsewhere [25] and in Appendix Table 7.
Statistical analysis
Clinical status, CSF biomarkers, and cognitive variables Procedures for assessing clinical status, CSF biomarkers, and cognitive performance are described elsewhere [24, 28]. Clinical status was assessed with MMSE, CDR, GDS, FAQ, and APOE ε4 status. CSF levels of Aß1–42, total tau (T-tau) and phosphorylated tau (p-tau) were also studied. The following cognitive tests were included: trail making test (TMT), digit
One-way independent ANOVA/ANCOVA was used for continuous variables and the Chi-square test for dichotomous variables. Mixed ANCOVA was used to analyze the interaction between two or more independent variables. Following previous studies [19], age and gender were not included as covariates because the GCA-F rating was blind to this information. Binary logistic regression was performed to assess which frontal sub-regions contributed most to a higher score on GCA-F. The P-values in all principal and post-hoc analyses were adjusted using Bonferroni correction for multiple comparisons. Results were considered significant when p≤0.05. Analyses were performed using SPSS 22.0 for Mac. Vertex analyses across the cortical mantle were conducted using FreeSurfer software. A general linear model was fitted
Eur Radiol
at each vertex using cortical volume, thickness, or area as dependent variables. Results were tested against an empirical null distribution of maximum cluster size across 5.000 iterations. Z Monte Carlo simulations were used with a clusterforming threshold of p≤0.05 (two-sided), yielding clusters corrected for multiple comparisons across the cortical mantle.
Results Table 1 shows the demographics. Patients with bvFTD and PNFA evidenced the greatest degree of frontal atrophy as measured by the GCA-F scale, followed by the AD and MCI groups (Fig. 3). Since asymmetry is key finding in FTD, the GCA-F scale was also applied separately to the two hemispheres in the FTD patients. Interestingly, a significant interaction between FTD subtype and hemisphere was found (F(2, 31) =5.512 ; p=0.009) (Appendix Fig. 5). BvFTD patients had qualitatively more frontal atrophy in the right hemisphere, PNFA patients had qualitatively more frontal atrophy in the left hemisphere, and there were no betweenhemispheric differences in SD patients. All the participants were then classified according to their GCA-F ratings for the validation analyses. The three patients rated as GCA-F=3 (one AD, one bvFTD, and one PNFA) were added to the GCA-F=2 group in order to provide three large GCA-F groups. Demographics for these three groups are displayed in Appendix Table 8. Association of GCA-F with automated imaging These analyses were performed only in AddNeuroMed and ADNI samples. ANCOVA performed at the frontal ROI level showed that higher scores in GCA-F were associated with smaller volume (F(2, 1032) = 85.163; p < 0.001), thickness (F(2, 1032) =90.338; p