We study the time evolution of driven quantum systems using analytic, algebraic,
and numer- ... pled ODE's for the time evolution of the Lie algebra parameters.
Quantum Dynamics Using Lie Algebras, with Explorations in the Chaotic Behavior of Oscillators
Ryan Thomas Sayer
A thesis submitted to the faculty of Brigham Young University in partial fulfillment of the requirements for the degree of Master of Science
Jean-François S. Van Huele, Chair Manuel Berrondo Scott D. Bergeson
Department of Physics and Astronomy Brigham Young University December 2012
Copyright © 2012 Ryan Thomas Sayer All Rights Reserved
ABSTRACT Quantum Dynamics Using Lie Algebras, with Explorations in the Chaotic Behavior of Oscillators Ryan Thomas Sayer Department of Physics and Astronomy, BYU Master of Science We study the time evolution of driven quantum systems using analytic, algebraic, and numerical methods. First, we obtain analytic solutions for driven free and oscillator systems by shifting the coordinate and phase of the undriven wave function. We also factorize the quantum evolution operator using the generators of the Lie algebra comprising the Hamiltonian. We obtain coupled ODE’s for the time evolution of the Lie algebra parameters. These parameters allow us to find physical properties of oscillator dynamics. In particular we find phase-space trajectories and transition probabilities. We then search for chaotic behavior in the Lie algebra parameters as a signature for dynamical chaos in the quantum system. We plot the trajectories, transition probabilities, and Lyapunov exponents for a wide range of the following physical parameters: strength and duration of the driving force, frequency difference, and anharmonicity of the oscillator. We identify conditions for the appearance of chaos in the system.
Keywords: quantum dynamics, oscillator, driving force, dynamical chaos, Lie algebra, mean field, anharmonicity, Lyapunov exponent, transition probability
ACKNOWLEDGMENTS I would like to thank Dr. Van Huele for all of the hours of help and guidance he gave me in preparing this document. I would also like acknowledge Dr. Berrondo, whose past work with Lie algebras provided a starting point for my own research.
Contents Table of Contents
iv
List of Figures
vi
1
Introduction 1.1 Background . . . . . . . . . . . . . . . . . . . . . . . . . . . . . . . . . . . . . . 1.2 Objectives . . . . . . . . . . . . . . . . . . . . . . . . . . . . . . . . . . . . . . . 1.3 Outline . . . . . . . . . . . . . . . . . . . . . . . . . . . . . . . . . . . . . . . .
1 1 2 3
2
Methods 2.1 The Time-Dependent Hamiltonian . . . . . . . . . . . . . . . 2.2 A Semi-Classical Ansatz . . . . . . . . . . . . . . . . . . . . 2.2.1 Ehrenfest’s Theorem . . . . . . . . . . . . . . . . . . 2.2.2 The Free Particle . . . . . . . . . . . . . . . . . . . . 2.2.3 The Simple Harmonic Oscillator . . . . . . . . . . . . 2.2.4 Extensions And Limits . . . . . . . . . . . . . . . . . 2.3 Algebraic Structures . . . . . . . . . . . . . . . . . . . . . . 2.3.1 Properties of Algebras . . . . . . . . . . . . . . . . . 2.3.2 Lie Algebras . . . . . . . . . . . . . . . . . . . . . . 2.4 Solving for Time Evolution with Lie Algebras . . . . . . . . . 2.4.1 The Wei-Norman Ansatz . . . . . . . . . . . . . . . . 2.4.2 Choosing an Algebra Basis . . . . . . . . . . . . . . . 2.4.3 Closure Under Commutation . . . . . . . . . . . . . . 2.4.4 Normal Ordering . . . . . . . . . . . . . . . . . . . . 2.4.5 Unitarity . . . . . . . . . . . . . . . . . . . . . . . . 2.4.6 The Free Particle . . . . . . . . . . . . . . . . . . . . 2.4.7 The Simple Harmonic Oscillator . . . . . . . . . . . . 2.4.8 Mean Field Approximations to Ensure Closure . . . . 2.4.9 Some Useful Properties of the Lie Algebra Parameters 2.5 Chaos . . . . . . . . . . . . . . . . . . . . . . . . . . . . . . 2.5.1 Conditions for Chaos . . . . . . . . . . . . . . . . . . 2.5.2 Lyapunov Exponents . . . . . . . . . . . . . . . . . . iv
. . . . . . . . . . . . . . . . . . . . . .
. . . . . . . . . . . . . . . . . . . . . .
. . . . . . . . . . . . . . . . . . . . . .
. . . . . . . . . . . . . . . . . . . . . .
. . . . . . . . . . . . . . . . . . . . . .
. . . . . . . . . . . . . . . . . . . . . .
. . . . . . . . . . . . . . . . . . . . . .
. . . . . . . . . . . . . . . . . . . . . .
. . . . . . . . . . . . . . . . . . . . . .
. . . . . . . . . . . . . . . . . . . . . .
. . . . . . . . . . . . . . . . . . . . . .
5 5 6 6 7 8 10 11 11 13 14 14 15 16 16 17 18 20 21 22 23 23 24
v
CONTENTS 2.5.3 2.5.4 2.5.5 3
4
Phase Space Behavior . . . . . . . . . . . . . . . . . . . . . . . . . . . . 24 Examples of Chaotic Systems . . . . . . . . . . . . . . . . . . . . . . . . 24 Quantum Chaos . . . . . . . . . . . . . . . . . . . . . . . . . . . . . . . . 25
Results 3.1 The Driven Free Particle . . . . . . . . . . . . 3.2 The Driven Simple Harmonic Oscillator . . . . 3.2.1 Strength of Driving Force . . . . . . . 3.2.2 Duration of Driving Force . . . . . . . 3.2.3 Frequency of Driving Force . . . . . . 3.3 The Driven Quartic Potential λ x4 . . . . . . . . 3.4 The Driven Morse and Pöschl-Teller Oscillators 3.4.1 Strength of Driving Force . . . . . . . 3.4.2 Duration of Driving Force . . . . . . . 3.4.3 Frequency of Driving Force . . . . . . 3.4.4 Anharmonicity Parameter . . . . . . . 3.4.5 Continuous (Sinusoidal) Driving Force 3.5 The Caldirola-Kanai Damped SHO . . . . . . .
. . . . . . . . . . . . .
26 28 33 34 45 52 59 64 65 74 82 91 99 102
Conclusion 4.1 Summary of Results . . . . . . . . . . . . . . . . . . . . . . . . . . . . . . . . . . 4.2 Discussion . . . . . . . . . . . . . . . . . . . . . . . . . . . . . . . . . . . . . . . 4.3 Future Research . . . . . . . . . . . . . . . . . . . . . . . . . . . . . . . . . . . .
108 108 110 111
. . . . . . . . . . . . .
. . . . . . . . . . . . .
. . . . . . . . . . . . .
. . . . . . . . . . . . .
. . . . . . . . . . . . .
. . . . . . . . . . . . .
. . . . . . . . . . . . .
. . . . . . . . . . . . .
. . . . . . . . . . . . .
. . . . . . . . . . . . .
. . . . . . . . . . . . .
. . . . . . . . . . . . .
. . . . . . . . . . . . .
. . . . . . . . . . . . .
. . . . . . . . . . . . .
. . . . . . . . . . . . .
. . . . . . . . . . . . .
. . . . . . . . . . . . .
A Wei-Norman Factorizations 112 A.1 Driven Free Particle . . . . . . . . . . . . . . . . . . . . . . . . . . . . . . . . . . 112 A.2 Driven Simple Harmonic Oscillator . . . . . . . . . . . . . . . . . . . . . . . . . 115 Bibliography
117
Index
120
List of Figures 3.1
Driving force, λ -varying . . . . . . . . . . . . . . . . . . . . . . . . . . . . . . . 27
3.2
FP Lyapunov, Eo -varying, λ = 0.005, ω f = ω . . . . . . . . . . . . . . . . . . . . 29
3.3
FP Lyapunov, Eo = 1, λ -varying, ω f = ω . . . . . . . . . . . . . . . . . . . . . . 31
3.4
FP Lyapunov, Eo = 10, λ -varying, ω f = ω
3.5
SHO phase, small Eo , λ = 0.005, ω f = ω . . . . . . . . . . . . . . . . . . . . . . 35
3.6
SHO transitions, small Eo , λ = 0.005, ω f = ω . . . . . . . . . . . . . . . . . . . . 37
3.7
SHO Lyapunov, small Eo , λ = 0.005, ω f = ω . . . . . . . . . . . . . . . . . . . . 39
3.8
SHO Lyapunov closer look, Eo = 1, λ = 0.005, ω f = ω
3.9
SHO phase, large Eo , λ = 0.005, ω f = ω . . . . . . . . . . . . . . . . . . . . . . 42
. . . . . . . . . . . . . . . . . . . . . 32
. . . . . . . . . . . . . . 40
3.10 SHO transitions, large Eo , λ = 0.005, ω f = ω . . . . . . . . . . . . . . . . . . . . 43 3.11 SHO Lyapunov, large Eo , λ = 0.005, ω f = ω . . . . . . . . . . . . . . . . . . . . 44 3.12 SHO phase, Eo = 1, λ -varying, ω f = ω . . . . . . . . . . . . . . . . . . . . . . . 46 3.13 SHO transitions, Eo = 1, λ -varying, ω f = ω . . . . . . . . . . . . . . . . . . . . . 47 3.14 SHO Lyapunov, Eo = 1, λ -varying, ω f = ω . . . . . . . . . . . . . . . . . . . . . 49 3.15 SHO phase, Eo = 10, λ -varying, ω f = ω
. . . . . . . . . . . . . . . . . . . . . . 50
3.16 SHO transitions, Eo = 10, λ -varying, ω f = ω . . . . . . . . . . . . . . . . . . . . 51 3.17 SHO Lyapunov, Eo = 10, λ -varying, ω f = ω . . . . . . . . . . . . . . . . . . . . 53 3.18 SHO phase, Eo = 1, λ = 0.005, ω f -varying . . . . . . . . . . . . . . . . . . . . . 54 vi
LIST OF FIGURES
vii
3.19 SHO transitions, Eo = 1, λ = 0.005, ω f -varying . . . . . . . . . . . . . . . . . . . 56 3.20 SHO Lyapunov, Eo = 1, λ = 0.005, ω f -varying . . . . . . . . . . . . . . . . . . . 57 3.21 SHO phase, Eo = 10, λ = 0.005, ω f -varying . . . . . . . . . . . . . . . . . . . . 58 3.22 SHO transitions, Eo = 10, λ = 0.005, ω f -varying . . . . . . . . . . . . . . . . . . 60 3.23 SHO Lyapunov, Eo = 10, λ = 0.005, ω f -varying . . . . . . . . . . . . . . . . . . 61 3.24 Classical Duffing Phase/Lyapunov, Eo -varying, ω f = 1 . . . . . . . . . . . . . . . 62 3.25 AO phase, small Eo , λ = 0.005, ω f = ω, χ = −0.025 . . . . . . . . . . . . . . . . 66 3.26 AO transitions, small Eo , λ = 0.005, ω f = ω, χ = −0.025 . . . . . . . . . . . . . 67 3.27 AO Lyapunov, small Eo , λ = 0.005, ω f = ω, χ = −0.025 . . . . . . . . . . . . . 69 3.28 AO phase, large Eo , λ = 0.005, ω f = ω, χ = −0.025 . . . . . . . . . . . . . . . . 70 3.29 AO transitions, large Eo , λ = 0.005, ω f = ω, χ = −0.025 . . . . . . . . . . . . . 71 3.30 AO Lyapunov, large Eo , λ = 0.005, ω f = ω, χ = −0.025 . . . . . . . . . . . . . . 73 3.31 AO phase, Eo = 1, λ -varying, ω f = ω, χ = −0.025 . . . . . . . . . . . . . . . . . 75 3.32 AO transitions, Eo = 1, λ -varying, ω f = ω, χ = −0.025 . . . . . . . . . . . . . . 76 3.33 AO Lyapunov, Eo = 1, λ -varying, ω f = ω, χ = −0.025 . . . . . . . . . . . . . . . 77 3.34 AO phase, Eo = 10, λ -varying, ω f = ω, χ = −0.025 . . . . . . . . . . . . . . . . 79 3.35 AO transitions, Eo = 10, λ -varying, ω f = ω, χ = −0.025 . . . . . . . . . . . . . . 80 3.36 AO Lyapunov, Eo = 10, λ -varying, ω f = ω, χ = −0.025 . . . . . . . . . . . . . . 81 3.37 AO phase, Eo = 1, λ = 0.005, ω f -varying, χ = −0.025 . . . . . . . . . . . . . . . 83 3.38 AO transitions, Eo = 1, λ = 0.005, ω f -varying, χ = −0.025 . . . . . . . . . . . . 84 3.39 AO Lyapunov, Eo = 1, λ = 0.005, ω f -varying, χ = −0.025 . . . . . . . . . . . . . 86 3.40 AO phase, Eo = 10, λ = 0.005, ω f -varying, χ = −0.025 . . . . . . . . . . . . . . 87 3.41 AO transitions, Eo = 10, λ = 0.005, ω f -varying, χ = −0.025 . . . . . . . . . . . . 88 3.42 AO Lyapunov, Eo = 10, λ = 0.005, ω f -varying, χ = −0.025 . . . . . . . . . . . . 90 3.43 AO phase, Eo = 1, λ = 0.005, ω f = ω, χ-varying . . . . . . . . . . . . . . . . . . 92
LIST OF FIGURES
viii
3.44 AO transitions, Eo = 1, λ = 0.005, ω f = ω, χ-varying . . . . . . . . . . . . . . . 93 3.45 AO Lyapunov, Eo = 1, λ = 0.005, ω f = ω, χ-varying . . . . . . . . . . . . . . . . 95 3.46 AO phase, Eo = 10, λ = 0.005, ω f = ω, χ-varying . . . . . . . . . . . . . . . . . 96 3.47 AO transitions, Eo = 10, λ = 0.005, ω f = ω, χ-varying . . . . . . . . . . . . . . . 97 3.48 AO Lyapunov, Eo = 10, λ = 0.005, ω f = ω, χ-varying . . . . . . . . . . . . . . . 98 3.49 AO phase, Eo -varying, λ = 0, ω f = ω, χ = −0.025 . . . . . . . . . . . . . . . . . 100 3.50 AO transitions, Eo -varying, λ = 0, ω f = ω, χ = −0.025 . . . . . . . . . . . . . . 101 3.51 AO Lyapunov, Eo -varying, λ = 0, ω f = ω, χ = −0.025 . . . . . . . . . . . . . . . 103 3.52 AO Lyapunov, Eo -varying near chaos points, λ = 0, ω f = ω, χ = −0.025 . . . . . 104 3.53 CK Lyapunov, Eo = 1, λ = 0.005, ω f = ω, γ-varying . . . . . . . . . . . . . . . . 106
Chapter 1 Introduction 1.1
Background
This work is about quantum dynamics, the study of how quantum systems evolve in time. Time evolution of quantum systems is a topic of continuing importance in physics research. Scientists look for ways to map out how tiny systems will behave over time when acted upon by external forces [1]. There are many different methods that can be employed to treat quantum dynamical systems; some of these methods includes Fourier transforms, numerical solvers, and sudden, adiabatic or perturbative approximations [2]. Ehrenfest’s theorem can be used to take a semiclassical approach to solving for quantum dynamics (see Sec. 2.2). Also, algebraic structures of the dynamics can be used to simplify the calculations, and in particular Lie algebras can be used to reduce the partial-differential Schrödinger equation into a system of coupled ordinary differential equations (see Sec. 2.4). The topic of quantum chaos, or the manifestation of classical chaos in quantum systems, is also a matter of great interest in physics research [3] [4]. The correspondence between classical and quantum chaos has proven problematic because of the seemingly incompatible definitions of
1
1.2 Objectives
2
quantum uncertainty and loss of predictability. Chaos in classical systems is well understood. It would be of great value to have a way of treating quantum chaos using classical approaches, which often involve the measurement of exact trajectories. By combining the properties of quantum dynamics with the conditions and approaches of the treatment of classical chaos, we will be able to answer questions about the time evolution of quantum systems that would otherwise be difficult to address. The Lie algebra method in particular provides a useful bridge between quantum dynamics and chaos. Although references to chaos and Lie algebra can be found [5] [6], the approaches taken in these studies are different from the method developed here, and their relevance to my work is not immediately apparent. My contribution answers questions about chaos and quantum dynamics in a specific way that I have not seen elsewhere.
1.2
Objectives
My objective is to solve for the time evolution of quantum dynamical systems. I will use a semiclassical ansatz to reduce the dynamics of a quantum system to a time-dependent shift in coordinate and a time-dependent quantum phase. I will also employ an ansatz for the time evolution operator in terms of a Lie algebra basis, and then I will use the commutation relations of that basis to reduce the PDE to a system of coupled ODE’s. My second objective is to study the properties of a given quantum system and look for signs of chaos using classical criteria. I will accomplish this by calculating phase-space trajectories and Lyapunov exponents for the solutions of the coupled ODE’s. I will also calculate energy level transition probabilities in order to characterize how the system responds over time to a given driving force.
1.3 Outline
1.3
3
Outline
Sec. 2.2 gives a description of a semiclassical analytic method for solving quantum dynamics, which was recently proposed by Andrews [7]. I will apply this method to two simple but exemplary systems: the driven free particle (FP), and the driven simple harmonic oscillator (SHO). Finally I will discuss the extent and limits of the efficacy of this method. Sec. 2.3 gives the definition of an "algebra" and explains some of its properties. It then specifically discusses Lie algebras and their properties. Sec. 2.4 shows how a Lie algebra can be used to solve for the time evolution of a quantum dynamical system. This is done for the driven FP and the driven SHO. This Lie algebra method gives directly useful information about a quantum system, such as expectation values and transition probabilities. The meaning of "chaos" and "quantum chaos" is briefly reviewed in Sec. 2.5. I will discuss how to calculate and interpret Lyapunov exponents as a criterion for chaos. Chapter 3 discusses specific quantum systems, all driven by a Gaussian pulse driving force. Sec. 3.1 studies the FP and its Lyapunov exponents. Next, Sec. 3.2 calculates the phase-space trajectories, transition probabilities, and Lyapunov exponents of a driven SHO. Sec. 3.3 shows how to approach a quartic anharmonic potential problem and gives some example plots for the equivalent classical system. Sec. 3.4 will then repeat what was done for the SHO but with a driven anharmonic oscillator. Sec. 3.5 will take a brief look at the Caldirola-Kanai damped SHO and its Lyapunov exponents. In the concluding Chapter 4 we will argue that these methods are powerful and allow for the detailed study of the properties of dynamical systems in time. In particular, the Lie algebra method allows us to distinguish between systems with and without chaotic behavior. I will then briefly remark on some of the difficulties I had while completing this research, and will finally state some future goals and directions to which this research may lead. An appendix contains the explicit factorization of the free particle and simple harmonic oscil-
1.3 Outline lator time derivatives of the Wei-Norman Lie algebra parameters.
4
Chapter 2 Methods 2.1
The Time-Dependent Hamiltonian
The Schrödinger equation is used to determine how quantum systems evolve in time: i¯h
∂ ψ(x,t) = H (x, p,t)ψ(x,t), ∂t
(2.1)
where H (x, p,t) is the Hamiltonian of the system and ψ(x,t) is the wave function . Once Eq. (2.1) has been solved, ψ(x,t) can be used to determine important properties of the system, such as its energy, position, and the energy transitions or position evolution as time progresses. These characteristics in turn inform us about the nature of the system. For instance, in this work we’ll be interested in discovering what the transitions and trajectories can teach us about the chaotic nature of some anharmonic oscillators. For a system with a time-independent Hamiltonian H (x, p) (with p =
h¯ ∂ i ∂ x ),
Eq. (2.1) can be
easily solved by the separation of variables x and t, as is often demonstrated in quantum textbooks [8]. However, for a system with a time-dependent Hamiltonian H (x, p,t), separation of variables usually doesn’t work. Some other method must be employed to deal with this general case.
5
6
2.2 A Semi-Classical Ansatz
2.2
A Semi-Classical Ansatz
One interesting method for treating forced quantum dynamical systems has been proposed by Andrews [7]. In this paper it is shown that a spatially-uniform, time-dependent driving force f (t) acting on a quantum system results in two simple effects: a time-dependent shift in the coordinate, x(t), ¯ such that x → ξ = x − x, ¯
(2.2)
and a time-dependent phase shift of the wavefunction θ (x,t). The ansatz is that the wave function will have the form ψ(x,t) = exp[iθ (x,t)]Ψ(x − x(t),t), ¯
(2.3)
where Ψ(x,t) is the wave function of the system when no forcing occurs. In what follows, I will refer to this method as the "Andrews method" for the sake of clarity. I will not repeat the derivation of this method, but will refer the reader to the paper [7]. In Sec. 2.4 I will directly compare the Andrews method results with those of the Lie algebra method, which I develop in Sec. 2.4.1.
2.2.1
Ehrenfest’s Theorem
According to Ehrenfest’s theorem [9], the expectation values of position and momentum correspond to the trajectories of a classical particle in a similar potential. A particle’s shift in position due to a driving force will therefore be given by the difference of the semiclassical trajectories, i.e., the trajectories of the expectation values obtained using quantum mechanics. The term x(t) ¯ in Eq. (2.3) is found to be the difference in position expectation values of the forced system hxiψ (t) and unforced system hxiΨ (t), x(t) ¯ = hxiψ (t) − hxiΨ (t),
(2.4)
where x is the position operator, multiplicative in the coordinate representation, as can be verified by explicit calculation.
7
2.2 A Semi-Classical Ansatz
The quantum phase shift from the force will depend on the shift in momentum p(t), ¯ which is necessarily the difference in momentum expectation values of the forced and unforced systems, p(t) ¯ = hpiψ − hpiΨ .
(2.5)
This shift in momentum is related to the quantum phase shift by the equation p(t) ¯ = h¯ ∂ θ∂(x,t) x , which can be integrated with respect to x to give 1 θ (x,t) = ( p(t)x ¯ − β (t)). h¯
(2.6)
The term β (t) is a constant of integration determined by substituting our ansatz Eq. (2.3) into Eq. (2.1). As it turns out, β (t) is equal to the action of the unforced system, found by taking the time integral of the classical Lagrangian . The values of x(t) ¯ and p(t) ¯ are determined by the classical Hamiltonian equations of motion, x˙¯ =
∂H , ∂ p¯
p˙¯ = −
∂H , ∂ x¯
(2.7) (2.8)
subject to initial conditions x(0) ¯ = p(0) ¯ = 0.
(2.9)
I will now show the Andrews method in action for a couple of cases with general driving force: a forced free particle and a forced simple harmonic oscillator.
2.2.2
The Free Particle
Let’s first take a look at the free particle (FP) system . The Hamiltonian of a driven FP is given by pˆ2 H = − f (t)xˆ 2m
(2.10)
for some arbitrary time-dependent force f (t). The classical equations of motion for x(t) ¯ and p(t), ¯ ˙¯ = as determined with the coordinate and momentum operators by Eq. (2.10), are x(t)
1 ¯ m p(t)
and
8
2.2 A Semi-Classical Ansatz
˙¯ = f (t). These equations, taken with the initial conditions as given in Eq. (2.9), can be solved p(t) to give 1 x(t) ¯ = m
Z t Z t0 0
f (t”)dt”dt 0 =
0
Z t
p(t) ¯ =
F1 (t) , m
f (t 0 )dt 0 = F(t),
(2.11a) (2.11b)
0
where F(t) is the time integral of the force and F1 (t) is the time integral of F(t). We plug these solutions into Eq. (2.3) to get the following explicit expression for our ansatz: i F1 (t) ψ(x,t) = exp[ (F(t)x − β (t))]Ψ(x − ,t). h¯ m
(2.12)
To solve for β (t) we substitute Eq. (2.12) into Eq. (2.1), make a change of variables ξ = x − F1m(t) (as seen in Eq. (2.2)), and simplify to get � � h¯ 2 ∂ 2 Ψ(ξ ,t) ∂ F(t)2 ∂ β (t) − Ψ(ξ ,t). i¯h Ψ(ξ ,t) = − + ∂t 2m ∂ ξ 2 2m ∂t
(2.13)
The first two terms correspond to the undriven FP Schrödinger equation for Ψ(ξ ,t), and they cancel out. When we solve the remainder for β , we get β (t) =
1 2m
Z t 0
F(t 0 )2 dt 0 = F2 (t).
(2.14)
We can now express the time-dependent wave function of the forced FP system in terms of F(t), F1 (t), and F2 (t), which can be easily determined for any given time-dependent driving force f (t).
2.2.3
The Simple Harmonic Oscillator
To apply the Andrews method to the simple harmonic oscillator (SHO), we follow the same procedure as with the FP. It just takes a little more algebra work to get the solutions. The SHO Hamiltonian is given by H =
pˆ2 1 + mω 2 xˆ2 − f (t)x, ˆ 2m 2
(2.15)
9
2.2 A Semi-Classical Ansatz
where ω is the angular frequency of the oscillator. The classical Hamiltonian equations of motion, defined by Eq. (2.7) and Eq. (2.8) are x˙¯ =
p¯ , m
(2.16)
p˙¯ = −mω 2 x¯ + f (t),
(2.17)
and the initial conditions are given by Eq. (2.9). These equations can be solved with a Fourier transform or a Green’s function to get the following integral expressions: 1 x(t) ¯ = mω
Z t
S(t) , mω
(2.18a)
f (t 0 )cos[ω(t − t 0 )]dt 0 ≡ C(t).
(2.18b)
f (t 0 )sin[ω(t − t 0 )]dt 0 ≡
0
Z t
p(t) ¯ = 0
We now solve for β (t) as we did for the FP system, by substituting the ansatz into Eq. (2.1), performing a change of variables ξ = x − S(t) mω , and simplifying. After some algebra we are left with � � ∂ h¯ 2 ∂ 2 Ψ(ξ ,t) 1 C(t)2 S(t)2 dβ (t) 2 2 i¯h Ψ(ξ ,t) = − − − Ψ(ξ ,t). (2.19) + mω x Ψ(ξ ,t) + ∂t 2m ∂ ξ 2 2 2m 2m dt When we cancel out the terms for the undriven SHO Schrödinger equation and simplify we recover the following: 1 2 p¯2 1 dβ = [C − S2 ] = − mω 2 x¯2 . dt 2m 2m 2
(2.20)
To solve this, we can take advantage of a useful identity. By multiplying Eq. (2.16) by p, ¯ Eq. (2.17) by x, ¯ and then adding them together, we get the following: d(x¯ p) ¯ p¯2 = − mω 2 x¯2 + f (t)x. ¯ dt m
(2.21)
We substitute this into Eq. (2.24) to get dβ 1 d(x¯ p) ¯ = [ − f (t)x], ¯ dt 2 dt
(2.22)
which can then be integrated with respect to time to give us 1 1 β (t) = x(t) ¯ p(t) ¯ − 2 2
Z t 0
f (t 0 )x(t ¯ 0 )dt 0 ,
(2.23)
10
2.2 A Semi-Classical Ansatz or, in terms of C(t) and S(t), C(t)S(t) 1 β (t) = − 2mω 2mω
Z t
f (t 0 )S(t 0 )dt 0 .
(2.24)
0
We can now express the time-dependent wave function of the forced system in terms of a couple of functions, S(t) and C(t), which can be determined for an arbitrary driving force f (t). As in the FP case, this approach works equally well for any spatially-uniform force that is turned on at t = 0. Also, the solutions we get are exact, as no approximations were required.
2.2.4
Extensions And Limits
The Andrews method is valid for any single or multi-dimensional isotropic system with a Hamiltonian that is at most quadratic in coordinate and momentum. Given a Hamiltonian of the form 1 1 1 ˆ + c(t)ˆx2 + f(t) · pˆ + g(t) · xˆ , Hˆ = a(t)pˆ 2 + b(t)(pˆ · xˆ + xˆ · p) 2 2 2
(2.25)
where a(t), b(t), c(t), and f(t) are coefficients of arbitrary time dependence and g(t) is the driving force of the system, the equations of motion to determine x¯ and p¯ are the following: ¯ + b(t)¯x(t) + f(t), x˙¯ (t) = a(t)p(t)
(2.26a)
˙¯ = b(t)p(t) ¯ + c(t)¯x(t) + g(t). −p(t)
(2.26b)
Finally, β (t) is determined by taking the time integral of the Lagrangian of the classical system, i.e. the action of the system: 1 1 β˙ (t) = a(t)pˆ 2 − c(t)ˆx2 − g(t) · xˆ . 2 2
(2.27)
The ansatz solution for the wavefunction of the forced system will take the same form as in Eq. (2.3) and (2.6), but for x¯ and p¯ as vectors instead of scalars [7]. For systems with Hamiltonians that are higher order than quadratic in position and momentum, some approximation must be made to restore linearity to the classical equations of motion. This
11
2.3 Algebraic Structures
would apply to anharmonic oscillators of the type we study in Chapter 3. A similar problem is encountered when employing the Lie algebra method, as will be discussed in Sec. 2.4.3. As an example of such a system, consider Schrödinger’s equation with a quartic potential of the form
i¯h
∂ −¯h2 ∂ 2 1 ψ= ψ + mω 2 x2 ψ + λ x4 ψ − f (t)xψ. 2 ∂t 2m ∂ x 2
(2.28)
To solve this system using the Andrews ansatz we must solve for the "classical" trajectory using the Hamilton equations of motion. The Hamiltonian of the system is given by H =
pˆ2 1 + mω 2 xˆ2 + λ xˆ4 − f (t)x. ˆ 2m 2
(2.29)
From the Hamiltonian we can find the classical equations of motion used to solve x¯ and p: ¯ x˙¯ = p˙¯ = −
∂H p¯ = , ∂ p¯ m
∂H = −mω 2 x¯ − 4λ x¯3 + f (t). ∂ x¯
(2.30) (2.31)
The coupled equations can be rewritten as a single, second-order differential equation: m
d 2 x¯ = −mω 2 x¯ − 4λ x¯3 + f (t). dt 2
(2.32)
For sinusoidal f (t), Eq. (2.32) is known as the Duffing equation, and in general cannot be solved analytically. When solved using numerical methods, the solution exhibits chaos depending on the strength of f (t), as will be discussed in Sec. 2.5.4 and demonstrated in Sec. 3.3.
2.3
Algebraic Structures
2.3.1
Properties of Algebras
The partial differential Schrödinger equation, Eq. (2.1), can also be solved by using Lie algebras. In this way, as will be shown in Sec. 2.4, a second-order partial differential equation can be turned
2.3 Algebraic Structures
12
into a system of coupled first-order ordinary differential equations. Lie algebras appear quite often in physics, though they’re not always referred to as such [10]. Lie algebras are a type of algebraic structure. I now will give a brief explanation of what that means. In general, an algebra is a set of elements for which one or more binary operations are defined. Binary operations combine two elements of the set and give one element back; some common examples include the operations of addition, subtraction, multiplication, and division that define the "elementary algebra" of the real number set, which is probably the most familiar type of algebra to non-mathematicians. An identity element of a binary operation, when combined with any element, returns the original element; some examples of identity elements are 0 for addition (A + 0 = A for any A) and 1 for multiplication (A ∗ 1 = A). An element A of an algebra may have an inverse, which when combined with the element will yield the identity: A + (−A) = 0, A ∗ (A−1 ) = 1, etc. An operation is said to be associative when the order in which two or more operations are carried out doesn’t matter, as long as the order of the elements stays the same. Some examples of associative operations are addition ((A + B) + C = A + (B + C)) and multiplication ((A ∗ B) ∗ C = A ∗ (B ∗ C)). By contrast, the property of commutativity says that the order of the elements themselves doesn’t matter. In elementary algebra the operations of addition and multiplication are commutative, or in other words they "commute," (i.e. A + B = B + A, A ∗ B = B ∗ A). For some sets of elements, commutivity of multiplication is not required, as will be discussed in Sec. 2.3.2. One more important property of algebraic structures is closure. A "closed" set is one such that a binary operation of any two elements of the set will yield another element of the set. A set must be closed in order to form an algebra. As an example, consider the set of vectors confined to the xy-plane,~r = (x, y): this set is closed under any operation that returns another vector confined to the xy-plane, which is true for the operation of addition: ~r1 +~r2 = (x1 , y1 )+(x2 , y2 ) = (x1 +x2 , y1 +y2 ). An operation such as a cross product (×), however, would not be closed for this set: ~r1 ×~r2 =
13
2.3 Algebraic Structures
(x1 , y1 ) × (x2 , y2 ) = (0, 0, x1 ∗ x2 − y1 ∗ y2 ). before the cross product operation can be defined, the set must be extended beyond the xy-plane to include z components. These properties or axioms are taken together to define a group. In general, a group is a set of elements and an operation with the following properties: (a) an identity, (b) an inverse, (c) associativity, and (d) closure. An Abelian group has the additional property of commutativity. Lie groups, which may or may not be Abelian, will be discussed in Sec. 2.4.
2.3.2
Lie Algebras
A Lie algebra is a vector space with an antisymmetric binary operation, such as a commutator. A commutator is written as square brackets with two elements separated by a comma [∗, ∗] and is taken to be the difference of products of two elements with the order of the elements in the second product reversed: [A, B] = A ∗ B − B ∗ A.
(2.33)
Two elements are said to commute if their commutator is zero. Lie algebras and Lie groups appear quite often in the field of physics [11] [12]. Some examples of Lie algebras include the three-dimensional Euclidian space R3 , with the commutator defined as the cross product of vectors. Another example of a Lie algebra is the set of n × n anti-Hermitian matrices. In quantum physics, the angular momentum operators and their commutators form a Lie algebra. In Sec. 2.4 we will make use of the property that a Hamiltonian sometimes can be expressed as a sum of elements of a Lie algebra. In this way, the time evolution of the system can be determined.
14
2.4 Solving for Time Evolution with Lie Algebras
2.4
Solving for Time Evolution with Lie Algebras
The equation which is used to determine the time evolution of a quantum system has the Schrödinger form i¯h
∂U(t) . = H U(t), ∂t
(2.34)
. where U(t) is the time evolution operator and H is the Hamiltonian. The dotted equal sign = will be used to designate an operator equation. For an evolution operator with inverse U −1 (t), Eq. (2.34) can be written as i¯h
∂U(t) −1 . U (t) = H , ∂t
(2.35)
and the equation can be solved for specific Hamiltonians in the right-hand side by manipulating the structure of the evolution operator U(t) in the left-hand side.
2.4.1
The Wei-Norman Ansatz
J. Wei and E. Norman proposed a product form [13] for the operator U, . N αi (t)Hi U(t) = ∏ e ,
(2.36)
i=1
where αi (t) are a set of time-dependent, complex, scalar parameters to be determined, and Hi are the basis elements of a Lie algebra A , chosen to include all the terms of the Hamiltonian H . A = {H1 , .., HN } .
(2.37)
The elements Hi in Eq. (2.36) do not necessarily commute, so care must be taken when applying the partial time derivative and the inverse operator in Eq. (2.35), as will be mentioned in Sec. 2.4.5. These basis elements are chosen based on a Hamiltonian of the form N
. H = ∑ bi (t)Hi , i=1
(2.38)
15
2.4 Solving for Time Evolution with Lie Algebras
with coefficients bi (t). Some of the bi (t) may be zero without necessarily implying that the corresponding αi (t) vanish. The total time evolution operator U(t), which is an exponential mapping of the algebra A , is a representation of the Lie group corresponding to that algebra. The next step is to factorize the
∂U(t) −1 ∂t U (t)
term in the left-hand side of (2.35). This is done
by taking the time derivative of U(t), one exponential term at a time, and then using the BakerCampbell-Hausdorff identity to simplify (see Eq. (A.6)). A step-by-step explanation of this process can be found in Appendix A. In the end we are left with an equation of the form N
N
. i¯h ∑ gi (α˙1 (t), .., α˙N (t), α1 (t), .., αN (t)) Hi = ∑ bi (t)Hi , i
(2.39)
i
where gi (α˙1 (t), .., α˙N (t), α1 (t), .., αn (t)) are functions of the αi parameters and their time derivatives. The next step is the equate the coefficients of each algebra element, which yields a set of coupled first-order ordinary differential equations gi (α˙1 (t), .., α˙N (t), α1 (t), .., αn (t)) = bi (t), one for each Hi . These can be solved to determine the values of the αi (t).
2.4.2
Choosing an Algebra Basis
To minimize the work, the chosen Lie algebra basis should be the smallest algebra which includes every term in the Hamiltonian. This means that a smaller or more workable Lie algebra can sometimes be chosen by rewriting the Hamiltonian. A given Hamiltonian may be expressed in several different forms. For example, oscillator dynamics can be written in terms of the coordinate operator x and its derivatives
∂ ∂x
and
∂2 , ∂ x2
or in terms of the creation and annihilation (ladder) operators
(a† and a, respectively) and the number operator N = a† a. Consider a simple harmonic oscillator whose Hamiltonian can be written in terms of the number operator, 1 . H = h¯ ω(N + ). 2
(2.40)
. The corresponding algebra for this Hamiltonian, written as in Eq. (2.37), would be A = {N, 1}.
16
2.4 Solving for Time Evolution with Lie Algebras Now, consider a simple harmonic oscillator with an added driving force: r 1 h¯ . H = h¯ ω(N + ) − f (t) (a + a† ). 2 2mω
(2.41)
The Lie algebra basis as chosen before no longer includes all the terms in the Hamiltonian. The basis must be extended to include a and a† : n o . A = a† , a, N, 1 .
(2.42)
This new closed set forms an algebra which covers every term in the Hamiltonian defined in Eq. (2.41).
2.4.3
Closure Under Commutation
As mentioned in Sec. 2.3, an operation between any two elements of a set must be closed for the set to constitute an algebra. For Lie algebras this means that any non-vanishing commutator of any two algebra elements must also be an element of the algebra. To determine if a chosen set maintains closure, take the commutator of every possible two-element combination in the set. As an example, consider the commutators for the algebra given in Eq. (2.42): . . . [1, a] = 0, [1, a† ] = 0, [1, N] = 0,
(2.43)
. . . [a, a† ] = 1, [a, N] = a, [a† , N] = −a† .
(2.44)
The result of every commutator is itself an element of the set, which means that the set is closed. It may be necessary to add terms to the basis that aren’t found in the Hamiltonian to ensure closure.
2.4.4
Normal Ordering
The Wei-Norman ansatz gives flexibility in choosing the order of the exponentials, but some choices lead to considerable simplification. When working with products of creation and annihilation operators, the most convenient order is with the creation operators a† to the left of the
2.4 Solving for Time Evolution with Lie Algebras
17
annihilation operators a. This arrangement is known as "normal ordered," and its convenience comes from the fact that annihilation operators acting on ground-state kets |0i and creation operators acting on ground-state bras h0| will both equal zero:
2.4.5
h0|a† = 0,
(2.45)
a|0i = 0.
(2.46)
Unitarity
The time-evolution operator defined in Eq. (2.36) is assumed to be a unitary operator for systems of "closed" quantum Hamiltonians (here closed is meant in the physical and not algebraic sense). When a quantum system is no longer closed, i.e. when it is in contact with an external heat bath or includes factors for internal losses, the time-evolution operator will no longer be unitary. This can be seen when looking at quantum systems with damping factors, such as the Caldirola-Kanai Hamiltonian that will be encountered in Sec. 3.5. As long as the Hamiltonian under consideration is closed to its environment and real-valued, the unitarity of the evolution operator is assured. For a unitary U(t) its inverse must equal its . Hermitian conjugate, U † = U −1 . Relationships between the αi parameters of the Lie algebra basis can be determined from this condition. As an example, for the algebra defined in Eq. (2.42) we get † . U(t) = eα1 (t)a eα2 (t)a eα3 (t)N eα4 (t)1 .
(2.47)
. By setting U(t)−1 = U(t)† , the following identities for the real and imaginary parts of the αi
2.4 Solving for Time Evolution with Lie Algebras
18
parameters can be determined: ℜ {α1 (t)} = −ℜ {α2 (t)}
(2.48a)
ℑ {α1 (t)} = ℑ {α2 (t)}
(2.48b)
ℜ {α3 (t)} = 0
(2.48c)
1 1 ℜ {α4 (t)} = − |α1 |2 = − |α2 |2 . 2 2
(2.48d)
These relations have been confirmed by actual data (see Chapter 3). Systems for which the timeevolution operator is not unitary are still solved in the same way. The only requirement to get from Eq. (2.34) to Eq. (2.35) is that U(t) have an inverse (which may or may not equal its Hermitian conjugate).
2.4.6
The Free Particle
The time evolution operator for a free particle with a driving force is given by solving Eq. (2.34), where the Hamiltonian of the system is h¯ 2 ∂ 2 . . H =− − f (t)x = H0 − f (t)x. 2 2m ∂ x
(2.49)
We can construct a Lie algebra to contains this Hamiltonian, ∂ ∂2 . A = {1, x, , 2 }, ∂x ∂x
(2.50)
with which we can propose an ansatz for the evolution operator in terms of the Wei-Norman representation of the Lie group corresponding to the chosen algebra: 2 ∂ α (t) ∂ . U = eα1 (t) eα2 (t)x eα3 (t) ∂ x e 4 ∂ x2 ,
(2.51)
with complex, time-dependent parameters αi (t) (i = 1...4). We can take the inverse of the evolution operator to get i¯h[
∂ . U(t)]U(t)−1 = H ∂t
(2.52)
19
2.4 Solving for Time Evolution with Lie Algebras
⇒ i¯h [
2 ∂ α1 (t) α2 (t)x α3 (t) ∂ α4 (t) ∂ 22 h¯ 2 ∂ 2 −α4 (t) ∂ 2 −α3 (t) ∂ −α2 (t)x −α1 (t) . ∂x e ∂x e ∂ x )](e ∂x e (e e e e )=− − f (t)x. ∂t 2m ∂ x2 (2.53)
The factorization of the left-hand side of this expression is worked out in Sec. A.1 of Appendix A. By equating the Lie algebra elements in Eq. (A.15) with the Hamiltonian, we recover the following set of four coupled first-order differential equations, one for each basis element of the algebra: α˙1 (t) = α˙3 (t)α2 (t) − α˙4 (t)α2 (t)2 α˙2 (t) =
i f (t) h¯
α˙3 (t) = 2α˙4 (t)α2 (t) α˙4 (t) =
i¯h , 2m
(2.54) (2.55) (2.56) (2.57)
which can be solved to give � �2 � Z � Z t0 i 1 t i α1 (t) = − f (t”)dt” dt 0 = − β (t) h¯ 2m 0 h¯ 0 �Z t � i i 0 0 α2 (t) = f (t )dt = p(t) ¯ h¯ 0 h¯ � � � Z t � Z t0 1 α3 (t) = − f (t”)dt” dt 0 = −x(t) ¯ m 0 0 � � i¯ht i −¯h2 α4 (t) = =− t, 2m h¯ 2m
(2.58)
(2.59) (2.60) (2.61)
where the solutions have been simplified by using the functions defined in Sec. 2.2.2 to replace the terms in the square brackets. The total time evolution operator can now be written, h¯ 2 ∂ 2 i . − h¯i β (t) h¯i p(t)x ¯ −x(t) ¯ ∂∂x − h¯ (− 2m ∂ x2 )t U(t) = e e e e
i ∂ . = eiθ (x,t) e−x¯ ∂ x e− h¯ H0t ,
with θ (x,t) = h1¯ ( p(t)x ¯ − β (t)).
(2.62) (2.63)
20
2.4 Solving for Time Evolution with Lie Algebras
To show that the Andrews method solution Eq. (2.3) can be recovered, choose an initial wave function Ψ(x, 0) for a free particle with no driving force at t = 0. To evolve this wave function in time, apply the evolution operator U(t) one exponent at a time: e− h¯ H0t Ψ(x, 0) = Ψ(x,t) i
(2.64)
∂
2.4.7
e−x¯ ∂ x Ψ(x,t) = Ψ(x − x,t) ¯
(2.65)
⇒ ψ(x,t) = eiθ (x,t) Ψ(x − x,t). ¯
(2.66)
The Simple Harmonic Oscillator
The Hamiltonian of a driven quantum simple harmonic oscillator is given by . H = H0 − f (t)x, . where H0 =
−¯h2 ∂ 2 2m ∂ x2
(2.67)
+ 21 mω 2 x2 . This can be rewritten in terms of raising and lowering operators, 1 . H0 = h¯ ω(N + ) − g(t)(a + a† ), 2
. with N = a† a, g(t) =
q
h¯ 2mω
f (t), and where we’ve employed the relation x =
(2.68) q
h¯ † 2mω (a + a ).
In order to determine the effects of the driving force on the time evolution of the system we must use this Hamiltonian to solve for the evolution operator U(t). We will use the ansatz given by Eq. (2.47): i¯h [
† ∂ α1 (t)a† α2 (t)a α3 (t)N α4 (t) 1 (e e e e )](e−α4 (t) e−α3 (t)N e−α2 (t)a e−α1 (t)a ) = h¯ ω(N + ) − g(t)(a + a† ). ∂t 2 (2.69)
The factorization of the left-hand side of this expression is worked out in Sec. A.2 of Appendix A. By equating the Lie algebra elements in Eq. (A.25) with the Hamiltonian, we recover the following set of four coupled first-order differential equations, one for each basis element of the algebra: i i α˙1 (t) = α˙3 (t)α1 (t) + g(t) = −iωα1 (t) + g(t) h¯ h¯
(2.70)
21
2.4 Solving for Time Evolution with Lie Algebras i i α˙2 (t) = α˙3 (t)α2 (t) + g(t) = iωα2 (t) + g(t) h¯ h¯
(2.71)
α˙3 (t) = −iω
(2.72)
α˙4 (t) = α˙3 (t)α2 (t)α1 (t) + α˙2 (t)α1 (t) − i These can be solved using an integrating factor e±
R
i h¯ ω ω = (g(t)α1 (t) − ) 2 h¯ 2
(2.73)
iωdt
i t −iω(t−t 0 ) 0 0 e g(t )dt α1 (t) = h¯ 0 Z i t iω(t−t 0 ) 0 0 α2 (t) = e g(t )dt h¯ 0 Z
α3 (t) = −iωt � � Z Z t0 1 t 0 iωt −iω(t 0 −t”) α4 (t) = − 2 g(t ) e g(t”)dt” dt 0 − 2 0 h¯ 0
(2.74) (2.75) (2.76) (2.77)
As in Sec. 2.4.6, agreement can be shown between the parameter solutions found using Lie algebra and the solution via Andrews method found in Sec. 2.2.3.
2.4.8
Mean Field Approximations to Ensure Closure
When using the Lie algebra method for the FP and SHO systems, obtaining a closed set of generators is straightforward. For more complicated systems, whose Hamiltonians have terms of higher order algebra elements (such as N 2 ), it may be difficult to find a set of elements that closes without requiring a larger (but still finite) number of elements. This problem may be mitigated by making a mean field approximation on the Hamiltonian. The process is simple: For some operator P, the value of P2 may be approximated as hPi P, where hPi is the expectation value of P. Any algebra being made from the Hamiltonian will only have to include P, not P2 , and hPi will simply be a coefficient of P. In the case where hPi is timedependent, this is known as a "dynamical mean field" approximation. This type of approximation will be used in Sec. 3.4 to simplify the Morse and Pöschl-Teller Hamiltonians [14].
22
2.4 Solving for Time Evolution with Lie Algebras
2.4.9
Some Useful Properties of the Lie Algebra Parameters
One of the real strengths of the Lie algebra methods is that useful properties of the system can be easily expressed in terms of the αi parameters. By using the ladder operator algebra to construct a Wei-Norman ansatz for U(t) as seen in Eq. (2.47), the following expressions can be determined: U † aU = eα3 a + α1 ,
(2.78)
U † a†U = e−α3 a† − α2 ,
(2.79)
U † NU = N − α1 α2 .
(2.80)
These expressions represent the operators a, a† and N in the Heisenberg picture. When taken with q 1 † √ the identities x = 2ω (a + a ) and p = −i ω2 (a − a† ) (in the units of h¯ = m = ω = 1), we recover the following expressions for expectation values in terms of the αi (t)’s: 1 hxi = hn|U † xU |ni = √ (α1 (t) − α2 (t)), 2ω r ω † hpi = hn|U pU |ni = −i (α1 (t) + α2 (t)), 2 hNi = hn| N |ni = ni − α1 (t)α2 (t),
(2.81)
(2.82) (2.83)
where ni is the initial number eigenvalue of the system. The expectation values of hxi and hpi can be used to find the phase-space trajectories of the system, and will be employed in Chapter 3. The transition probabilities of the system can also be found in terms of Lie algebra parameters. The probability of a transition from the nth energy level to the mth level is defined as follows: Pnm (t) = |hm |U(t)| ni|2 .
(2.84)
For some element Hi of a given algebra we use the following identity: αi (t)Hi
e
αi (t)k k |ni = ∑ Hi |ni. k=0 k! ∞
(2.85)
23
2.5 Chaos
This expression can be simplified if we are using the ladder operator algebra. From the exponential of the lowering operator a, and the properties of ladder operators [10], we get s n k n! α (t) 2 eα2 (t)a |ni = ∑ |n − ki. (n − k)! k=0 k!
(2.86)
After acting on |ni with all of the exponential terms of U(t) and simplifying, we are left with the following expression for the transition probabilities: 2 n m−n+k k √ α1 (t) α2 (t) α4 (t) α3 (t)n Pnm (t) = e n!m! ∑ e . k=0 k!(m − n + k)!(n − k)!
(2.87)
The value P00 is known as the ground-state persistence probability. The expression given by Eq. (2.87) is only valid for transitions from lower to higher states, i.e., n ≤ m. Transitions from higher to lower states, i.e., n ≥ m, use the following formula: 2 m k α (t)n−m+k √ α (t) 1 2 Pnm (t) = eα4 (t) eα3 (t)n n!m! ∑ . k(m − k)!(n − m + k)! k=0
(2.88)
These expressions will be used in Chapter 3 to plot the transition probabilities for the SHO and the Morse oscillator systems.
2.5
Chaos
Classical chaos is usually described as an extreme sensitivity to initial conditions [15].
2.5.1
Conditions for Chaos
The system needs to have some level of complexity in order to display chaos. The exact conditions for the onset of chaos is the subject of considerable research, but some general results apply. In particular, according to the Poincaré-Bendixson theorem, a system of equations will not manifest chaos unless it has three or more degrees of freedom and is nonlinear [16].
24
2.5 Chaos
2.5.2
Lyapunov Exponents
The most commonly used tool to measure chaos is known as a Lyapunov exponent [17]. Lyapunov exponents are determined by measuring strength of the exponential divergence of two trajectories initially separated by a distance ε as follows: |δ x(t)| = |δ xo | eλt
(2.89)
|δ x(t)| 1 ⇒ λ = lim log( ), t→∞ t |δ xo |
(2.90)
where δ xo corresponds to the initial difference of two trajectories of variable x (i.e. δ xo = ε), and δ x(t) corresponds to the difference of the two trajectories at some later time t. It should be noted that x does not necessarily refer to a coordinate variable. A system of coupled differential equations will have one Lyapunov exponent for each degree of freedom of the system, with the largest-valued exponent referred to as the "maximal" Lyapunov exponent. A system is considered chaotic when its maximal Lyapunov exponent is positive-valued.
2.5.3
Phase Space Behavior
Chaos of a system is often determined by studying the phase-space behavior of the system using the principles of ergodic theory [17], which considers the exploration of the phase space in time. The phase-space trajectories of a chaotic system will tend to spread evenly over the region of phase space that is accessible to the system. This spreading over phase space can be seen in several of the figures in Chapter 3.
2.5.4
Examples of Chaotic Systems
Some examples of physical systems which manifest chaos are the double pendulum [18] and the non-rectangular billiard table [19]. Another example, already encountered in Sec. 2.2.4, is the
2.5 Chaos
25
Duffing oscillator . This system is known to exhibit chaos when the driving force is sufficiently strong. Some solutions of this system will be shown in Sec. 3.3.
2.5.5
Quantum Chaos
Extreme sensitivity to initial conditions is difficult to ascribe to quantum systems because the uncertainty principle makes it impossible to exactly define the initial conditions and trajectories [20]. Therefore, other criteria and methods have been developed in the study of quantum chaos. In particular, the question of quantum chaos is often addressed by studying the statistical distribution of energy levels [21]. What we will show in Chapter 3 is that exact trajectories can be determined for the Lie algebra parameters in Sec. 2.4, making it possible to determine the values of the Lyapunov exponents of the corresponding systems. This is done by solving Eq. (2.39) using two different sets of initial conditions: first with αi (0) = 0, then with αi (0) = ±ε. A minus sign may be necessary to preserve unitarity when dealing with closely coupled α’s (such as the α’s corresponding to a and a† ). Throughout Chapter 3 I will use this method to calculate Lyapunov exponents for each αi of the Lie algebra solution in order to determine if chaos is present. For chaotic systems, at least one of the Lyapunov exponents will have a positive, nonzero value in the limit that t → ∞.
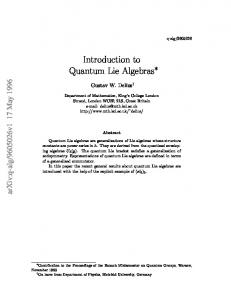
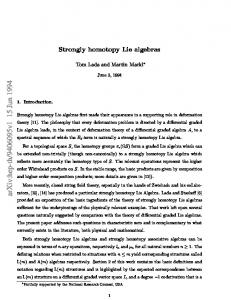
Chapter 3 Results In this chapter I present results obtained by numerical solutions of the dynamical equations for the Lie parameters derived in Sec. 2.4. I consider successively the driven free particle, the driven simple harmonic oscillator, the quartic potential oscillator, the driven anharmonic Morse and PöschlTeller oscillators, and the Caldirola-Kanai damped SHO. For all of this chapter I will use a Gaussian pulse as the driving force, of the form 2
f (t) = Eo sin(ω f t)e−λ (t−to ) ,
(3.1)
where Eo is the amplitude or strength of the force, ω f is the frequency, λ is the inverse envelope width (i.e., the inverse duration) of the force, and to defines the time the center of the pulse arrives at the system. The pulse will always be centered at to = 50 so that at t = 0 the force will be either zero-valued or very small, depending on the chosen value of λ (see Fig. 3.1). This driving force can be used to model how a short laser pulse might interact with a given atomic system.
26
27
λ = 0.5
10
5
5
0
0
−5
−5
−10
0
20
40
λ = 0.2
10
60
80
100
−10
0
20
40
t λ = 0.05
10
5
0
0
−5
−5
0
20
40
60
80
100
−10
0
20
40
t
5
0
0
−5
−5
0
20
40
60
80
100
60
80
100
λ = 0.002
10
5
−10
100
t
λ = 0.005
10
80
λ = 0.02
10
5
−10
60 t
80
100
−10
0
20
40
t
Figure 3.1 Gaussian pulse force, λ -varying.
60 t
28
3.1 The Driven Free Particle
3.1
The Driven Free Particle
The first system I wish to look at is the driven free particle, whose Hamiltonian is given in Eq. (2.49). This system was already solved for a generic driving force f (t) using the Andrews method and the Lie algebra method (see Sec. 2.2.2 and Sec. 2.4.6, respectively). Using the driving force given in Eq. (3.1), the Andrews method defines following useful functions: Z t
0
0
Z t Z t0
F1 (t) = 1 F2 (t) = 2m
0
0
2
Eo sin(ω f t”)e−λ (t”−to ) dt”dt 0 ,
Z t Z t0
[ 0
2
Eo sin(ω f t 0 )e−λ (t −to ) dt 0 ,
F(t) =
0
2
Eo sin(ω f t”)e−λ (t”−to ) dt”]2 dt 0 .
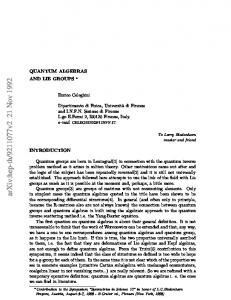
(3.2) (3.3) (3.4)
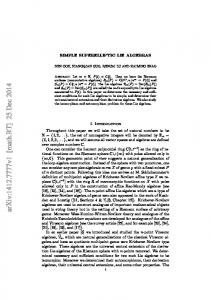
These three functions are used to determine the time evolution, via a shift in coordinate and a quantum phase, of a given initial wavefunction. The system can also be solved with Lie algebras by replacing the force f (t) in Eqs. (2.58) through (2.61) with the particular force given in Eq. (3.1). I will use the solutions to the αs to determine Lyapunov exponents. In Fig. 3.2 I plot the Lyapunov exponents (LE) as a function of time, one exponent λi for each degree of freedom of the system. In the Wei-Norman formulation there is one degree of freedom for each of the basis elements of the algebra, which means there is one λi for each αi . For the sake of clarity I will label the λi with subscripts that are related to the basis element they represent (i.e., λdx corresponds to
∂ ∂x,
λ1 corresponds to the unity element operator 1, etc.).
The first thing to notice is that λdx has the most pronounced behavior in each of the plots. It initially rises fast, then slowly decays as
1 t
for the rest of the plot interval. The driving force, with
an inverse width of λ = 0.05, acts mostly on the interval of t = 40 to t = 60, but λdx seems to be uninfluenced by the force turning on. Also, since the graph of λdx is unchanged as Eo is varied, it appears that its value is entirely independent of the driving force. The plot of λ1 is the next most interesting of the four. It becomes nonzero around the time the driving force begins to act, and oscillates as the force is acting, then appears to "roll off" and
29
3.1 The Driven Free Particle
Eo = 0
Eo = 0.1
0.4
0.4
0.3
0.3
0.2
0.2
0.1
0.1
0
0
−0.1
0
50
100
150 t
200
250
300
−0.1
0
50
100
Eo = 1
150 t
200
250
300
Eo = 10
0.5
0.5
0.4
0.4
λ1
0.3
0.3
λx
0.2
0.2
λdx
0.1
0.1
λdx2
0
0
−0.1
0
50
100
150 t
200
250
300
−0.1
0
50
100
Eo = 100 0.5
0.4
0.4
0.3
0.3
0.2
0.2
0.1
0.1
0
0 0
50
100
150 t
200
250
300
200
250
300
Eo = 1000
0.5
−0.1
150 t
200
250
300
−0.1
0
50
100
150 t
Figure 3.2 Free particle Lyapunov exponents, Eo -varying, λ = 0.005, ω f = ω.
30
3.1 The Driven Free Particle
asymptotically approach the y-axis once the force has ceased. The amplitude of its oscillations as well as its maximum value before the rolling off period correspond to the strength of the driving force. In the plot corresponding to Eo = 0.1 we can see a small downward bump in λdx , long after the driving force has passed: While this is an interesting feature, it does not appear to be significant. The final thing to note from these plots is that the exponents corresponding to x and
∂2 ∂ x2
are
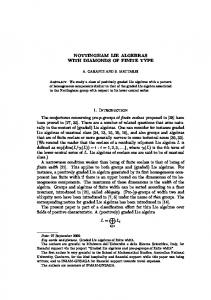
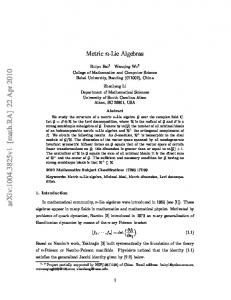
everywhere flat and nearly zero. Chaos wouldn’t be expected in a driven free particle system, which means that these exponents behave as might be predicted. I will now vary the duration of the peak λ rather than the strength Eo of the driving force. In Fig. 3.3 and Fig. 3.4 I vary λ while holding the amplitude at Eo = 1 and Eo = 10, respectively. The behavior of λdx in each of the plots is identical, regardless of the value of λ . It appears that this LE is independent of the strength AND duration of the driving force. Since the system only consists of a free particle and a driving force, and λdx appears to be independent of the driving force, there’s not much left, physically, to account for its behavior. ∂
One possibility: Since this exponent corresponds to the term eαdx ∂ x , which is the infinitesimal generator of translation for the system, it could mean that the initial separation ε of the αdx values is physically manifested as an initial displacement of the two trajectories, and that this initial displacement becomes less pronounced over time as the two systems naturally evolve. However, if this were the case, the Lyapunov exponent would be expected to immediately begin at some high value and then roll off, not start at −∞ and quickly rise before rolling off as it is seen to do. Whatever the interpretation may be, the behavior of λdx does not seem to indicate the presence of chaos in the system. As we saw in Fig. 3.2, the Lyapunov exponents λx and λdx2 are everywhere almost zero-valued, and so were unaffected by changes in driving force duration just as they were unaffected by changes in its strength. A few things can be seen in the graphs of λ1 in Fig. 3.3 and Fig. 3.4 that weren’t
31
3.1 The Driven Free Particle
λ = 0.5
0.3 0.2
0.2
0.1
0.1
0
0
−0.1
0
100
200
300 t
400
500
600
λ = 0.05
0.3
λ = 0.2
0.3
−0.1
0
100
200
300 t
400
500
600
λ = 0.02
0.3
λ1 0.2
0.2
0.1
0.1
0
0
−0.1
0
100
200
300 t
400
500
600
λ = 0.005
0.3
−0.1
0.2
0.1
0.1
0
0
0
100
200
300 t
λdx λdx2
0
100
200
400
500
600
−0.1
300 t
400
500
600
400
500
600
λ = 0.002
0.3
0.2
−0.1
λx
0
100
200
300 t
Figure 3.3 Free particle Lyapunov exponents, Eo = 1, λ -varying, ω f = ω.
32
3.1 The Driven Free Particle
λ = 0.5
λ = 0.2
0.4
0.4
0.3
0.3
0.2
0.2
0.1
0.1
0
0
−0.1
0
50
100
150 t
200
250
300
λ = 0.05
0.5
−0.1
0.4
0.3
0.3
0.2
0.2
0.1
0.1
0
0 0
50
100
150 t
200
250
300
λ = 0.005
0.5
−0.1
0.4
0.3
0.3
0.2
0.2
0.1
0.1
0
0 0
50
100
150 t
100
200
250
300
−0.1
150 t
200
250
300
λ = 0.02 λ1 λx λdx λdx2
0
50
100
150 t
200
250
300
200
250
300
λ = 0.002
0.5
0.4
−0.1
50
0.5
0.4
−0.1
0
0
50
100
150 t
Figure 3.4 Free particle Lyapunov exponents, Eo = 10, λ -varying, ω f = ω.
33
3.2 The Driven Simple Harmonic Oscillator
apparent from the graphs in Fig. 3.2. When the driving fore is shorter in duration, i.e. when 0.2, the exponent λ1 is kicked to a higher positive value and then gradually approaches zero. When the driving force is longer in duration (corresponding to λ = 0.02, λ = 0.005, and λ = 0.002), there is no positive kick in λ1 and no tail-end behavior. The last place we can see any kind of rolling off at the tail is for λ = 0.05. It appears that the more impulsive the driving force is, the less chance the system has to gradually adjust. For λ = 0.5, the driving force appears to be too short in duration to cause any response from λ1 . The oscillations in λ1 correspond to exactly to the region where the driving force is acting and appear to have the same frequency. These ripples stretch farther in the negative values than they do in positive values, which is especially apparent in the λ = 0.005 and λ = 0.002 plots in Fig. 3.3. It doesn’t seem likely that chaos is manifest in the graphs of λ1 . The positive tail-end behavior is most likely a consequence of the impulsive nature of the force, where the system doesn’t have enough time to gradually respond to the force. The real test of chaos is in the limit of the Lyapunov exponents for asymptotically large values of t; in light of this criterion, chaos does not appear to be present in any of the graphs in Fig. 3.3 or Fig. 3.4, again as we would expect for a free particle.
3.2
The Driven Simple Harmonic Oscillator
As with the free particle case, the driving force f (t) for the SHO is chosen to take the form of a Gaussian pulse, as given in Eq. (3.1). With this driving force, the values of S(t) and C(t) as defined in section. (2.2.3) are the following: Z t
S(t) =
f (t 0 )sin[ω(t − t 0 )]dt 0 =
0
Z t
C(t) = 0
Z t 0
0
0
0
f (t )cos[ω(t − t )]dt =
Z t 0
0
2
0
2
Eo cos(ω f t 0 )e−λ (t −to ) sin[ω(t − t 0 )]dt 0 , Eo cos(ω f t 0 )e−λ (t −to ) cos[ω(t − t 0 )]dt 0 ,
(3.5) (3.6)
3.2 The Driven Simple Harmonic Oscillator
34
and β (t) is determined by Eq. (2.24). The wave function of the initial undriven system is chosen to be the ground state of the SHO: Ψ(x,t) = (
mω 1 iωt mω 2 ) 4 exp(− x )exp(− ). h¯ π 2¯h 2
(3.7)
The final wavefunction of the driven system is then given according to the ansatz, Eq. (2.3): mω 1 i S(t) 2 iωt mω ) 4 exp[− ψ(x,t) = exp[ (C(t)x − β (t))]( (x − ) ]exp(− ). h¯ h¯ π 2¯h mω 2
(3.8)
The system can also be solved using Lie algebras to determine the time evolution operator, as seen in Sec. 2.2.3. Once the time evolution operator has been determined, other properties of the system, such as phase plots, transition probabilities, and Lyapunov exponents can determined as outlined in Sec. 2.4.9 and Sec. 2.5.2. I will now take a look at each of these properties, starting by varying the driving force strength Eo as I did in Sec. 3.1 for the free particle. After varying Eo , I will make plots of varying driving force duration λ and driving frequency ω f for Eo = 1 as well as Eo = 10 (again, as was done in Sec. 3.1 for the free particle).
3.2.1
Strength of Driving Force
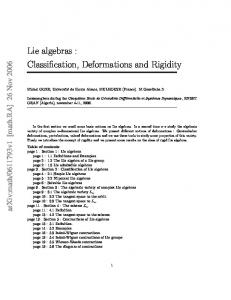
In Fig. 3.5 I make phase-space plots (i.e., plots of hpi vs. hxi) for two systems: one with the αi (0) = 0 (in red) and the other with the αi (0) initially offset by a small value of ε = 0.001 (in blue). The plots are made for various small values of Eo . For all these plots I’ve set the driving force inverse duration λ = 0.005 and the driving frequency ω f = ω (or at resonance with the natural frequency of the oscillator). In later plots I will vary both of these quantities while holding Eo at a fixed value. In the case of no driving force Eo = 0 the system behaves exactly like one would expect: The red dot in the middle corresponds to the system with all the αi s initially set to zero, and the blue circle with radius just over 1e − 3 corresponds to the system with initial conditions αa (0) = ε, αa† (0) =
35
3.2 The Driven Simple Harmonic Oscillator
−3
2
−3
Eo = 0
x 10
2
1
1
0
0
−1
−1
−2 −2
−1
0
1
2
Eo = 1e−4
x 10
−2 −2
−1
0
1
−3
x 10
x 10
Eo = 1e−3
Eo = 1e−2
0.02
0.2
0.01
0.1
0
0
−0.01 −0.02 −0.02
−0.1
−0.01
0
0.01
0.02
−0.2 −0.2
−0.1
Eo = 0.1 20
1
10
0
0
−1
−10
−1
0
0
0.1
0.2
10
20
Eo = 1
2
−2 −2
2 −3
1
2
−20 −20
−10
0
Figure 3.5 SHO phase space, small Eo values, λ = 0.005, ω f = ω.
3.2 The Driven Simple Harmonic Oscillator
36
−ε, αN (0) = iε, and α1 (0) = iε (with ε = 1e − 3). The minus sign and imaginary i modifying the ε in the last three conditions are chosen with consideration to the identities mentioned in Sec. 2.4.5. As expected, the system initially at zero does nothing, and the system with an initial offset simply stays at the cycle corresponding to that offset. In the case of Eo = 1e − 4, the red trajectory starts at the origin then grows clockwise to a limit cycle (i.e. a final closed trajectory) of radius just under 1e − 3, while the blue trajectory starts off clockwise on a cycle just over 1e − 3 (as in the Eo = 0 case), but falls to a much smaller limit cycle as a result of the driving force. If the area of the phase-space cycle is proportional to the energy of the system, this means that that the blue system was stimulated by the driving force to emit energy, rather than gain energy. For Eo = 1e − 3, the red and the blue trajectories both grow to a larger limit cycle, but the red one appears to absorb slightly more energy than the blue one. This effect disappears for larger values of Eo . For the cases where Eo = 1e − 2, Eo = 0.1, and Eo = 1, the initial difference between the red and blue trajectories becomes negligible as the driving force turns on. Both trajectories almost perfectly overlap and reach a final radius of about 10 ∗ Eo for each of those driving forces. Note that the resolution of the plots decreases as Eo increases. In Fig. 3.6 I plot the persistence and transition probabilities, which are determined using Eq. (2.87), for several small values of Eo and beginning at t = 0. I’ve only included transitions to the first four excited states. This means that if the system has a high probability of transition above the first four excited states, the lower-level transition probabilities will no longer normalize to unity and may in fact all go to zero. For Eo = 0.05, the transition probabilities are approximately 82% ground state (P00 ), 15% first excited state (P01 ), and 3% second excited state (P02 ), with negligible probabilities for higher states. As Eo is increased to 0.1 the probabilities become approximately 44% P00 , 36% P01 , 14% P02 , 4% third excited state (P03 ), and 1% fourth excited state (P04 ), with higher level transition properties assumed to be negligible. In the plot of Eo = 0.2, the persistence probability gradually drops as it has before, but to an
37
3.2 The Driven Simple Harmonic Oscillator
Eo = 0.05
Eo = 0.1
1
1
0.8
0.8
0.6
0.6
0.4
0.4
0.2
0.2
0
0
20
40
60
80
100
0
0
20
40
t Eo = 0.2 1
0.8
0.8
0.6
0.6
0.4
0.4
0.2
0.2
0
20
40
60
80
100
0
0
20
40
t Eo = 0.5
0.8
0.8
0.6
0.6
0.4
0.4
0.2
0.2
20
40
60 t
60
80
100
Eo = 1 1
0
100
t
1
0
80
Eo = 0.3
1
0
60 t
80
100
0
Persistence P(0−1) P(0−2) P(0−3) P(0−4)
0
20
40
60
80
t
Figure 3.6 SHO transition probabilities, small Eo values, λ = 0.005, ω f = ω.
100
3.2 The Driven Simple Harmonic Oscillator
38
even lower value of around 5%. The first excited state transition probability P01 rises to a maximum value of about 35% at t = 50 but then falls to a final value of 14% for large t. The second excited state transition reaches a peak probability of 28% at t = 58, a little later than the peak of P01 , and finally ends up at around 22%. The probabilities P03 and P04 rise to a max of 23% and 17% respectively, without ever decreasing. These probabilities only add up to a total value of 81%, which means that there’s about 19% of the probability unaccounted for in order to normalize to 100%; this 19% must be transitions to states even higher than the fourth excited state, none of which have been plotted here. In the plot of Eo = 0.3 we can see that all of the probabilities have switched places for large t, with almost zero probability of the system staying in the ground state or the first excited state. It is also even more apparent that the final probabilities no longer add to 100%, meaning that higher level transitions make up an even larger portion of the probability. In the cases of Eo = 0.5 and Eo = 1 it has reached the point that there is zero probability of the system staying in any of the first five energy levels. Another thing worth mentioning in these plots is that the peak values of the transition probabilities stay about the same when Eo is greater, but these peaks occur at earlier times. These plots tell us that systems with a driving force amplitude of Eo < 0.1 are most likely to stay at the ground level, while systems with Eo > 0.5 are most likely to transition to a level even higher than E5 . In Fig. 3.7 I plot the LE for each degree of freedom of the Wei-Norman ansatz with the chosen algebra basis, with the exception of the LE corresponding to αa† . Because αa† = −αa∗ , the values of λa† and λa will be the same. Plots are made for varying small values of Eo while λ = 0.005 and ω f = ω. In these plots λa and λN are almost zero everywhere. A small hump in λ1 begins to appear at around t = 50 for larger Eo , which forms a tail that gradually falls of as 1t . On a closer inspection, the tail end appears to converge to zero rather than some positive value for large t (see Fig. 3.8).
39
3.2 The Driven Simple Harmonic Oscillator
Eo = 0.05
Eo = 0.1
0.4
0.4
0.3
0.3
0.2
0.2
0.1
0.1
0
0
−0.1
0
50
100
150 t
200
250
300
−0.1
0
50
100
Eo = 0.2 0.5
0.4
0.4
0.3
0.3
0.2
0.2
0.1
0.1
0
0 0
50
100
150 t
200
250
300
−0.1
0.4
0.4
0.3
0.3
0.2
0.2
0.1
0.1
0
0 50
100
150 t
300
λN λ1
0
50
100
150 t
200
250
300
200
250
300
Eo = 1 0.5
0
250
λa
Eo = 0.5 0.5
−0.1
200
Eo = 0.3
0.5
−0.1
150 t
200
250
300
−0.1
0
50
100
150 t
Figure 3.7 SHO Lyapunov exponents, small Eo values, λ = 0.005, ω f = ω.
40
3.2 The Driven Simple Harmonic Oscillator
Eo = 1 0.04
0.035
0.03
0.025
0.02
0.015
0.01
0.005
0
0
200
400
600
800
1000 t
1200
1400
1600
1800
2000
Figure 3.8 A close-up look at the SHO Lyapunov exponents for Eo = 1 at later times, λ = 0.005, ω f = ω.
3.2 The Driven Simple Harmonic Oscillator
41
The criterion for chaos is that a Lyapunov exponent converges to a positive non-zero value in the limit that t → ∞, so this LE does not appear to indicate that chaos is present. I will now repeat these plots using larger values of driving force amplitude Eo . In Fig. 3.9 I make phase-space plots for systems with Eo varying from 1 to 1e5. In every case, the trajectories follow the behavior as seen in Fig. 3.5 for Eo = 1e − 2, Eo = 0.1, and Eo = 1: The initial difference between the red and blue trajectories becomes negligible as the driving force turns on. Both trajectories almost perfectly overlap and reach a final radius of about 10 ∗ Eo . Note the change in scale as Eo increases. In Fig. 3.10 I plot the persistence and transition probabilities for the SHO for several large values of Eo . As with Fig. 3.6, I’ve only included transitions to the first four excited states. These plots follow the trend that was seen in the cases of Eo = 0.5 and Eo = 1, where all probabilities of transitions lower than at least the fifth excited state go to zero for large t. Three main trends can be seen as Eo increases. The first is that the peaks in the probability curves are shifted earlier in time. I had to change the plot window to start at t = 0 in order to see anything for the last two plots. The second trend is that the peaks move closer together as they move to the left, to the point that they are just about lined up when Eo = 1000. The third trend is that the width of the peaks is decreasing for larger Eo . These trends can all be explained by the fact that higher and higher energy level transitions are occurring for larger Eo . On this point, Fig. 3.6 and Fig. 3.10 serve as a good check of expected behavior. In later sections, when looking at transition probabilities for more complicated systems, these figures will be useful as a basis for comparison. Finally, in Fig. 3.11 I plot the Lyapunov exponents for Eo = 1 through Eo = 100. As in Fig. 3.7, λa and λN are everywhere almost zero. The same hump appears in λ1 at around t = 50 which rolls off with a positive tail that gradually decreases. The size of the hump becomes even more pronounced as Eo increases, but in each case the tail end still appears to converge to zero, meaning
42
3.2 The Driven Simple Harmonic Oscillator
Eo = 1
Eo = 10
20
200
10
100
0
0
−10
−100
−20 −15
−10
−5
0
5
10
15
−200 −150 −100
−50
4
Eo = 1e2 2000
2
1000
1
0
0
−1000
0
50
100
150
0.5
1
1.5
Eo = 1e3
x 10
−1
−2000 −1500 −1000 −500
0
500
1000
1500
−2 −1.5
−1
−0.5
0
4
x 10 5
2
6
Eo = 1e4
x 10
2
1
1
0
0
−1
−1
−2 −1.5
−1
−0.5
0
0.5
1
1.5
Eo = 1e5
x 10
−2 −1.5
−1
−0.5
0
0.5
1
5
x 10
Figure 3.9 SHO phase space, large Eo values, λ = 0.005, ω f = ω.
1.5 6
x 10
43
3.2 The Driven Simple Harmonic Oscillator
Eo = 1
Eo = 3
1
1
0.8
0.8
0.6
0.6
0.4
0.4
0.2
0.2
0
0
20
40
60
80
100
0
0
20
40
t Eo = 10 1
0.8
0.8
0.6
0.6
0.4
0.4
0.2
0.2
0
20
40
60
80
100
0
0
20
40
Eo = 100
0.8
0.8
0.6
0.6
0.4
0.4
0.2
0.2
40
60 t
80
100
80
100
Eo = 1000 1
20
60 t
1
0
100
Persistence P(0−1) P(0−2) P(0−3) P(0−4)
t
0
80
Eo = 30
1
0
60 t
80
100
0
0
20
40
60 t
Figure 3.10 SHO transition probabilities, large Eo values, λ = 0.005, ω f = ω.
44
3.2 The Driven Simple Harmonic Oscillator
Eo = 1
Eo = 3
0.4
0.4
0.3
0.3
0.2
0.2
0.1
0.1
0
0
−0.1 0
50
100
150 t
200
250
300
−0.1 0
50
100
Eo = 10 0.5
0.4
0.4
0.3
0.3
0.2
0.2
0.1
0.1
0
0 50
100
150 t
200
250
300
−0.1 0
0.4
0.4
0.3
0.3
0.2
0.2
0.1
0.1
0
0 100
150 t
300
λN λ1
50
100
150 t
200
250
300
200
250
300
Eo = 100 0.5
50
250
λa
Eo = 50 0.5
−0.1 0
200
Eo = 30
0.5
−0.1 0
150 t
200
250
300
−0.1 0
50
100
150 t
Figure 3.11 SHO Lyapunov exponents, large Eo values, λ = 0.005, ω f = ω.
3.2 The Driven Simple Harmonic Oscillator
45
no chaos, just as expected for a driven SHO.
3.2.2
Duration of Driving Force
I will now take a closer look at how the duration of the driving force affects the system by plotting the phase space, transition probabilities, and Lyapunov exponents while varying the value of λ , the inverse duration of the force, while the strength of the force is first Eo = 1 and then Eo = 10. In Fig. 3.12 I plot the phase space for several different values of λ (the same values that were used in Figs. 3.3 and 3.4 in Sec. 3.1 for the driven free particle). There are two things worth noting in these plots. The first is that the phase trajectory circles the phase space more times before reaching a limit cycle when the force lasts longer. For λ = 0.5 and λ = 0.2, the trajectory has barely made one revolution before reaching its final limit. This is what we would expect to have happen for a more impulsive force. As long as the force is acting, the amplitude of the trajectory increases, which means that the force is transferring energy to the system. Once the force has passed, the phase-space trajectory will stay on a cycle whose area corresponds to the final energy of the system. This fact leads to the second behavior worth noting about these plots, that the duration of force corresponds to the final area of the phase-space cycle. The radius of the limit cycle is about 1, 2, 4, 5, 10, and 20 for λ = 0.5, 0.2, 0.05, 0.02, 0.005, and 0.002, respectively. One thing that is apparently absent from these plots is any sort of divergent behavior between the red and the blue trajectories. The small initial difference in the values of the αs doesn’t make a noticeable difference for any value of λ when Eo = 1. In Fig. 3.13 I plot the transition probabilities for various the values of λ , with Eo = 1. The first thing we can see from these plots is that transitions to higher energy levels become more probable for longer pulses. By the time we get to an inverse width of value λ = 0.02 we have reached the point that all of the lower-level probabilities being plotted have negligible values, while for a much
46
3.2 The Driven Simple Harmonic Oscillator
λ = 0.5
2 1
1
0
0
−1
−1
−2 −1.5
−1
−0.5
0
0.5
1
1.5
λ = 0.05
4
−2 −2
5
0
0
−2
−5
−2
0
2
4
λ = 0.005
20
−10 −10
10
0
0
−10
−10
−10
−5
0
5
10
15
−20 −20
0
1
2
5
10
10
20
λ = 0.02
−5
0 λ = 0.002
20
10
−20 −15
−1
10
2
−4 −4
λ = 0.2
2
−10
0
Figure 3.12 SHO phase space, Eo = 1, λ -varying, ω f = ω.
47
3.2 The Driven Simple Harmonic Oscillator
λ = 0.5
1 0.8
0.8
0.6
0.6
0.4
0.4
0.2
0.2
0
0
20
40
λ = 0.2
1
60
80
100
0
0
20
40
t λ = 0.05
1
0.8
0.6
0.6
0.4
0.4
0.2
0.2
0
20
40
60
80
100
0
0
20
40
t
0.8
0.6
0.6
0.4
0.4
0.2
0.2
0
20
40
60 t
60
80
100
λ = 0.002
1
0.8
0
100
t
λ = 0.005
1
80
λ = 0.02
1
0.8
0
60 t
80
100
0
Persistence P(0−1) P(0−2) P(0−3) P(0−4)
0
20
40
60 t
Figure 3.13 SHO transition probabilities, Eo = 1, λ -varying, ω f = ω.
80
100
3.2 The Driven Simple Harmonic Oscillator
48
shorter pulse of λ = 0.5 the system is most likely to stay in the ground state. The other thing we can see from the plots in Fig. 3.13 is that the width of the probability peaks increases as the pulse width increases. This is the opposite of the trend seen in Fig. 3.10 when Eo is increased. In other words, increasing the pulse width or increasing its amplitude will increase the probability of higher-level transitions, while increasing the pulse width or DECREASING its amplitude will increase the width of the probability peaks of lower-level transitions. In Fig. 3.14 I plot the Lyapunov exponents of SHO using the same values as were used in the last two figures (Fig. 3.12 and Fig. 3.13). As was the case in Fig. 3.11, λa and λN are everywhere almost zero. The hump in λ1 at around t = 50 becomes even more pronounced as λ decreases. The bump in λ1 gets broader as the pulse width increases, much as the transition probabilities in Fig. 3.13 also broadened for smaller λ . The tail end of λ1 still seems to be converging to zero for large t, meaning there’s still no indication of chaos. I will now repeat the plots using Eo = 10, to see if any new behavior in λ emerges with a stronger driving force. In Fig. 3.15 I plot the phase-space trajectories for different λ values as in Fig. 3.12, this time for Eo = 10 instead of Eo = 1, with driving frequency ω f = ω just as before. The only difference between these plots and those of Fig. 3.12 is the amplitude, which is now larger by a fact of ten just as the driving force is now larger by the same factor. This simply confirms the conclusion reached by inspecting Fig. 3.9, that for any large value of Eo the shape of the phase-space plot for a given value of λ will be the same. In other words, the value of λ affects both the shape and the amplitude of the phase-space trajectory, while the value of Eo affects only the amplitude and not the shape. In Fig. 3.16 I plot the transition probabilities using the same values of λ as in Fig. 3.15 and Fig. 3.15. The probability peaks are narrower than in Fig. 3.13 because Eo is stronger, which would indicate that higher-level transitions are happening quicker. The nonzero probabilities of lower-level transitions and ground-level persistence that were seen after t = 50 in Fig. 3.13 for λ = 0.5 and λ = 0.2 are now completely suppressed, which means the system ends up in some
49
3.2 The Driven Simple Harmonic Oscillator
λ = 0.5
λ = 0.2
0.4
0.4
0.3
0.3
0.2
0.2
0.1
0.1
0
0
−0.1 0
50
100
150 t
200
250
300
−0.1 0
50
100
λ = 0.05
150 t
200
250
λ = 0.02
0.4
0.4
λa
0.3
0.3
λN
0.2
0.2
λ1
0.1
0.1
0
0
−0.1 0
50
100
150 t
200
250
300
−0.1 0
50
100
λ = 0.005 0.4
0.3
0.3
0.2
0.2
0.1
0.1
0
0 50
100
150 t
150 t
200
250
300
200
250
300
λ = 0.002
0.4
−0.1 0
300
200
250
300
−0.1 0
50
100
150 t
Figure 3.14 SHO Lyapunov exponents, Eo = 1, λ -varying, ω f = ω.
50
3.2 The Driven Simple Harmonic Oscillator
λ = 0.5
20 10
10
0
0
−10
−10
−20 −15
−10
−5
0
5
10
15
λ = 0.05
40
−20 −20
50
0
0
−20
−50
−20
0
20
40
λ = 0.005
200
−100 −100
100
0
0
−100
−100
−100
−50
0
50
100
150
−200 −200
0
10
20
50
100
100
200
λ = 0.02
−50
0 λ = 0.002
200
100
−200 −150
−10
100
20
−40 −40
λ = 0.2
20
−100
0
Figure 3.15 SHO phase space, Eo = 10, λ -varying, ω f = ω.
51
3.2 The Driven Simple Harmonic Oscillator
λ = 0.5
1 0.8
0.8
0.6
0.6
0.4
0.4
0.2
0.2
0
0
20
40
λ = 0.2
1
60
80
100
0
0
20
40
t λ = 0.05
1
0.8
0.6
0.6
0.4
0.4
0.2
0.2
0
20
40
60
80
100
0
0
20
40
t
0.8
0.6
0.6
0.4
0.4
0.2
0.2
0
20
40
60 t
60
80
100
λ = 0.002
1
0.8
0
100
t
λ = 0.005
1
80
λ = 0.02
1
0.8
0
60 t
80
100
0
Persistence P(0−1) P(0−2) P(0−3) P(0−4)
0
20
40
60 t
Figure 3.16 SHO transition probabilities, Eo = 10, λ -varying, ω f = ω.
80
100
3.2 The Driven Simple Harmonic Oscillator
52
energy level above n = 5. Finally, in Fig. 3.17 I plot the Lyapunov exponents as I did in Fig. 3.14, but with Eo = 10. The plots of λa and λN are everywhere almost zero, as has been the case in every LE plot for the driven SHO so far. As λ decreases, the hump in λ1 becomes even more pronounced and begins sooner, which was also seen in Fig. 3.14. The leading edge of the hump becomes less abrupt for wider pulses. The tail end of λ1 still appears to converge to zero. I’m going to say that there is still no evidence of chaos being present.
3.2.3
Frequency of Driving Force
I will now take a closer look at how the frequency of the driving force affects the system by repeating the plots of the phase space trajectories, transition probabilities, and Lyapunov exponents that were made in Sec. 3.2.2, this time while varying the value of the driving frequency ω f (as a fraction of ω, the natural frequency of the oscillator) rather than λ , while the strength of the force is first Eo = 1 and then Eo = 10. In Fig. 3.18 I plot the phase space for various values of ω f . As was also seen in Fig. 3.12 when varying λ , the phase-space trajectories for the red and the blue initial systems appear to almost perfectly overlap, regardless of the value of ω f . When Eo = 1, the initially difference between the two trajectories becomes negligible at later times, regardless of the frequency of the driving force. For small driving frequencies, i.e. ω f = 0.2ω and 0.5ω, the phase space trajectory initially responds to the driving force by growing in amplitude but falls back down to zero after the force has ceased. When the force is pumping the system too slowly, less energy is permanently transferred. In the plots where ω f = 0.8ω and ω f = 1.2ω, which are both closer to resonance, the phasespace trajectories grow to much larger amplitudes as the force is acting, and they remain on limit cycles with radii approximately equal to 1 rather than fall back to the origin. Farther away from resonance, at ω f = 1.5ω, the trajectory again falls back to the origin after the force has passed.
53
3.2 The Driven Simple Harmonic Oscillator
λ = 0.5
λ = 0.2
0.4
0.4
0.3
0.3
0.2
0.2
0.1
0.1
0
0
−0.1 0
100
200
300
−0.1 0
100
200
t
t
λ = 0.05
λ = 0.02
300
0.4
0.4
λa
0.3
0.3
λN
0.2
0.2
0.1
0.1
0
0
−0.1 0
100
200
300
−0.1 0
100
t
t
λ = 0.005
λ = 0.002
0.4
0.4
0.3
0.3
0.2
0.2
0.1
0.1
0
0
−0.1 0
λ1
100
200 t
300
−0.1 0
100
200
300
200
300
t
Figure 3.17 SHO Lyapunov exponents, Eo = 10, λ -varying, ω f = ω.
54
3.2 The Driven Simple Harmonic Oscillator
ωf = 0.2ω
ωf = 0.5ω
0.2
1
0.1
0.5
0 0 −0.1 −0.5
−0.2 −0.3 −1
−0.5
0
0.5
1
−1 −1.5
−1
−0.5
ωf = 0.8ω 20
2
10
0
0
−2
−10
−2
0
2
4
−20 −15
−10
ωf = 1.2ω 2
2
1
0
0
−2
−1
−2
0
1
1.5
−5
0
5
10
15
ωf = 1.5ω
4
−4 −4
0.5
ωf = ω
4
−4 −4
0
2
4
−2 −1
−0.5
0
0.5
Figure 3.18 SHO phase space, Eo = 1, λ = 0.005, ω f -varying.
1
3.2 The Driven Simple Harmonic Oscillator
55
The area of the final phase-space limit cycle seems to be dependent on how close to resonance the driving force is acting. When the driving force is at resonance, i.e. ω f = ω, the phase-space trajectory continues to grow while the force is acting, and it stays at its largest value after the driving force has stopped. This can be seen as an outward "whirlpool" shape, and has been seen in every phase plot where ω f = ω and Eo is sufficiently large, i.e. Eo > 0.01. In Fig. 3.19 I plot the transition probabilities using the same values of ω f as in Fig. 3.18. A few things to note about these plots: The ripples in the transition probability plots correspond to the driving force frequency. The plots for ω f = 0.5ω and ω f = 1.5ω are similar in their transition probability values and only differ in ripple size. This is also true with ω f = 0.8ω and ω f = 1.2ω, which both show all probabilities dipping down from around t = 45 to about t = 60, after which they converge to almost the exact same final probability values, with P01 = 35%, P00 and P02 = 25%, P03 = 12%, and P04 = 5%. For ω f = ω, no probability of lower-level transitions remains after about t = 45; when driven at resonance, the SHO system is most likely to end up in a higher energy state after the force has stopped. We can conclude from these plots that the SHO responds more strongly, and retains more energy, when it is being forced with a frequency closer to its natural frequency. In Fig. 3.20 I plot the LE values while varying ω f . The plots of λa and λN are zero-valued regardless of the specifics of the driving force. The value of λ1 oscillates around the x-axis for ω f = 0.2ω, ω f = 0.5ω, and ω f = 1.5ω without forming any hump or tail end. A hump does appear in λ1 for ω f = 0.8ω, ω f = ω, and ω f = 1.2ω, and the hump has a positive tail for ω f = ω. This tail end still appears to go to zero at later times, so again no chaos is present. I will now repeat these plots using Eo = 10 instead of Eo = 1 to see if new features in the ω f -dependency of system can be seen. In Fig. 3.21 I make phase plots for different ω f values as in Fig. 3.18, but this time for Eo = 10
56
3.2 The Driven Simple Harmonic Oscillator
ωf = 0.2ω
ωf = 0.5ω
1
1
0.8
0.8
0.6
0.6
0.4
0.4
0.2
0.2
0
0
20
40
60
80
100
0
0
20
40
t ωf = 0.8ω 1
0.8
0.8
0.6
0.6
0.4
0.4
0.2
0.2
0
20
40
60
80
100
0
0
20
40
ωf = 1.2ω
0.8
0.8
0.6
0.6
0.4
0.4
0.2
0.2
40
60 t
80
100
80
100
ωf = 1.5ω 1
20
60 t
1
0
100
Persistence P(0−1) P(0−2) P(0−3) P(0−4)
t
0
80
ωf = ω
1
0
60 t
80
100
0
0
20
40
60 t
Figure 3.19 SHO transition probabilities, Eo = 1, λ = 0.005, ω f -varying.
57
3.2 The Driven Simple Harmonic Oscillator
ωf = 0.2ω
ωf = 0.5ω
0.4
0.4
0.3
0.3
0.2
0.2
0.1
0.1
0
0
−0.1 0
100
200
300
−0.1 0
100
200
t
t
ωf = 0.8ω
ωf = ω
300
0.4
0.4
λa
0.3
0.3
λN
0.2
0.2
0.1
0.1
0
0
−0.1 0
100
200
300
−0.1 0
λ1
100
t
t
ωf = 1.2ω
ωf = 1.5ω
0.4
0.4
0.3
0.3
0.2
0.2
0.1
0.1
0
0
−0.1 0
−0.1 0
100
200 t
300
100
200
300
200
300
t
Figure 3.20 SHO Lyapunov exponents, Eo = 1, λ = 0.005, ω f -varying.
58
3.2 The Driven Simple Harmonic Oscillator
ωf = 0.2ω
ωf = 0.5ω
2
10
1
5
0 0 −1 −5
−2 −3 −10
−5
0
5
10
−10 −20
−10
ωf = 0.8ω 200
20
100
0
0
−20
20
100
200
5
10
−100
−20
0
20
40
−200 −200
−100
ωf = 1.2ω 20
20
10
0
0
−20
−10
−20
0
0 ωf = 1.5ω
40
−40 −40
10
ωf = ω
40
−40 −40
0
20
40
−20 −10
−5
0
Figure 3.21 SHO phase space, Eo = 10, λ = 0.005, ω f -varying.
3.3 The Driven Quartic Potential λ x4
59
instead of Eo = 1. The only difference between these plots and those of Fig. 3.12 is the amplitude, which is now larger by a fact of ten just as the driving force is now larger by the same factor. This again confirms the conclusion reached by inspecting Fig. 3.9, that for any large value of Eo the shape of the phase-space plot for a given value of ω f will be the same. The value of ω f , like the value of λ as seen in Sec. 3.2.2, affects both the shape and the amplitude of the phase-space trajectory, while the value of Eo affects only the amplitude and not the shape. In Fig. 3.22 I plot the transition probabilities for the system using the same values as in Fig. 3.21. All lower-level transition probabilities are suppressed after about t = 35 for ω f = 0.8ω, ω f = ω, and ω f = 1.2ω. For ω f = 0.5ω and ω f = 1.5ω, lower-level transition probabilities disappear while the peak of the force pulse is present, from about t = 40 to t = 60, after which the probabilities return to their initial values. This also happens for ω f = 0.2ω, except for an unusual spike in lower-level probabilities at about t = 46. For some reason, the system appears to fall from a higher energy state to a lower one for just that moment, and then it jumps back up. There will be many more appearances of lower-level "spikes" like this in Sec. 3.4, where we’ll consider the anharmonic Morse oscillator. Finally, in Fig. 3.23 I plot the Lyapunov exponents using the same values as in Fig. 3.21 and Fig. 3.22. As always, there is no activity in the plots of λa and λN . A small hump in λ1 at around t = 50 is now present for every value of ω f . The hump is followed by a long positive tail end for ω f = 0.8ω, ω f = ω, and ω f = 1.2ω. These tails all appear to converge to zero and not some positive value. Once again, chaos doesn’t appear to be present for this system.
3.3
The Driven Quartic Potential λ x4
The Hamiltonian for a quartic anharmonic oscillator with a driving force is given by Eq. (2.29) and was briefly discussed in Sec. 2.2.4, and again in Sec. 2.5.4.
3.3 The Driven Quartic Potential λ x4
60
ωf = 0.2ω
ωf = 0.5ω
1
1
0.8
0.8
0.6
0.6
0.4
0.4
0.2
0.2
0
0
20
40
60
80
100
0
0
20
40
t ωf = 0.8ω 1
0.8
0.8
0.6
0.6
0.4
0.4
0.2
0.2
0
20
40
60
80
100
0
0
20
40
ωf = 1.2ω
0.8
0.8
0.6
0.6
0.4
0.4
0.2
0.2
40
60 t
80
100
80
100
ωf = 1.5ω 1
20
60 t
1
0
100
Persistence P(0−1) P(0−2) P(0−3) P(0−4)
t
0
80
ωf = ω
1
0
60 t
80
100
0
0
20
40
60 t
Figure 3.22 SHO transition probabilities, Eo = 10, λ = 0.005, ω f -varying.
3.3 The Driven Quartic Potential λ x4
61
ωf = 0.2ω
ωf = 0.5ω
0.4
0.4
0.3
0.3
0.2
0.2
0.1
0.1
0
0
−0.1 0
100
200
300
−0.1 0
100
200
t
t
ωf = 0.8ω
ωf = ω
300
0.4
0.4
λa
0.3
0.3
λN
0.2
0.2
0.1
0.1
0
0
−0.1 0
100
200
300
−0.1 0
100
t
t
ωf = 1.2ω
ωf = 1.5ω
0.4
0.4
0.3
0.3
0.2
0.2
0.1
0.1
0
0
−0.1 0
λ1
100
200 t
300
−0.1 0
100
200
300
200
300
t
Figure 3.23 SHO Lyapunov exponents, Eo = 10, λ = 0.005, ω f -varying.
3.3 The Driven Quartic Potential λ x4
62
Eo = 0.1
Eo = 0.1
0.2 0.4 0.1 0.3 0
0.2 0.1
−0.1 0 −0.2 −0.4
−0.2
0
0.2
0.4
0.6
−0.1 0
50
100
Eo = 1
150
200
250
300
200
250
300
Eo = 1
2 0.4 1 0.3 0
0.2 0.1
−1 0 −2 −2
−1
0
1
2
−0.1 0
50
100
Eo = 10
150 Eo = 10
10 0.4
λx
0.3
λp
5 0
0.2 0.1
−5 0 −10 −4
−2
0
2
4
−0.1 0
50
100
150
200
250
300
Figure 3.24 Classical Duffing oscillator Phase space and Lyapunov exponents, Eo varying, ω f = 1.
3.3 The Driven Quartic Potential λ x4
63
Using a driving force of the form f (t) = Eo sin(ωt) I can numerically solve the classical system. In Fig. 3.24 I plot the phase-space trajectories and Lyapunov exponents (corresponding to x and p) of the classical Duffing oscillator (as seen in Sec. 2.2.4) for values of Eo ranging from 0.1 to 10. For Eo = 0.1 and Eo = 1 the phase-space trajectories reach a limit cycle after only a few rotations around phase space, and there isn’t any noticeable deviation between the red and blue trajectories. The Lyapunov exponents for Eo = 0.1 and Eo = 1 show numerous downward spikes, but their values eventually converge to zero at later times. Two things can be seen in the phase-space plot for Eo = 10 that may suggest the system is chaotic: First, there is a noticeable separation between the red and blue trajectories, and second, the trajectories have begun to spread out over the phase space rather than converge to one limit cycle. In the corresponding Lyapunov exponent plots, the two LE are initially negative-valued, but then they rise to positive values at around t = 100 and remain positive for all later times. The phase-space behavior and positive Lyapunov exponents can be taken as evidence that the system is chaotic for Eo = 10. Since the Duffing oscillator is known to exhibit chaos for sufficiently large driving forces, the data in Fig. 3.24 simply confirms this fact. We can use what was seen here in a system known to be chaotic as a point of reference to determine whether chaos is present when looking at the driven anharmonic oscillator systems in Sec. 3.4. This system can be approximately solved with Lie algebras by using a perturbation approximation. I didn’t do this myself, but the specifics on how it is done can be found in a paper by Alexander [22]. A mean field approximation could also be used to simplify the algebra, though expectation values will be more difficult to evaluate in the |ni representation when not employing the ladder operator Lie algebra.
3.4 The Driven Morse and Pöschl-Teller Oscillators
3.4
64
The Driven Morse and Pöschl-Teller Oscillators
I will now consider a driven anharmonic oscillator (AO) whose Hamiltonian is the following (as seen in the paper by Berrondo and Récamier [14]): 1 1 χ 1 . ωo H = f (t)(a + a† ), [(1 + χ[N + ])(N + ) + ] − √ 1+χ 2 2 4 2ω
(3.9)
where χ is known as the "anharmonicity parameter ." When χ < 0, a system is called a Morse oscillator , while for χ > 0 it is called a Pöschl-Teller oscillator . By setting χ = 0, I recover the simple harmonic oscillator. As shown in Sec. 2.4.8, a mean field approximation can be made to simplify the higher-order N + 21 term [14], � � 1 2 1 1 (N + ) = N + (N + ), 2 2 2
(3.10)
so that I can use the same algebra as for the SHO, which is given in Eq. (2.42). The value of the mean field term in the Heisenberg representation, using the values in Sec. 2.4.9, is � � � � 1 1 1 † = n|U (t)(N + )U(t)|n = ni + α1 (t)α2 (t) + , N+ 2 2 2
(3.11)
where ni is the initial energy level of the system. The α parameters of the time evolution operator can now be solved in the same way as was done in Sec. 2.4.7 for the SHO, but with a different Hamiltonian in the RHS. The addition of the αs in the mean field term given by Eq. (3.11) introduces more nonlinearity to the four coupled differential equations for αi , which makes chaos possible. Classically, the driven Morse oscillator is known to exhibit chaos [23]. The quantum Morse oscillator can be used to model the oscillations of a diatomic molecule (such as H2 ) [24]. I will take a look at this system by plotting the phase-space trajectories, transition probabilities, and Lyapunov exponents as I did for the SHO, using a Gaussian pulse driving force as given in Eq. (3.1). I will start by varying the force strength Eo over small and large values. I will then vary the inverse pulse width λ , the driving frequency ω f , and the anharmonicity parameter χ, all for Eo = 1 and Eo = 10 and all initially in the ground state (i.e. ni = 0).
3.4 The Driven Morse and Pöschl-Teller Oscillators
3.4.1
65
Strength of Driving Force
To begin with, I consider a Morse oscillator (χ = −0.025) driven with different values of Eo , with λ = 0.005 and ω f = ω. In Fig. 3.25 I plot the phase-space trajectories of two systems, one with the αi initially equal to zero (in red) and the other with the αi initially offset by a small value of ε = 0.001 (in blue). The phase space plots are almost identical to those of the SHO in Fig. 3.5, except for a few differences. First, in the case of Eo = 1e − 4, the final limit cycle of the blue trajectory has a lager area than the blue trajectory in Fig. 3.5, meaning that slightly more energy was absorbed by the anharmonic system than by its harmonic counterpart. The biggest difference, though, is seen in the case of Eo = 1: In the SHO, the Eo = 1 phase plot was almost identical to the Eo = 0.1 phase plot in shape, though their sizes were different. In the AO case, the trajectories initially spiral outward but then spiral back to the center as the driving force diminishes. For this strength of driving force, the AO system was unable to absorb as much energy. At larger values of Eo the red and blur trajectories overlap each other, showing no significant divergence between the two initially similar systems at later times, which means there is no evidence of chaotic-like divergence. In Fig. 3.26 I plot the Morse oscillator transition probabilities over Eo values ranging from 0.05 to 1. The transition probabilities follow the same pattern as seen in Fig. 3.6 for Eo = 0.05 through Eo = 0.3. For larger driving forces we begin to see that after the probabilities reach a peak they will dip down and then rise to some new limit rather than gradually decreasing as they did for the SHO. For Eo = 0.7 and higher the lower-level transition probabilities almost all go to zero, but then rise after the force has stopped, with P03 and P02 ending up the highest, followed by P04 , P01 , and finally the ground state persistence. For Eo = 1, the transition probabilities resemble those of the SHO system driven off-resonance, as seen in Fig. 3.22. After the force has passed, the system is most likely to return to the ground state, with about 7% probability of ending in the first excited state. This confirms what was seen
66
3.4 The Driven Morse and Pöschl-Teller Oscillators
−3
2
−3
Eo = 0
x 10
2
1
1
0
0
−1
−1
−2 −2
−1
0
1
2
Eo = 1e−4
x 10
−2 −2
−1
0
1
−3
x 10
Eo = 1e−3
Eo = 1e−2
0.02
0.2
0.01
0.1
0
0
−0.01 −0.02 −0.02
−0.1
−0.01
0
0.01
0.02
−0.2 −0.2
Eo = 0.1 10
1
5
0
0
−1
−5
−1
0
−0.1
0
0.1
0.2
Eo = 1
2
−2 −2
2 −3
x 10
1
2
−10 −5
0
5
Figure 3.25 Morse oscillator phase space, small Eo values, λ = 0.005, ω f = ω, χ = −0.025.
67
3.4 The Driven Morse and Pöschl-Teller Oscillators
Eo = 0.05
Eo = 0.1
1
1
0.8
0.8
0.6
0.6
0.4
0.4
0.2
0.2
0
0
20
40
60
80
100
0
0
20
40
t Eo = 0.3 1
0.8
0.8
0.6
0.6
0.4
0.4
0.2
0.2
0
20
40
60
80
100
0
0
20
40
Eo = 0.7
0.8
0.8
0.6
0.6
0.4
0.4
0.2
0.2
40
60 t
80
100
60
80
100
Eo = 1 1
20
60 t
1
0
100
Persistence P(0−1) P(0−2) P(0−3) P(0−4)
t
0
80
Eo = 0.5
1
0
60 t
80
100
0
0
20
40 t
Figure 3.26 Morse oscillator transition probabilities, small Eo values, λ = 0.005, ω f = ω, χ = −0.025.
3.4 The Driven Morse and Pöschl-Teller Oscillators
68
in the phase plot for Eo = 1 in Fig. 3.25: The AO system is not as responsive to a driving force of strength Eo = 1 as it is to forces of lower strength. In Fig. 3.27 I plot the Lyapunov exponents λi of the αi parameters for the a, N, and 1 elements of the Lie algebra (neglecting a† for the reason stated in Sec. 3.2.1). The LE λa is mostly zero, but begins to form a small bump after t = 50 for larger Eo . The exponent λN stays near zero except for a downward spike. This spike takes place at an earlier time for larger Eo . The behavior of λ1 is similar to λa : It is mostly zero, but begins to form a small bump near t = 50 as Eo increases. These bumps don’t line up with the ones in λa : They start sooner, and the tails drop off faster. None of the exponents appear to converge to values above zero for large t, so there doesn’t appear to be chaos in the system for these values of Eo . I will now take a look at this system using larger numbers for Eo . In Fig. 3.28 I plot the phase-space trajectories of the Morse oscillator using values of Eo ranging from 1e0 to 1e5. For Eo = 10 the red and blue trajectories are still mostly overlapping, but the phase plots have some unusual features. The trajectories abruptly switch from clockwise to counterclockwise at one point, and there are a couple of kinks as well. Also, the final limit cycle is much larger than was seen for Eo = 1, which means that system absorbs and retains more energy from the driving force. For Eo = 1e2, the red and blue trajectories have begun to diverge noticeably. Also, the phase plot has begun to split into two lobes instead of one central circle. This becomes even more pronounced for Eo = 1e3, Eo = 1e4, and Eo = 1e5, as does the separation between the red and blue trajectories. The red and blue trajectories are more spread out over phase space for larger values of Eo , to the point that the red and blue plots are evenly distributed over the whole phase space for Eo = 1e5. The divergence of initially nearby trajectories, as well as the equidistribution over phase space, seem to be indicative of a potentially chaotic system. In Fig. 3.29 I plot the transition probabilities over values of Eo ranging from 1 to 100. For
69
3.4 The Driven Morse and Pöschl-Teller Oscillators
Eo = 0.05
Eo = 0.1
0.4
0.4
0.3
0.3
0.2
0.2
0.1
0.1
0
0
−0.1 0
50
100
150 t
200
250
300
−0.1 0
50
100
Eo = 0.2
150 t
200
250
300
Eo = 0.3
0.4
0.4
λa
0.3
0.3
λN
0.2
0.2
0.1
0.1
0
0
−0.1 0
50
100
150 t
200
250
300
−0.1 0
λ1
50
100
Eo = 0.5 0.4
0.3
0.3
0.2
0.2
0.1
0.1
0
0 50
100
150 t
200
250
300
200
250
300
Eo = 1
0.4
−0.1 0
150 t
200
250
300
−0.1 0
50
100
150 t
Figure 3.27 Morse oscillator Lyapunov exponents, small Eo values, λ = 0.005, ω f = ω, χ = −0.025.
70
3.4 The Driven Morse and Pöschl-Teller Oscillators
Eo = 1
Eo = 10
10
20
5
10
0
0
−5
−10
−10 −5
0
5
−20 −20
−10
Eo = 1e2
0
10
20
50
100
200
400
Eo = 1e3
40
50
20 0
0
−20 −40 −40
−20
0
20
40
−50 −100
−50
Eo = 1e4
Eo = 1e5
100
200
50
100
0
0
−50
−100
−100 −200
−100
0
0
100
200
−200 −400
−200
0
Figure 3.28 Morse oscillator phase space, large Eo values, λ = 0.005, ω f = ω, χ = −0.025.
71
3.4 The Driven Morse and Pöschl-Teller Oscillators
Eo = 1
Eo = 3
1
1
0.8
0.8
0.6
0.6
0.4
0.4
0.2
0.2
0
0
20
40
60
80
100
0
0
20
40
t Eo = 5 1
0.8
0.8
0.6
0.6
0.4
0.4
0.2
0.2
0
20
40
60
80
100
0
0
20
40
Eo = 30
0.8
0.8
0.6
0.6
0.4
0.4
0.2
0.2
40
60 t
80
100
80
100
Eo = 100 1
20
60 t
1
0
100
Persistence P(0−1) P(0−2) P(0−3) P(0−4)
t
0
80
Eo = 10
1
0
60 t
80
100
0
0
20
40
60 t
Figure 3.29 Morse oscillator transition probabilities, large Eo values, λ = 0.005, ω f = ω, χ = −0.025.
3.4 The Driven Morse and Pöschl-Teller Oscillators
72
Eo = 3 the lower-level transition probabilities show a series of bumps but eventually approach small nonzero final values, with P04 greater than the rest and the ground-state persistence P00 being the least likely. For Eo = 5 and above there is no longer any nonzero probability of transitions to lower states at later times, only small spikes in probability. For Eo = 100 the probability spikes have become a comb of many narrow peaks with varying heights. These spike correspond to times when the Morse oscillator rapidly drops to lower energy level and then just as quickly returns to a higher level. These rapid changes in energy may be why the phase-space trajectories of this system were able to visit so many points in phase space. Finally, in Fig. 3.30 I plot the Lyapunov exponents for the same values of Eo used in Fig. 3.29. For Eo = 1 and Eo = 3 the three LE mostly stay around zero. The exponent λ1 makes a small positive hump, followed by a tail that appear to go to zero as t → ∞. The LE λN consists of some small downward spikes centered around t = 50 before it also converges to zero at later times, while λa makes some oscillation at t = 50 but stays pretty close to zero the whole time. Some interesting behavior starts to happen at around Eo = 5: All three of the LE start to oscillate while they ramp upward while the driving force is acting. After the force has passed, the three LE all have positive tails that slowly decrease as 1t , but they do NOT converge to zero as t → ∞, but instead appear to converge to positive nonzero values. According to the Lyapunov criterion, this signifies the presence of chaos. λ1 reaches its peak before the other two and is the highest of the LE, so it would be considered the "maximal" Lyapunov exponent of the system. The tail end seems to fall off slightly faster for λ1 than for λa or λN (as seen for Eo = 10), but it still appears to converge to around the same value, if not slightly greater. The LE all converge to positive nonzero values for driving force strengths of Eo = 5 and greater, so the system appears to be chaotic for these values.
73
3.4 The Driven Morse and Pöschl-Teller Oscillators
Eo = 1
Eo = 3
0.4
0.4
0.3
0.3
0.2
0.2
0.1
0.1
0
0
−0.1
0
50
100
150 t
200
250
300
−0.1
λa λN λ1
0
50
100
Eo = 5 0.5
0.4
0.4
0.3
0.3
0.2
0.2
0.1
0.1
0
0 0
50
100
150 t
200
250
300
−0.1
0
50
100
Eo = 30 0.5
0.4
0.4
0.3
0.3
0.2
0.2
0.1
0.1
0
0 0
50
100
150 t
250
300
150 t
200
250
300
200
250
300
Eo = 100
0.5
−0.1
200
Eo = 10
0.5
−0.1
150 t
200
250
300
−0.1
0
50
100
150 t
Figure 3.30 Morse oscillator Lyapunov exponents, large Eo values, λ = 0.005, ω f = ω, χ = −0.025.
3.4 The Driven Morse and Pöschl-Teller Oscillators
3.4.2
74
Duration of Driving Force
I will now consider how variations in the inverse duration λ of the driving force affect the system. I will plot the phase-space trajectories, transition probabilities, and Lyapunov exponents at various values of λ , first with Eo = 1 and then with Eo = 10, as was done for the SHO in Sec. 3.2.2. In Fig. 3.31 I plot the phase-space trajectories for a Morse oscillator (χ = −0.025) with Eo = 1 and ω f = ω. For shorter pulses the phase plots resemble those of the SHO system, as seen Fig. 3.12. For longer pulses, i.e. λ = 0.005 and λ = 0.002, the trajectories spiral clockwise outward while the force is acting but then fall inward after the force has passed, settling into a smaller limit cycle. From this it would seem that in the AO case, as opposed to the SHO case, more impulsive forces give the system energy but don’t allow it enough time to emit the energy afterward. Perhaps a longer force is able to gradually take the energy of the system upward and then downward. In Fig. 3.32 I plot the first five transition probabilities for the same system and values as used above in Fig. 3.31. Like the phase plots, the transition probabilities for larger λ resemble those of the SHO system (see Fig. 3.13). For λ = 0.005 the probabilities that are plotted all drop to zero around t = 50 but then rise again until they reach a final state that’s similar to the initial state, with the ground-state probability P00 being the greatest, followed by a small nonzero P01 . For λ = 0.002 the probabilities all go through two downward dips, located at about t = 40 and t = 70, separated by a hump that peaks at around t = 55, before finally reaching limits of smaller nonzero probability after t = 80. From these plots it appears that the system driven by a pulse with λ = 0.005 was able to retain the least amount of energy from the force. There is no sign at this small Eo value of any of the spike features that were seen in Fig. 3.29 and appear to be present in chaotic systems. In Fig. 3.33 I plot the Lyapunov exponents for this system, again using the same values as in Fig. 3.31 and Fig. 3.32. The LE λa is mostly near zero but has a small hump near t = 50 for λ = 0.2 through λ = 0.005, and two humps located at about t = 40 and t = 70 for λ = 0.002, the
75
3.4 The Driven Morse and Pöschl-Teller Oscillators
λ = 0.5
2 1
1
0
0
−1
−1
−2 −2
−1
0
1
2
λ = 0.05
4
λ = 0.2
2
−2 −2
−1
0
1
2
λ = 0.02
5
2 0
0
−2 −4 −4 10
−2
0
2
4
λ = 0.005
−5 −5
0
5
λ = 0.002
5
5 0
0
−5 −10 −5
0
5
−5 −4
−2
0
2
4
6
Figure 3.31 Morse oscillator phase space, Eo = 1, λ -varying, ω f = ω, χ = −0.025.
76
3.4 The Driven Morse and Pöschl-Teller Oscillators
λ = 0.5
1 0.8
0.8
0.6
0.6
0.4
0.4
0.2
0.2
0
0
20
40
λ = 0.2
1
60
80
100
0
0
20
40
t λ = 0.05
1
0.8
0.6
0.6
0.4
0.4
0.2
0.2
0
20
40
60
80
100
0
0
20
40
λ = 0.005
0.6
0.6
0.4
0.4
0.2
0.2
20
40
60 t
80
100
80
100
λ = 0.002
1 0.8
0
60 t
0.8
0
100
Persistence P(0−1) P(0−2) P(0−3) P(0−4)
t 1
80
λ = 0.02
1
0.8
0
60 t
80
100
0
0
20
40
60 t
Figure 3.32 Morse oscillator transition probabilities, Eo = 1, λ -varying, ω f = ω, χ = −0.025.
77
3.4 The Driven Morse and Pöschl-Teller Oscillators
λ = 0.5
λ = 0.2
0.4
0.4
0.3
0.3
0.2
0.2
0.1
0.1
0
0
−0.1
0
50
100
150 t
200
250
300
λ = 0.05
0.5
−0.1
0
50
100
150 t
200
250
300
λ = 0.02
0.5
0.4
0.4
λa
0.3
0.3
λN
0.2
0.2
0.1
0.1
0
0
−0.1
0
50
100
150 t
200
250
300
λ = 0.005
0.5
−0.1
0.4
0.3
0.3
0.2
0.2
0.1
0.1
0
0 0
50
100
150 t
0
50
100
200
250
300
−0.1
150 t
200
250
300
200
250
300
λ = 0.002
0.5
0.4
−0.1
λ1
0
50
100
150 t
Figure 3.33 Morse oscillator Lyapunov exponents, Eo = 1, λ -varying, ω f = ω, χ = −0.025.
3.4 The Driven Morse and Pöschl-Teller Oscillators
78
same places where the dips in lower-level transition probabilities occurred in Fig. 3.32. λN has one downward spike for larger λ values, which turns into more of a downward hump for λ = 0.02 and λ = 0.005, and finally is two downward humps made of two spikes each for λ = 0.002, located at the same times as the upward humps in λa . λ1 forms a hump with a tail and is larger for smaller values of λ , with some waviness for λ = 0.002 that corresponds with the double hump seen in the other two LE. At large t these LE all seem to go to zero, meaning that the system probably is not chaotic. If conclusions can be drawn from what was seen in Fig. 3.30, it follows that signatures of chaos will not be present in systems with forces of strength Eo < 5, regardless of their duration. I will now make the same plots for various λ , but with Eo = 10 rather than Eo = 1, which will possibly make chaos more likely to appear. In Fig. 3.34 I plot the phase-space trajectories for this system as I did in Fig. 3.31, with the only difference being that now Eo = 10. For λ = 0.5 and λ = 0.2 the phase plot switches from clockwise to counterclockwise shortly after the driving force turns on. For λ = 0.05 it actually switches back to clockwise before reaching a limit cycle. Kinks start to appear for λ = 0.02 and λ = 0.005. What’s most interesting is that the red and blue trajectories begin to move away from each other for λ = 0.005 and end up greatly separated for λ = 0.002, ending up with different limit cycles. This could signify that chaos is present at those values. In Fig. 3.35 I plot the transition probabilities over the same values as in Fig. 3.34. For λ = 0.5 through λ = 0.05 the transition probabilities are similar to those of the corresponding SHO system (see Fig. 3.16). Spikes in lower-level transition probabilities begin to emerge for λ = 0.02 and λ = 0.005. For λ = 0.002 the spikes are taller, narrower, and more numerous. These same spikes in lower-level probability were also seen when probing large Eo values in Fig. 3.29: It is possible that they accompany chaos, or just that they are more likely to be seen in chaotic systems. Finally, in Fig. 3.36 I plot the Lyapunov exponents of this system over the same values of λ
79
3.4 The Driven Morse and Pöschl-Teller Oscillators
λ = 0.5
λ = 0.2
20
20
10
10
0
0
−10
−10
−20 −20
−10
0
10
20
−20 −20
−10
λ = 0.05 20
10
10
0
0
−10
−10 −10
0
10
20
−20 −20
−10
λ = 0.005 20
10
10
0
0
−10
−10 −10
0
20
0
10
20
10
20
λ = 0.002
20
−20 −20
10
λ = 0.02
20
−20 −20
0
10
20
−20 −20
−10
0
Figure 3.34 Morse oscillator phase space, Eo = 10, λ -varying, ω f = ω, χ = −0.025.
80
3.4 The Driven Morse and Pöschl-Teller Oscillators
λ = 0.5
λ = 0.2
1
1
0.8
0.8
0.6
0.6
0.4
0.4
0.2
0.2
0
0
20
40
60
80
100
0
0
20
40
t λ = 0.05 1
0.8
0.8
0.6
0.6
0.4
0.4
0.2
0.2
0
20
40
60
80
100
0
0
20
40
λ = 0.005
0.8
0.8
0.6
0.6
0.4
0.4
0.2
0.2
40
60 t
80
100
80
100
λ = 0.002 1
20
60 t
1
0
100
Persistence P(0−1) P(0−2) P(0−3) P(0−4)
t
0
80
λ = 0.02
1
0
60 t
80
100
0
0
20
40
60 t
Figure 3.35 Morse oscillator transition probabilities, Eo = 10, λ -varying, ω f = ω, χ = −0.025.
81
3.4 The Driven Morse and Pöschl-Teller Oscillators
λ = 0.5
λ = 0.2
0.4
0.4
0.3
0.3
0.2
0.2
0.1
0.1
0
0
−0.1
0
50
100
150 t
200
250
300
λ = 0.05
0.5
−0.1
0
50
100
150 t
200
250
300
λ = 0.02
0.5
0.4
0.4
λa
0.3
0.3
λN
0.2
0.2
0.1
0.1
0
0
−0.1
0
50
100
150 t
200
250
300
λ = 0.005
0.5
−0.1
0.4
0.3
0.3
0.2
0.2
0.1
0.1
0
0 0
50
100
150 t
0
50
100
200
250
300
−0.1
150 t
200
250
300
200
250
300
λ = 0.002
0.5
0.4
−0.1
λ1
0
50
100
150 t
Figure 3.36 Morse oscillator Lyapunov exponents, Eo = 10, λ -varying, ω f = ω, χ = −0.025.
3.4 The Driven Morse and Pöschl-Teller Oscillators
82
as before. For smaller λ all three of the LE oscillate while they ramp up to some positive value and then slowly fall off as 1t , as they did in Fig. 3.30. It is difficult to say at what point the system begins to manifest chaos, but by considering all three figures together I would say that chaos is present for λ = 0.005 and λ = 0.002, but not present for larger values of λ .
3.4.3
Frequency of Driving Force
I will now take a look at how varying ω f affects the phase plots, transition probabilities, and Lyapunov exponents of the Morse oscillator system. I will first make the plots for Eo = 1 and then again for Eo = 10. I will compare most of these plots with those of the SHO system, as seen in Sec. 3.2.3. It should be noted that, while for the SHO ω = ω f corresponds to driving at resonance, for the AO this is not necessarily the case. In Fig. 3.37 I plot the phase-space trajectories for Eo1 and λ = 0.05 while varying the driving frequency ω f . None of the plots show any obvious divergence between the red and blue trajectories, which might have indicated the presence of chaos. For ω f = 0.2ω, ω f = 0.5ω, and ω f = 1.5ω are all very similar to the plots for the SHO system (as seen in Fig. 3.18). The ones that differ the most are closer to ω in value. For the SHO system, ω f = 0.8ω and ω f = 1.2ω both featured the trajectories spiraling outward before falling back to a limit cycle of around radius 2. In the Morse oscillator case, the ω f = 1.2ω phase trajectory ends up on a much smaller limit cycle (r = 0.5) while the ω f = 0.8ω trajectory ends up on a larger one (r = 5). For ω f = ω, the final limit cycle is almost as small as the one for ω f = 1.2ω; for the SHO, the phase-space trajectory of ω f = ω was a whirlpool shape that ended on its maximum outward radius. From these plots we can conclude that the Morse oscillator system does not have the same resonance frequency as the simple harmonic oscillator. In Fig. 3.38 I plot the transition probabilities for the Morse system with the same parameter values as in Fig. 3.37. None of these plots have any spikes or other unusual features. By compar-
83
3.4 The Driven Morse and Pöschl-Teller Oscillators
ωf = 0.2ω
ωf = 0.5ω
0.4
1
0.2
0.5
0
0
−0.2
−0.5
−0.4 −1
−0.5
0
0.5
1
−1 −2
−1
ωf = 0.8ω 10
5
5
0
0
−5
−5 −5
0
5
10
−10 −5
0
ωf = 1.2ω 2
2
1
0
0
−2
−1 −2
0
2
5
ωf = 1.5ω
4
−4 −4
1
ωf = ω
10
−10 −10
0
2
4
−2 −1
−0.5
0
0.5
1
Figure 3.37 Morse oscillator phase space, Eo = 1, λ = 0.005, ω f -varying, χ = −0.025.
84
3.4 The Driven Morse and Pöschl-Teller Oscillators
ωf = 0.2ω
ωf = 0.5ω
1
1
0.8
0.8
0.6
0.6
0.4
0.4
0.2
0.2
0
0
20
40
60
80
100
0
0
20
40
t ωf = 0.8ω 1
0.8
0.8
0.6
0.6
0.4
0.4
0.2
0.2
0
20
40
60
80
100
0
0
20
40
t ωf = 1.2ω
0.8
0.8
0.6
0.6
0.4
0.4
0.2
0.2
20
40
60 t
60
80
100
ωf = 1.5ω 1
0
100
t
1
0
80
ωf = ω
1
0
60 t
80
100
0
Persistence P(0−1) P(0−2) P(0−3) P(0−4)
0
20
40
60
80
100
t
Figure 3.38 Morse oscillator transition probabilities, Eo = 1, λ = 0.005, ω f -varying, χ = −0.025.
3.4 The Driven Morse and Pöschl-Teller Oscillators
85
ison with the SHO transition probabilities seen in Fig. 3.19, we can see further evidence that the SHO and AO have different resonance frequencies. The plots for ω f = 0.8ω show that all of the lower level probabilities go to zero by the time the center of the pulse has arrived and stay at zero afterward. This means that the system has most likely made transitions to states that are above n = 5, which is more likely to occur when the system is driven at its natural frequency. When ω f = ω and ω f = 1.2ω the force pulse drops all of the lower level probabilities, but by the time the force has stopped the system has mostly returned to the ground state. It would seem that ω f = 0.8ω, and not ω f = ω, is best candidate for resonance frequency for a driven Morse oscillator with anharmonicity χ = −0.025. This is also visible in Fig. 3.37. In Fig. 3.39 I plot the LE for the Morse system with varying ω f and Eo = 1. The λa exponent makes some small oscillations around t = 50 for ω f = 0.8ω and ω f = ω. In the SHO plots of Fig. 3.20, λa is almost everywhere zero. Also, λN has a downward spike at t = 50 for ω f = 0.8ω and ω, which is also not present in the SHO plots. λ1 hasn’t changed much from the SHO to the Morse system, except for a small dip at t = 50 for ω f = 1.2ω. None of these LE appear to show any strong evidence that the system is chaotic at these parameter values. I will now take a look at what happens when ω f is varied while Eo = 10. The increased Eo value may improve the odds of finding chaos, as seen in Sec. 3.4.1. In Fig. 3.40 I plot the phase-space trajectories while varying the driving frequency ω as I did in Fig. 3.37, only this time with Eo = 10. All of these trajectories show abrupt kinks and changes in direction except for the ω f = 1.5ω plot, which is more like the plot for the corresponding SHO system as seen in Fig. 3.21. The plots of ω f = 0.5ω through ω f = 1.2ω begin to show signs of separation between the red and blue trajectories, but the separation is most apparent in the plot for ω f = 0.2ω, where the red and blue trajectories both reach different limit cycles. This may indicate a sensitivity to initial conditions that would characterize chaos.
86
3.4 The Driven Morse and Pöschl-Teller Oscillators
ωf = 0.2ω
ωf = 0.5ω
0.4
0.4
0.3
0.3
0.2
0.2
0.1
0.1
0
0
−0.1
0
50
100
150 t
200
250
300
−0.1
0
50
100
ωf = 0.8ω
150 t
200
250
300
ωf = ω
0.4
0.4
λa
0.3
0.3
λN
0.2
0.2
0.1
0.1
0
0
−0.1
0
50
100
150 t
200
250
300
−0.1
λ1
0
50
100
ωf = 1.2ω 0.4
0.3
0.3
0.2
0.2
0.1
0.1
0
0 0
50
100
150 t
200
250
300
200
250
300
ωf = 1.5ω
0.4
−0.1
150 t
200
250
300
−0.1
0
50
100
150 t
Figure 3.39 Morse oscillator Lyapunov exponents, Eo = 1, λ = 0.005, ω f -varying, χ = −0.025.
87
3.4 The Driven Morse and Pöschl-Teller Oscillators
ωf = 0.2ω
ωf = 0.5ω
20
20
10
10
0
0
−10
−10
−20 −20
−10
0
10
20
−20 −20
−10
ωf = 0.8ω 20
10
10
0
0
−10
−10 −10
0
10
20
−20 −20
−10
ωf = 1.2ω 10
10
5
0
0
−10
−5 −10
0
20
0
10
20
2
4
ωf = 1.5ω
20
−20 −20
10
ωf = ω
20
−20 −20
0
10
20
−10 −4
−2
0
Figure 3.40 Morse oscillator phase space, Eo = 10, λ = 0.005, ω f -varying, χ = −0.025.
88
3.4 The Driven Morse and Pöschl-Teller Oscillators
ωf = 0.2ω
ωf = 0.5ω
1
1
0.8
0.8
0.6
0.6
0.4
0.4
0.2
0.2
0
0
20
40
60
80
100
0
0
20
40
t ωf = 0.8ω 1
0.8
0.8
0.6
0.6
0.4
0.4
0.2
0.2
0
20
40
60
80
100
0
0
20
40
ωf = 1.2ω
0.8
0.8
0.6
0.6
0.4
0.4
0.2
0.2
40
60 t
80
100
80
100
ωf = 1.5ω 1
20
60 t
1
0
100
Persistence P(0−1) P(0−2) P(0−3) P(0−4)
t
0
80
ωf = ω
1
0
60 t
80
100
0
0
20
40
60 t
Figure 3.41 Morse oscillator transition probabilities, Eo = 10, λ = 0.005, ω f -varying, χ = −0.025.
3.4 The Driven Morse and Pöschl-Teller Oscillators
89
In Fig. 3.41 I plot the transition probabilities for the Morse system with the same parameter values as in Fig. 3.40. The plots for ω f = 0.2ω, ω f = ω, and ω f = 1.2ω have sharp spikes at certain times. The ω f − 0.5 plots show small nonzero probabilities of the system ending up in one of the five lowest energy levels. In the ω f = 1.5ω plots there is a central dip in lower-level probabilities when the driving force is strongest but the system returns to the ground state afterwards. As was the case for the phase plots in Fig. 3.40, the ω f = 1.5ω transition probabilities most closely resemble those of the SHO system (see Fig. 3.22). In Fig. 3.42 I plot the Lyapunov exponents for the Morse system for various values of ω f , keeping the other parameters the same as in Fig. 3.40 and Fig. 3.41. As was the case in the last two figures, the ω f = 1.5ω plot most closely resembles the SHO case (see Fig. 3.23). The λ1 exponent oscillates more positively than the other two, though none of the LE show any of the "ramping up" effect due to the driving force which may be seen in chaotic systems. The plots for ω f = 0.2ω through ω f = 1.2ω all show similar features: All three LE begin to oscillate and ramp up as the driving force is on, and then fall off at their tail end for larger times. The λ1 is almost always on top, followed by λa and then λN . In the case of ω f = 0.8ω there is a downward spike in both λa and λN at around t = 90. The oscillations in λN generally stretch more downward than those of the other LE. It is at the limit of large t that chaoticity may be determined. The plots for ω f = 0.2ω through ω f = 1.2ω all appear to have some slight nonzero value for large t, with the largest values seen in ω f = 0.2ω. There may be chaos present in each of these cases, with ω f = 0.2ω as the most likely candidate, if the strongly divergent phase-space trajectories that were seen Fig. 3.40 are any indication.
90
3.4 The Driven Morse and Pöschl-Teller Oscillators
ωf = 0.2ω
ωf = 0.5ω
0.4
0.4
0.3
0.3
0.2
0.2
0.1
0.1
0
0
−0.1
0
100
200
300
−0.1
t
0
50
100
150 t
ωf = 0.8ω
ωf = ω
200
250
300
0.4
0.4
λa
0.3
0.3
λN
0.2
0.2
λ1
0.1
0.1
0
0
−0.1
0
100
200
300
−0.1
t
150 t
ωf = 1.2ω
ωf = 1.5ω
0.4
0.4
0.3
0.3
0.2
0.2
0.1
0.1
0
0
−0.1
0
100
200 t
300
−0.1
0
0
50
50
100
100
150 t
200
250
300
200
250
300
Figure 3.42 Morse oscillator Lyapunov exponents, Eo = 10, λ = 0.005, ω f -varying, χ = −0.025.
3.4 The Driven Morse and Pöschl-Teller Oscillators
3.4.4
91
Anharmonicity Parameter
I will now take a look at how different values of the anharmonicity parameter χ affect the phase plots, transition probabilities, and Lyapunov exponents of anharmonic oscillator systems. As I mentioned in the beginning of Sec. 3.4, positive χ values correspond to Pöschl-Teller oscillators, while negative χ values correspond to Morse oscillators. As usual, I will first make the plots for Eo = 1 and then again for Eo = 10. There will be no direct comparisons made with any of the plots in Sec. 3.2, where variation of anharmonicity was not an option (for obvious reasons). In Fig. 3.43 I plot the phase-space trajectories for values of χ ranging from −0.8 to +0.8, with Eo = 1, λ = 0.05, and ω f = ω. For χ = −0.8 the trajectories are densely packed and make many revolutions before reaching the final limit, though the radius of that limit is much smaller than in the other plots. In the plot of χ = +0.8 the trajectories start to make a t-bone shape, which means that a double-lobe in the limit cycles could be present for greater values of Eo . For χ = −0.2, −0.02, and +0.02 the trajectories are mostly as we have seen before for the Morse oscillator: they spiral outward in a clockwise direction, then fall back in to a smaller limit cycle. The size of the limit cycle is smaller for the systems with χ further away from 0, which corresponds to the SHO. This happens because the systems are being driven at the resonance frequency of the SHO (i.e. ω f = ω), which is not necessarily the resonance frequency of an AO: the greater the magnitude of χ, the further off-resonance the system is being driven. None of the plots show any significant separation between the red and blue trajectories. In Fig. 3.44 I plot the transition probabilities for the same systems. For χ = −0.8 there is no significant probability of transitions at any time. For χ = +0.8, there is an upward bump in some of the lower-level transitions at t = 50, but by later times the persistence probability has returned to about 95%, with P01 at around 5% and the rest at zero. Closer to χ = 0 the lower-level probabilities are more likely to vanish while the system is forced. This reinforces what was seen in the phase plots: the closer a system is to being harmonic
92
3.4 The Driven Morse and Pöschl-Teller Oscillators
χ = −0.8
0.4 0.2
1
0
0
−0.2
−1
−0.4 −0.04
−0.02
0
0.02
0.04
χ = −0.02
10
−2 −1.5
5
0
0
−5
−5 −4
−2
0
2
4
6
χ = +0.2
2
−10 −6
0.5
0
0
−1
−0.5 −2
−1
0
−0.5
1
2
3
−1 −3
0
0.5
1
1.5
2
4
6
1
2
3
χ = +0.02
−4
−2
0 χ = +0.8
1
1
−2 −3
−1
10
5
−10 −6
χ = −0.2
2
−2
−1
0
Figure 3.43 Morse and Pöschl-Teller oscillator phase space, Eo = 1, λ = 0.005, ω f = ω, χ-varying.
93
3.4 The Driven Morse and Pöschl-Teller Oscillators
χ = −0.8
1 0.8
0.8 Persistence P(0−1) P(0−2) P(0−3) P(0−4)
0.6 0.4 0.2 0
χ = −0.2
1
0.6 0.4 0.2
0
20
40
60
80
100
0
0
20
40
t χ = −0.02
1
0.8
0.6
0.6
0.4
0.4
0.2
0.2
0
20
40
60
80
100
0
0
20
40
t
0.8
0.6
0.6
0.4
0.4
0.2
0.2
0
20
40
60 t
60
80
100
60
80
100
χ = 0.8
1
0.8
0
100
t
χ = 0.2
1
80
χ = 0.02
1
0.8
0
60 t
80
100
0
0
20
40 t
Figure 3.44 Morse and Pöschl-Teller oscillator transition probabilities, Eo = 1, λ = 0.005, ω f = ω, χ-varying.
3.4 The Driven Morse and Pöschl-Teller Oscillators
94
(χ = 0), the closer ω f = ω is to resonance. In Fig. 3.45 I plot the Lyapunov exponents for these systems. The plots for the Morse oscillators (negative χ) are mostly flat, with a few ripples in λ1 that get bigger as χ approaches zero. For the Pöschl-Teller oscillators with χ = +0.2 and +0.8 there are more positive-valued oscillations in λa and λN , and in χ = +0.2 all three of the LE make a small hump with a decaying tail for later t. At the limit of large t it looks like the LE may approach some positive nonzero value, but that may not be the case. Since neither the phase plots nor the transition probabilities appear to give any hint that chaos is present, it would seem that there is not chaos present in these systems. I will now take a look at what happens when χ is varied for Eo = 10, the region where chaos is more likely. In Fig. 3.46 I plot the phase-space trajectories for values of χ ranging from −0.8 to +0.8, with λ = 0.05, ω f = ω, and now with Eo = 10. As before, for χ = −0.8 the trajectories are densely packed and make many revolutions before reaching the final limit, though the gap in radius size between this plot and the others isn’t as significant anymore. In the plot of χ = +0.8 the trajectories now show the double-lobe in the limit cycles that was predicted from the t-bone shapes in Fig. 3.43. The most significant feature of these phase plots is the separation of the red and blue trajectories for χ = −0.2: This value of χ appears to be a strong candidate for chaos. In Fig. 3.47 I plot the transition probabilities for the same systems. For χ = −0.8 there is little significant probability of transitions, as was the case in Fig. 3.44. For χ = −0.2, χ = +0.2, and χ = +0.8 there remain at later times some nonzero probability of transitions to lower levels. What is most interesting in these plots is the spikes that are present for χ = −0.2, through χ = +0.8. The spikes form a hump centered around t = 50 and are more numerous for systems with χ of greater magnitudes (χ = −0.8 excepted). In Fig. 3.48 I plot the Lyapunov exponents for these systems. In comparison with the Eo = 1 plots in Fig. 3.45, the LE for the Pöschl-Teller oscillators (χ > 0) are mostly the same, just with larger ripples and slightly more positive humps. The values of these exponents for χ = +0.02,
95
3.4 The Driven Morse and Pöschl-Teller Oscillators
χ = −0.8
χ = −0.2
0.4
0.4
0.3
0.3
0.2
0.2
0.1
0.1
0
0
−0.1
0
50
100
150 t
200
250
300
−0.1
0
50
100
χ = −0.02
150 t
200
250
300
χ = 0.02
0.4
0.4
λa
0.3
0.3
λN
0.2
0.2
0.1
0.1
0
0
−0.1
0
50
100
150 t
200
250
300
−0.1
λ1
0
50
100
χ = 0.2 0.4
0.3
0.3
0.2
0.2
0.1
0.1
0
0 0
50
100
150 t
200
250
300
200
250
300
χ = 0.8
0.4
−0.1
150 t
200
250
300
−0.1
0
50
100
150 t
Figure 3.45 Morse and Pöschl-Teller oscillator Lyapunov exponents, Eo = 1, λ = 0.005, ω f = ω, χ-varying.
96
3.4 The Driven Morse and Pöschl-Teller Oscillators
χ = −0.8
χ = −0.2
4
10
2
5
0
0
−2
−5
−4 −0.2
−0.1
0
0.1
0.2
−10 −10
−5
χ = −0.02 10
10
5
0
0
−10
−5
−10
0
5
10
χ = +0.02
20
−20 −20
0
10
20
30
−10 −15
−10
χ = +0.2
−5
0
5
10
χ = +0.8
5
4 2
0
0 −2
−5 −10
−5
0
5
10
−4 −10
−5
0
5
10
Figure 3.46 Morse and Pöschl-Teller oscillator phase space, Eo = 10, λ = 0.005, ω f = ω, χ-varying.
97
3.4 The Driven Morse and Pöschl-Teller Oscillators
χ = −0.8
1 0.8
0.8
0.6
0.6
0.4
0.4
0.2
0.2
0
0
20
40
60
χ = −0.2
1
80
100
0
0
20
40
t χ = −0.02
1
100
60
80
100
60
80
100
0.8 Persistence P(0−1) P(0−2) P(0−3) P(0−4)
0.6 0.4 0.2
0.6 0.4 0.2
0
20
40
60
80
100
0
0
20
40
t
t
χ = 0.2
1
0.8
0.6
0.6
0.4
0.4
0.2
0.2
0
20
40
60 t
χ = 0.8
1
0.8
0
80
χ = 0.02
1
0.8
0
60 t
80
100
0
0
20
40 t
Figure 3.47 Morse and Pöschl-Teller oscillator transition probabilities, Eo = 10, λ = 0.005, ω f = ω, χ-varying.
98
3.4 The Driven Morse and Pöschl-Teller Oscillators
χ = −0.8
χ = −0.2
0.4
0.4
0.3
0.3
0.2
0.2
0.1
0.1
0
0
−0.1
0
50
100
150 t
200
250
300
χ = −0.02
0.5
−0.1
0.4
0.3
0.3
0.2
0.2
0.1
0.1
0
0 0
50
100
150 t
200
250
300
χ = 0.2
0.5
−0.1
0.4
0.3
0.3
0.2
0.2
0.1
0.1
0
0 0
50
100
150 t
100
200
250
300
−0.1
150 t
200
250
300
χ = 0.02 λa λN λ1
0
50
100
150 t
200
250
300
200
250
300
χ = 0.8
0.5
0.4
−0.1
50
0.5
0.4
−0.1
0
0
50
100
150 t
Figure 3.48 Morse and Pöschl-Teller oscillator Lyapunov exponents, Eo = 10, λ = 0.005, ω f = ω, χ-varying.
3.4 The Driven Morse and Pöschl-Teller Oscillators
99
+0.2, and +0.8 appear to approach zero for large t, meaning no chaos. What is most striking in Fig. 3.48, though, are the plots of values χ = −0.2 and χ = −0.02: All three of the LE rise sharply at t = 50 and appear to converge to positive values greater than zero at large t. What’s more striking is that neither the next largest χ (+0.02) nor the next smallest χ (−0.8) show the nearly as much positivity in their Lyapunov exponents. This fact, taken with the phase-space trajectory divergence seen in Fig. 3.46, gives stronger support for chaos at χ = −0.2 and χ = −0.02 than for the other values.
3.4.5
Continuous (Sinusoidal) Driving Force
I will finally explore a special case of the driven anharmonic oscillators: In the limit that λ = 0, the driving force is simply a sine wave of the form f (t) = Eo sin(ω f t), with no beginning or ending time. I will now take a look at what happens when Morse systems of various Eo are driven by this continuous sinusoidal force. In Fig. 3.49 I plot the phase-space trajectories for the Morse oscillator with ω f = ω, χ = −0.025, and with Eo varying from 0.1 to 100. The plots of Eo = 0.1 and Eo = 1 both appear to be pretty regular in their shape, with no real separation between the red and blue. With Eo = 3, the phase plot takes on a much more unusual shape. It appears that the single loop limit cycle is just beginning to form the double lobe cycle that is visible in the plots for larger Eo . The plot for Eo = 30 is also unusual in how "regular" it is compared to the plots for larger and smaller Eo . The plots that show a strong separation between the red and blue trajectories are Eo = 3, 10, and 100, with a noteworthy absence of this trait in Eo = 30. In Fig. 3.50 I now plot the transition probabilities for these systems. There appear to be periodic oscillations in the transition probabilities for Eo = 0.1, 1, and 30, while the plots for Eo = 3, 10, and 100 seem to be comprised of spikes which aren’t distributed with any fixed periodicity. This separates the plots into the same groups as did the divergence of red and blue trajectories in
100
3.4 The Driven Morse and Pöschl-Teller Oscillators
Eo = 0.1
Eo = 1
4
10
2
5
0
0
−2
−5
−4 −3
−2
−1
0
1
2
3
−10 −5
0
Eo = 3
Eo = 10
20
20
10
10
0
0
−10
−10
−20 −20
−10
0
10
20
−20 −30
−20
−10
Eo = 30 40
10
20
0
0
−10
−20
−20
−10
0
0
10
20
30
Eo = 100
20
−20 −30
5
10
20
30
−40 −40
−20
0
20
40
Figure 3.49 Morse oscillator phase space, Eo -varying, λ = 0, ω f = ω, χ = −0.025.
101
3.4 The Driven Morse and Pöschl-Teller Oscillators
Eo = 0.1
Eo = 1
1
1
0.8
0.8
0.6
0.6
0.4
0.4
0.2
0.2
0
0
20
40
60
80
100
0
0
20
40
t Eo = 3
100
60
80
100
80
100
1
0.8
Persistence P(0−1) P(0−2) P(0−3) P(0−4)
0.6 0.4 0.2
0.8 0.6 0.4 0.2
0
20
40
60
80
100
0
0
20
40
t
t
Eo = 30
Eo = 100
1
1
0.8
0.8
0.6
0.6
0.4
0.4
0.2
0.2
0
80
Eo = 10
1
0
60 t
0
20
40
60 t
80
100
0
0
20
40
60 t
Figure 3.50 Morse oscillator transition probabilities, Eo -varying, λ = 0, ω f = ω, χ = −0.025.
3.5 The Caldirola-Kanai Damped SHO
102
Fig. 3.49. In Fig. 3.51 I plot the Lyapunov exponents for the sinusoidally-forced system used in the last two figures. What’s worth noting here is that the LE for Eo = 3, 10, and 100 all converge to positive, nonzero values, while the other three plots seem to converge to zero. This is the third indication that chaos is present in this system for Eo ≥ 3 EXCEPT for Eo = 30. I decided to investigate the Lyapunov exponents at points around Eo = 3 and Eo = 30 to determine when chaos turns on and off. In Fig. 3.52 I plot the LE again, this time for values of Eo leading up to 3 and 30 and over the extended time range of [0, 900] so that I can better determine whether the LE go to zero or stay positive. In the plots of Eo = 2.8 and Eo = 2.85 all three LE converge to zero pretty quickly, but for Eo = 2.9 they now seem to be converging to positive nonzero values at later times. The turn-on point for chaos appears to be between 2.85 and 2.9. In the plot of Eo = 27 I can see the system is still chaotic, but when I move to Eo = 27.5 and higher the signs of chaos disappear. The turn-off point appears to be between 27 and 27.5. To find out where the chaos turns back on I followed the same procedure and made plots for Eo = 30 through Eo = 35 (not included in this thesis). This suppression of chaos is present until Eo = 32.5, at which point chaos can once again be seen for higher values of Eo . I’m not sure what causes the signatures of chaos to be suppressed over this particular range in this system, but it is an interesting feature, nonetheless.
3.5
The Caldirola-Kanai Damped SHO
In order to address the issue of dissipative systems I look at the driven Caldirola-Kanai SHO [25], whose Hamiltonian is the following: p2 1 2γt . H = e−2γt + e mω 2 x2 − f (t)x, 2m 2
(3.12)
103
3.5 The Caldirola-Kanai Damped SHO
Eo = 0.1
Eo = 1
0.4
0.4
0.3
0.3
0.2
0.2
0.1
0.1
0
0
−0.1
0
50
100
150 t
200
250
300
−0.1
0
50
100
Eo = 3
150 t
200
250
300
Eo = 10
0.5
0.5
0.4
0.4
λa
0.3
0.3
λN
0.2
0.2
λ1
0.1
0.1
0
0
−0.1
0
50
100
150 t
200
250
300
−0.1
0
50
100
Eo = 30 0.5
0.4
0.4
0.3
0.3
0.2
0.2
0.1
0.1
0
0 0
50
100
150 t
200
250
300
200
250
300
Eo = 100
0.5
−0.1
150 t
200
250
300
−0.1
0
50
100
150 t
Figure 3.51 Morse oscillator Lyapunov exponents, Eo -varying, λ = 0, ω f = ω, χ = −0.025.
104
3.5 The Caldirola-Kanai Damped SHO
Eo = 2.8
Eo = 2.85
0.3
0.3
0.2
0.2
0.1
0.1
0
0
−0.1
0
200
400
600
800
−0.1
0
200
400
t Eo = 2.9 0.3
0.2
0.2
0.1
0.1
0
0
0
200
400
600
800
−0.1
0
200
400
t Eo = 27.5
0.2
0.2
0.1
0.1
0
0
200
400
600 t
800
Eo = 30 0.3
0
600 t
0.3
−0.1
800
Eo = 27
0.3
−0.1
600 t
800
−0.1
λa λN λ1
0
200
400
600
800
t
Figure 3.52 Morse oscillator Lyapunov exponents, Eo -varying near points of chaoticity, λ = 0, ω f = ω, χ = −0.025.
105
3.5 The Caldirola-Kanai Damped SHO
where γ specifies the damping of the system. The form of this Hamiltonian is chosen so that the Hamilton equations of motion of this system lead to a differential equation with a term that resembles classical damping: p˙ = −e2γt mω 2 x + f (t), x˙ = e−2γt
p , m
⇒ x¨ + 2γ x˙ + ω 2 x = f (t)
(3.13) (3.14)
e−2γt . m
(3.15)
The time evolution operator could be solved using the ladder operator algebra as with the SHO, but the time-dependent γ exponential in front the kinetic and potential energy terms leads to timedependent operators a, a† and N [26]. I can instead rewrite the Hamiltonian as . 1 H = [cosh(2γ)(p2 + x2 ) − sinh(2γ)(p2 − x2 )] − f (t)x, 2
(3.16)
with m = ω = 1. I can now propose the following time-independent algebra for this system: � A = p, x, (p2 + x2 ), (p2 − x2 ), (xp + px), 1 .
(3.17)
Unlike the algebras seen in Eq. (2.50) and Eq. (2.42), this algebra has six elements rather than four, and while not every element appears in Eq. (3.16) all six are necessary for the algebra to maintain closure under commutation (see Sec. 2.4.3). I choose a Wei-Norman ansatz for the time-evolution operator, 2 2 2 2 . U(t) = eα p p eαx x eα p2+x2 (p +x ) eα p2−x2 (p −x ) eαxp+px (xp+px) eα1 1 ,
(3.18)
which I then plug into the Schrödinger equation. Using the same process as outlined in Appendix A I can solve for all six of the α parameters. Once I have solved all the α’s I can calculate a Lyapunov exponent for each of them. In Fig. 3.53 I plot the LE corresponding to each element of my algebra basis at various values of damping γ, using the same Gaussian pulse as before as the driving force. For γ = 0 the LE are
106
3.5 The Caldirola-Kanai Damped SHO
γ=0
γ = 0.08
0.4
0.4
0.3
0.3
0.2
0.2
0.1
0.1
0
0
−0.1
0
50
100
150 t
200
250
300
γ = 0.1
0.5
−0.1
0.4
0.3
0.3
0.2
0.2
0.1
0.1
0
0 0
50
100
150 t
200
250
300
γ = 0.15
0.5
50
100
−0.1
150 t
200
250
300
200
250
300
γ = 0.12
0.5
0.4
−0.1
0
0
50
100
150 t γ = 0.2
0.5
λp λx
0.4
0.4
0.3
0.3
0.2
0.2
λ(p2+x2) λ(p2−x2) λ(xp+px)
0.1
0.1
λ1
0
0
−0.1
0
50
100
150 t
200
250
300
−0.1
0
50
100
150 t
200
250
300
Figure 3.53 Caldirola-Kanai oscillator Lyapunov exponents, Eo = 1, λ = 0.005, ω f = ω, γ-varying.
3.5 The Caldirola-Kanai Damped SHO
107
all zero except for λ1 , which starts out negative and slowly approaches zero as t increases. For γ = 0.08 through γ = 0.12 we can see some interesting behavior: Three of the LE’s (λ p , λx , and λ1 ) initially rise to a large positive and then level out. A little later when the force starts to act, λ1 jumps to an even higher positive value. This value is greater when γ is closer to zero; for γ = 0.15 the jump in λ1 is much smaller, while λ p and λx also go to smaller values. Finally, for γ = 0.2 all of the LE converge to zero by about t = 100. For this system it appears that a small amount of damping leads to chaos, while there is no chaos when the damping is too strong, i.e. when γ > 0.15. However, I’ve only performed a cursory exploration of the system, and I would have to take a closer look before I could come to any certain conclusions about chaos. My results for the Caldirola-Kanai SHO are more akin to a "proof of concept" of a different algebra (corresponding to a dissipative system) than they are an exhaustive investigation of this system.
Chapter 4 Conclusion 4.1
Summary of Results
In this work I have studied how the time dependence of quantum systems can be solved in a variety of ways. I have studied an analytic method based on the Andrews ansatz. I then extensively explored the Wei-Norman Lie algebra method in order to find the time evolution of relevant properties of a system. I have shown that this method reproduces exactly the time evolution of the wave function found using the Andrews ansatz method in the FP and SHO cases. In particular I have been interested in plotting the phase-space trajectories, the transition probabilities, and the Lyapunov exponents for some chosen dynamical systems. The Wei-Norman ansatz parameter solutions open a new window on the study of quantum chaos, which is defined by the appearance of chaos-like properties in the solutions of classicallooking coupled differential equations pertaining to the α parameters. I have included systems in which I wasn’t expecting to find chaos (namely the FP and the SHO) in order to get a better handle on the method and to serve as a point of comparison for potentially chaotic systems. The first system I investigated was the driven free particle. The Lyapunov exponents of the FP
108
4.1 Summary of Results
109
have interesting features, but don’t appear to indicate the presence of chaos. I was not expecting to find chaos in this system. In studying the driven SHO, I found that it absorbs more energy from driving forces that have: (a) more strength, (b) longer duration, and (c) driving frequencies closer to resonance (i.e., ω f = ω). In the plots of Lyapunov exponents, the value of the phase λ1 is greater for larger driving forces Eo and smaller inverse envelope width λ while the force is acting, but in all cases λ1 appears to eventually go to zero long after the force has passed. Chaos does not seem to be present in this system for any value of Eo , λ , or ω f . The classical Duffing oscillator was studied to show what chaos should look like. Chaos can be seen when Eo is sufficiently large: the Lyapunov exponents go positive in the limit of large t, and the phase-space trajectories show a divergence between the initially similar systems (portrayed as red and blue curves in the figures). The Morse oscillator with anharmonicity parameter χ = −0.025 seems to absorb less energy from a driving force of magnitude Eo = 1 than it does from the driving forces of both higher and lower strengths that I have probed. It also responds most strongly when the driving frequency is around ω f = 0.8ω, instead of at ω f = ω like the SHO. Chaos appears to be possible in Morse oscillators when they are driven with forces of magnitude Eo = 5 or greater. Signs of chaos can be seen at Eo = 10 for systems with λ ≤ 0.005 and ω f ≤ 1.2ω. For a Morse oscillator driven with a continuous sinusoidal force, chaos is present for Eo > 2.85, except for the region where 27.5 ≤ E0 ≤ 32.5, where the chaos is somehow suppressed. There is an inverse relationship in anharmonic oscillator systems between the magnitude of the anharmonicity parameter χ and the response at driving frequency ω f = ω. The strongest evidence of chaos is seen for Morse systems with χ = −0.2 and χ = −0.02, but not for the systems with higher or lower values of χ that I probed. Chaotic systems seem to all share three visible traits: (1) divergence of the initially close (red
4.2 Discussion
110
and blue) trajectories in the phase plots, as well as a greater coverage of phase space, (2) "spikes" in the lower-level transition probabilities, and (3) all of the Lyapunov exponents grow to some positive value while being forced, and then decay until reaching some positive nonzero limit as t → ∞. One can notice that the Lyapunov exponents corresponding to the unitary element 1 are consistently higher than the others. The next highest exponents correspond to the linear elements x and p, (or a and a† ), while the lowest exponents are seen for the quadratic elements N (= a† a), x2 + p2 , x2 − p2 , and xp + px. There is a hierarchy present, with the LE of higher-order algebra elements having lower values. This is caused by the propensity of the commutators of higher-order algebra elements to contribute terms to the differential equations for the lower-ordered elements. Because the commutators are passed downward and not upward, the equation for α1 is typically the longest and most nonlinear of the set.
4.2
Discussion
Some specific points in this research should be highlighted. This study is necessarily limited in the dynamical systems considered, and in the values of the parameters explored. But even in the limited parameter space, we find interesting results. It makes sense that chaos is more likely when the driving force strength and the pulse envelope width are greater. The fact that the Morse oscillator is more responsive at frequencies lower than the SHO can be explained by the fact that the natural frequency of the AO system is a function of the anharmonicity parameter χ. The relationship between χ and the chaoticity of the system is interesting and not easily explained. The Pöschl-Teller oscillator was not explored as systematically as the Morse oscillator. Perhaps some further exploration of those systems could help explain how they depend physically upon the anharmonicity parameter.
4.3 Future Research
111
Much of my time during the research process was spent waiting for my Maple code to compile. I didn’t have any problems when I was only looking at phase-space plots, but when I starting plotting transition probabilities I noticed that Maple v.15 really began to struggle. Perhaps there were ways that I could have written my code to run more efficiently. When I finally decided to switch to Mathematica, and eventually Matlab, I noticed a dramatic improvement in how quickly I was able to compile the transition probabilities. Using the best tools can make a significant difference. Another part of my research that was particularly time-consuming was working out the BCH relations by hand to simplify the Wei-Norman ansatz for the Schrödinger equation. A computer code that handles all the commutators could have sped thing up quite a bit. Those who wish to use the Lie algebra method to solve for complicated Hamiltonians would be wise to find or create a program that can automate the algebra work needed to arrive at the coupled ODE’s for the α parameters.
4.3
Future Research
A natural continuation of this research would look at many more dynamical systems using many different Lie algebras. I would like see the parameter spaces of the solutions explored more thoroughly so that chaotic regions of these systems could be more precisely defined.
Appendix A Wei-Norman Factorizations In this appendix we show how to factorize the
∂U(t) −1 ∂t U (t)
in the LHS of the time evolution
Schrödinger equation. This will be shown explicitly for the driven FP and the driven SHO.
A.1
Driven Free Particle
2 . For the driven free particle we will use the algebra given by Eq. (2.50): A = {1, x, ∂∂x , ∂∂x2 }. The
Wei-Norman ansatz of the time evolution operator corresponding to this algebra is 2 ∂ α (t) ∂ . U(t) = eα1 (t) eα2 (t)x eα3 (t) ∂ x e 4 ∂ x2 .
(A.1)
The Schrödinger equation for U(t) is then given by the following: i¯h
2 2 ∂ α (t) ∂ ∂ ∂U(t) −1 ∂ . . −α (t) ∂ U (t) = i¯h [ (eα1 (t) eα2 (t)x eα3 (t) ∂ x e 4 ∂ x2 )](e 4 ∂ x2 e−α3 (t) ∂ x e−α2 (t)x e−α1 (t) ) = H . ∂t ∂t (A.2)
To factorize the LHS of this equation we first take the time derivative of U(t), one exponent at a time, to end up with the sum of four terms: ∂U(t) ∂t
2 2 ∂ α (t) ∂ ∂ α (t) ∂ . = (α˙1 (t))eα1 (t) eα2 (t)x eα3 (t) ∂ x e 4 ∂ x2 + eα1 (t) (α˙2 (t)x)eα2 (t)x eα3 (t) ∂ x e 4 ∂ x2 ∂
α4 (t)
+eα1 (t) eα2 (t)x (α˙3 (t) ∂∂x )eα3 (t) ∂ x e
∂2 ∂ x2
∂
2
α4 (t)
+ eα1 (t) eα2 (t)x eα3 (t) ∂ x (α˙4 (t) ∂∂x2 )e
112
∂2 ∂ x2
.
(A.3)
113
A.1 Driven Free Particle Then we multiply each term by U −1 (t) to the right: ∂2 ∂2 ∂U(t) −1 . α1 (t) α2 (t)x α3 (t) ∂∂x α4 (t) ∂ x2 −α4 (t) ∂ x2 −α3 (t) ∂∂x −α2 (t)x −α1 (t) ˙ e e e e e e e U (t) = (α1 (t))e ∂t ∂
α4 (t)
+ eα1 (t) (α˙2 (t)x)eα2 (t)x eα3 (t) ∂ x e
∂2 ∂ x2
−α4 (t)
e
∂2 ∂ x2
(A.4)
∂
e−α3 (t) ∂ x e−α2 (t)x e−α1 (t)
∂ α3 (t) ∂ α4 (t) ∂ 22 −α4 (t) ∂ 22 −α3 (t) ∂ −α2 (t)x −α1 (t) ∂x e ∂x e ∂x e ∂x e )e e ∂x ∂ ∂ ∂ 2 α (t) ∂ 2 −α (t) ∂ 2 + eα1 (t) eα2 (t)x eα3 (t) ∂ x (α˙4 (t) 2 )e 4 ∂ x2 e 4 ∂ x2 e−α3 (t) ∂ x e−α2 (t)x e−α1 (t) . ∂x
+ eα1 (t) eα2 (t)x (α˙3 (t)
The α˙i (t) in each term can be moved to the front, but the Lie algebra elements (such as x and
∂ ∂x)
can’t be moved without consideration of their commutativity with the exponents. The goal now is to cancel out each exponential factor with its inverse. We can start with the factors that aren’t separated by a Lie algebra element: ∂U(t) −1 . U (t) = α˙1 (t) ∂t
(A.5)
+ α˙2 (t)eα1 (t) (x)e−α1 (t) ∂ −α2 (t)x −α1 (t) )e e ∂x 2 ∂ α1 (t) α2 (t)x α3 (t) ∂∂x ∂ ˙ + α4 (t)e e e ( 2 )e−α3 (t) ∂ x e−α2 (t)x e−α1 (t) . ∂x + α˙3 (t)eα1 (t) eα2 (t)x (
To simplify the remaining exponential factors we can use the Baker-Campbell-Hausdorff (BCH) identity: λA
e
−λ A
Be
λ λ2 λ3 . = B + [A, B] + [A, [A, B]] + [A, [A, [A, B]]] + ..., 1! 2! 3!
(A.6)
where A and B are any two Lie algebra elements and λ is some constant. This series may be infinite, or it will be truncated as soon as a nested commutator equals zero. The four-element algebra we’re using has the following commutator values: ∂ . ∂2 . . [1, x] = [1, ] = [1, 2 ] = 0, ∂x ∂x
(A.7)
∂ ∂2 . , ] = 0, ∂ x ∂ x2
(A.8)
[
114
A.1 Driven Free Particle ∂ . ] = −1, ∂x ∂2 . ∂ [x, 2 ] = −2 . ∂x ∂x [x,
(A.9) (A.10)
The only nonzero nested commutator is the following: [x, [x,
∂2 . ∂ . ]] = −2 [x, ] = 2. 2 ∂x ∂x
(A.11)
All other nested commutators will equal zero, which means the series given by Eq. (A.6) will have three or less terms for any combination of algebra elements in our chosen set. We can automatically cancel out every eα1 (t) in Eq. (A.5) since 1 commutes with everything. This leaves us with the following: � � � � �� ∂ ∂ α2 (t)2 ∂ −α2 (t)x . ∂ = + α2 (t) x, + x, x, + ... e ( )e ∂x ∂x ∂x 2 ∂x . ∂ = − α2 (t), ∂x � � 2 ∂ ∂2 . ∂2 α3 (t) ∂∂x ∂ −α3 (t) ∂∂x e ( 2 )e = + α3 (t) , + ... ∂x ∂ x2 ∂ x ∂ x2 . ∂2 , = ∂ x2 � � � � �� 2 ∂2 α2 (t)2 ∂2 . ∂2 α2 (t)x ∂ −α2 (t)x e ( 2 )e = + α2 (t) x, 2 + x, x, 2 + ... ∂x ∂ x2 ∂x 2 ∂x 2 ∂ . ∂ − 2α (t) + α2 (t)2 . = 2 ∂ x2 ∂x α2 (t)x
(A.12)
(A.13)
(A.14)
Once we plug these identities into Eq. (A.5) we get the following: ∂U(t) −1 ∂ ∂ ∂2 . U (t) = α˙1 (t) + α˙2 (t)x + α˙3 (t)[ − α2 (t)] + α˙4 (t)[ 2 − 2α2 (t) + α2 (t)2 ] ∂t ∂x ∂x ∂x � . � = α˙1 (t) − α˙3 (t)α2 (t) + α˙4 (t)α2 (t)2 + α˙2 (t)x (A.15) + [α˙3 (t) − 2α˙4 (t)α2 (t)]
∂ ∂2 + α˙4 (t) 2 , ∂x ∂x
where the coefficients have been gathered for each Lie algebra element. The last step is to substitute this factorization into the LHS of Eq. (A.2) and then equate the terms in Eq. (A.15) with the coefficients of the corresponding Lie algebra elements in the hamiltonian H .
115
A.2 Driven Simple Harmonic Oscillator
A.2
Driven Simple Harmonic Oscillator
The process for factorizing the
∂U(t) −1 ∂t U (t)
term for the driven SHO is the same as for the driven
FP. The only difference is in the Lie algebra elements used and their corresponding commutator . � values. For the driven SHO we will use the algebra given by Eq. (2.42): A = a† , a, N, 1 . The corresponding Wei-Norman ansatz for the time evolution operator is † . U(t) = eα1 (t)a eα2 (t)a eα3 (t)N eα4 (t)1 .
(A.16)
We repeat the steps used for the driven FP by taking the time derivative of each exponential factor and canceling out the exponential factors that aren’t separated by Lie algebra elements. This give us the following equation, comparable to Eq. (A.5): ∂U(t) −1 . U (t) = α˙1 (t)a† ∂t
(A.17) †
†
+ α˙2 (t)eα1 (t)a (a)e−α1 (t)a †
†
+ α˙3 (t)eα1 (t)a eα2 (t)a (N)e−α2 (t)a e−α1 (t)a †
†
+ α˙4 (t)eα1 (t)a eα2 (t)a eα3 (t)N (1)e−α3 (t)N e−α2 (t)a e−α1 (t)a . As in Sec. A.1 we will use the BCH identity given by Eq. (A.6). The commutator values for the ladder operator algebra are the following (as given in Sec. 2.4.3): . . . [1, a] = [1, a† ] = [1, N] = 0,
(A.18)
. [a† , a] = −1,
(A.19)
. [a, N] = a,
(A.20)
. [a† , N] = −a† .
(A.21)
A.2 Driven Simple Harmonic Oscillator
116
These commutators lead to the following BCH identities: α1 (t)a†
e
−α1 (t)a†
(a)e
h i α (t)2 h h ii . 1 † † † = a + α1 (t) a , a + a , a , a + ... 2 . = a − α1 (t),
. eα2 (t)a (N)e−α2 (t)a = N + α2 (t) [a, N] + ...
†
eα1 (t)a (N)e−α1 (t)a
†
. = N + α2 (t)a, h i . † = N + α1 (t) a , N + ...
(A.22)
(A.23)
(A.24)
. = N − α1 (t)a† . Once we plug these identities into Eq. (A.17) we get the following: ∂U(t) −1 . U (t) = α˙1 (t)a† + α˙2 (t)[a − α1 (t)] + α˙3 (t)[N − α1 (t)a† + α2 (t)(a − α1 (t))] + α˙4 (t) ∂t . = [α˙1 (t) − α˙3 (t)α1 (t)] a† + [α˙2 (t) + α˙3 (t)α2 (t)] a (A.25) + α˙3 (t)N + [α˙4 (t) − α˙2 (t)α1 (t) − α˙3 (t)α2 (t)α1 (t)] , where the coefficients have been gathered for each Lie algebra element. The last step is to substitute this factorization into the LHS of the Schrödiner equation and then equate the terms in Eq. (A.25) with the coefficients of the corresponding Lie algebra elements in the Hamiltonian H .
Bibliography [1] F. Grossmann, Theoretical Femtosecond Physics: Atoms and Molecules in Strong Laser Fields, 1st ed. (Springer-Verlag, New York, NY, 2008), Vol. 48. [2] D. J. Tannor, Introduction to Quantum Mechanics: A Time-Dependent Perspective, 1st ed. (University Science Books, Sausalita, CA, 2007). [3] J. Gleick, Chaos: Making a New Science, 1st ed. (Viking Penguin, New York, NY, 1987). [4] F. Haake, Quantum Signatures of Chaos, 3rd ed. (Springer-Verlag, Berlin Heidelberg, 2010). [5] R. L. Hudson and S. Pulmannová, “Chaotic expansion of elements of the universal enveloping algebra of a Lie algebra associated with a quantum stochastic calculus,” Proc. London Math. Soc. 77, 462–480 (1998). [6] L. E. Kin’kov and S. V. Prants, “Quantum chaos in the group-theoretical picture,” J. Math. Phys. 37, 1204–1217 (1996). [7] M. Andrews, “Quantum mechanics with uniform forces,” Am. J. Phys. 78, 1361–1364 (2010). [8] D. J. Griffiths, Introduction to Quantum Mechanics, 2nd ed. (Addison-Wesley, Boston, MA, 2005).
117
BIBLIOGRAPHY
118
[9] P. Ehrenfest, “Bemerkung über die angenäherte Gültigkeit der klassischen Mechanik innerhalb der Quantenmechanik,” Zeitschrift für Physik A Hadrons and Nuclei 45, 455–457 (1927). [10] E. Merzbacher, Quantum Mechanics, 3rd ed. (Wiley, New York, NY, 1998). [11] H. J. Lipkin, Lie Groups For Pedestrians, 2nd ed. (North-Holland Publishing Co., Amsterdam, 1966). [12] R. Gilmore, Lie Groups, Physics, and Geometry, 1st ed. (Cambridge University Press, New York, NY, 2008). [13] J. Wei and E. Norman, “Lie algebraic solution of linear differential equations,” J. Math. Phys. 4, 575–581 (1963). [14] M. Berrondo and J. Récamier, “Dipole induced transitions in an anharmonic oscillator: A dynamical mean field model,” Chem. Phys. Lett. 503, 180–184 (2011). [15] T. Mullin, The Nature of Chaos (Oxford University Press, New York, NY, 1993). [16] I. Bendixson, “Sur les courbes définies par des équations différentielles,” Acta Mathematica 24, 88 (1901). [17] M. Gutzwiller, Chaos in Classical and Quantum Mechanics, 1st ed. (Springer-Verlag, New York, NY, 1990). [18] P. H. Richter and H. J. Scholz, “Chaos in classical mechanics - The double pendulum,” IN: Stochastic phenomena and chaotic behaviour in complex systems pp. 86–97 (1984). [19] N. Burq and M. Zworski, “Bouncing Ball Modes and Quantum Chaos,” Society for Industrial and Applied Mathematics 47, 43–49 (2005).
BIBLIOGRAPHY
119
[20] L. E. Reichl, The Transition to Chaos: Conservative Classical Systems and Quantum Manifestations (Springer-Verlag, New York, NY, 2004). [21] J. Keating, “Physics and the Queen of Mathematics,” Physics World pp. 46–50 (1990). [22] C. Alexander, “A closed form solution for quantum oscillator perturbations using Lie algebras,” J. Phys. Math. 3 (2011). [23] M. E. Goggin and P. W. Milonni, “Driven Morse oscillator: Classical chaos and quantum theory for two-frequency excitation,” Phys. Rev. A 38, 5174–5181 (1988). [24] P. M. Morse, “Diatomic molecules according to the wave mechanics. II. Vibrational levels.,” Phys. Rev. 34, 57–64 (1929). [25] A. Streklas, “Quantum damped harmonic oscillator on non-commuting plane,” Physica A 385, 124–136 (2007). [26] I. Urdaneta, L. Sandoval, and A. Palma, “On the algebraic approach to the time-dependent quadratic Hamiltonian,” J. Phys. A: Math. Theor. 43 (2010).
Index Abelian, 13 Algebra, 12 Anharmonicity Parameter, 64, 91 Associativity, 12
Lie Algebra, 11, 13 Lie Group, 13, 15 Limit Cycle, 36 Lyapunov Exponent, 24
Baker-Campbell-Hausdorff Identity, 15, 113 Binary Operation, 12
Mean Field, 21 Morse Oscillator, 64
Caldirola-Kanai Oscillator, 17, 102 Classical Chaos, 1, 23 Closure, 12, 16 Commutativity, 12 Commutator, 13, 16
Normal Ordering, 16
Damping, 17 Double Pendulum, 24 Driving Force, 6 Driving Frequency, 52, 82 Duffing Oscillator, 11, 25, 63
Quantum Chaos, 1, 25 Quantum Dynamics, 1 Quartic Potential, 59
Ehrenfest’s Theorem, 6 Ergodicity, 24 Expectation Value, 6 Free Particle, 7, 18, 28 Gaussian Pulse, 26 Group, 13 Hamiltonian, 5 Hermitian Conjugate, 17
Pöschl-Teller Oscillator, 64 Persistence Probability, 23 Phase Space, 22
Schrödinger Equation, 5 Semi-Classical, 6 Simple Harmonic Oscillator, 8, 20 Time Evolution Operator, 14 Transition Probability, 22 Uncertainty Principle, 25 Unitarity, 17 Wave Function, 5 Wei-Norman Ansatz, 14
Identity, 12 Initial Conditions, 7, 9 Inverse, 12 Lagrangian, 7 120