Vasanth Philomin, Ramani Duraiswami, and Larry Davis. Computer Vision Laboratory. Institute ... D. Vernon (Ed.): ECCV 2000, LNCS 1843, pp. 134â149, 2000.
Quasi-Random Sampling for Condensation Vasanth Philomin, Ramani Duraiswami, and Larry Davis Computer Vision Laboratory Institute for Advanced Computer Studies University of Maryland, College Park, MD 20742, USA {vasi, ramani, lsd}@umiacs.umd.edu http://www.umiacs.umd.edu/{~vasi, ~ramani, ~lsd}
Abstract. The problem of tracking pedestrians from a moving car is a challenging one. The Condensation tracking algorithm is appealing for its generality and potential for real-time implementation. However, the conventional Condensation tracker is known to have di�culty with high-dimensional state spaces and unknown motion models. This paper presents an improved algorithm that addresses these problems by using a simplified motion model, and employing quasi-Monte Carlo techniques to e�ciently sample the resulting tracking problem in the high-dimensional state space. For N sample points, these techniques achieve sampling errors of O(N 31 ), as opposed to O(N 31/2 ) for conventional Monte Carlo techniques. We illustrate the algorithm by tracking objects in both synthetic and real sequences, and show that it achieves reliable tracking and significant speed-ups over conventional Monte Carlo techniques.
1
Introduction
Since its introduction, the Condensation algorithm [1] has attracted much interest as it o�ers a framework for dynamic state estimation where the underlying probability density functions (pdfs) need not be Gaussian. The algorithm is based on a Monte Carlo or sampling approach, where the pdf is represented by a set of random samples. As new information becomes available, the posterior distribution of the state variables is updated by recursively propagating these samples (using a motion model as a predictor) and resampling. An accurate dynamical model is essential for robust tracking and for achieving real-time performance. This is due to the fact that the process noise of the model has to be made artificially high in order to track objects that deviate significantly from the learned dynamics, thereby increasing the extent of each predicted cluster in state space. One would then have to increase the sample size to populate these large clusters with enough samples. A high-dimensional state space (required for tracking complex shapes such as pedestrians) only makes matters worse. Isard et al. [2] use two separate trackers, one in the Euclidean similarity space and the other in a separate deformation space, to handle the curse of dimensionality. Our need for a tracking algorithm was for tracking moving objects (such as pedestrians) from a moving camera for applications in driver assistance systems and vehicle guidance that could contribute towards tra�c safety [4, 3]. The D. Vernon (Ed.): ECCV 2000, LNCS 1843, pp. 134−149, 2000. Springer-Verlag Berlin Heidelberg 2000
Quasi-Random Sampling for Condensation
135
problem of pedestrian detection has been addressed in [3] and [5], but without temporal integration of results. We believe that temporal integration of results is essential for the demanding performance rates that might be required for the actual deployment of such a system. This tracking problem, however, is complicated because there is significant camera motion, and objects in the image move according to unpredictable/unknown motion models. We want to make no assumptions about how the camera is moving (translation, rotation, etc.) or about the viewing angle. Hence it is not practically feasible to break up the dynamics into several di�erent motion classes ([6, 7]) and learn the dynamics of each class and the class transition probabilities. We need a general model that is able to cope with the wide variety of motions exhibited by both the camera and the object, as well as with the shape variability of the object being tracked. A common problem that is often overlooked when using the Condensation tracker in higher dimensions is that typical implementations rely on the system supplied rand() function, which is almost always a linear congruential generator. These generators, although very fast, have an inherent weakness that they are not free of sequential correlation on successive calls, i.e. if k random numbers at a time are used to generate points in k-dimensional space, the points will lie on (k � 1)-dimensional planes and will not fill up the k-dimensional space. Thus the sampling will be sub-optimal and even inaccurate. Another problem with these generators arises when the modulus operator is used to generate a random sequence that lies in a certain range. Since the least significant bits of the numbers generated are much less random than their most significant bits, a less than random sequence results [8]. Even if one uses a ‘perfect’ pseudorandom number generator, the sampling error for N points will only decrease as O(N �1/2 ) as opposed to O(N �1 ) for another class of generators (see Section 2). We must thus deal with the problems of high dimensionality, motion models of unknown form, and sub-optimal random number generators, while at the same time attempt to achieve satisfactory performance. For accuracy, the sampling must be fine enough to capture the variations in the state space, while for e�ciency, the sampling must be performed at a relatively small number of points. In mathematical terms, the goal is to reduce the variance of the Monte Carlo estimate. Various techniques (such as importance sampling [2] and stratified sampling [9]) have been proposed to improve the e�ciency of the representation. In importance sampling, auxiliary knowledge is used to sample more densely those areas of the state space that have more information about the posterior probability. Importance sampling depends on already having some approximation to the posterior (possibly from alternate sensors), and is e�ective only to the extent that this approximation is a good one. In stratified sampling, variance reduction is achieved by dividing the state space into sub-regions and filling them with unequal numbers of points proportional to the variances in those subregions. However, this is not practical in spaces of high dimensionality since dividing a space into K segments along each dimension yields K d subregions, too large a number when one has to estimate the variances in each of these subregions.
136
V. Philomin, R. Duraiswami, and L. Davis
A promising extension to Condensation that addresses all the issues discussed above is the incorporation of quasi-Monte Carlo methods [8, 10]. In such methods, the sampling is not done with random points, but rather with a carefully chosen set of quasi-random points that span the sample space so that the points are maximally far away from each other. These points improve the asymptotic complexity of the search (number of points required to achieve a certain sampling error), can be e�ciently generated, and are well spread in multiple dimensions. Our results indicate that significant improvements due to these properties are achieved in our implementation of a novel Condensation algorithm using quasiMonte Carlo methods. Note that quasi-random sampling is complementary to other sampling techniques used in conjunction with the Condensation algorithm, such as importance sampling, partitioned sampling [11], partial importance sampling [7], etc., and can readily be combined with these for better performance. This paper is organized as follows: Section 2 gives a brief introduction to quasi-random sequences and their properties, including a basic estimate of sampling error for quasi-Monte Carlo methods, and establishes their relevance to the Condensation algorithm. We also indicate how such sequences can be generated and used in practice. In Section 3 we describe a modified Condensation algorithm that addresses the issues of an unknown motion model, robustness to outliers, and use of quasi-random points for e�ciency. In Section 4 we apply this algorithm to some test problems and real video sequences, and compare its performance with an algorithm based on pseudo-random sampling. The results demonstrate the lower error rate and robustness of our algorithm for the same number of sampling points. Section 5 concludes the paper.
2 2.1
Quasi-Random Distributions Sampling and Uniformity
Functionals associated with problems in computer vision often have a complex structure in the parameter space, with multiple local extrema. Furthermore, these extrema can lie in regions of involved or convoluted shape in the parameter space. Alternatively, the functionals may have a collapsed structure and have support on a sub-dimensional manifold in the space (perhaps indicating an error in modeling or in the choice of parameters). If the sampling is to be successful in recovering the functional in such cases, the distributions of the sample points and their subdimensional projections must satisfy certain properties. Intuitively, the points must be distributed such that any subvolume in the space should contain points in proportion to its volume (or other appropriate measure). This property must also hold for projections onto a manifold. Quasi-random sequences are a deterministic alternative to random sequences for use in Monte Carlo methods, such as integration and particle simulations of transport processes. The discrepancy of a set of points in a region is related to the notion of uniformity. Let a region with unit volume have N points distributed in it. Then, for uniform point distributions, any subregion with volume � would have �N points in it. The di�erence between this quantity and the actual number
Quasi-Random Sampling for Condensation
1
1
0.9
0.9
0.8
0.8
0.7
0.7
0.6
0.6
0.5
0.5
0.4
0.4
0.3
0.3
0.2
0.2
0.1
0.1
0
0
0.1
0.2
0.3
0.4
0.5
0.6
0.7
0.8
0.9
1
(a) 52 points in (0, )2 generated with Matlab’s pseudo-random number generator.
0
0
0.1
0.2
0.3
0.4
0.5
0.6
0.7
0.8
0.9
137
1
(b) 52 points from the Sobol’ sequence denoted by (+) overlaid on top of (a)
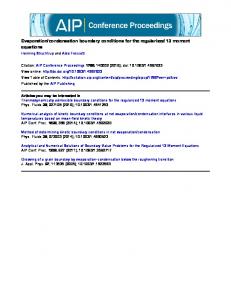
Fig. 1. Distributions of pseudo-random points (a) and quasi random points overlaid (b). Observe the clustering of the pseudo-random points in some regions and the gaps left by them in others. The quasi-random points in (b) leave no such spaces and do not form clusters.
of points in the region is called the “discrepancy.” Quasi-random sequences have low discrepancies and are also called low-discrepancy sequences. The error in uniformity for a sequence of N points in the k-dimensional unit cube is measured by its discrepancy, which is O((log N )k N �1 ) for a quasi-random sequence, as opposed to O((log log N )1/2 N �1/2 ) for a pseudo-random sequence [15]. Figure 1 compares the uniformity of distributions of quasi-random points and pseudo-random points. Figure 1(a) shows a set of random points generated 2 in (0, 1) using a pseudo-random number generator. If the distribution of points were uniform one would expect that any region of area larger than 1/512 would have at least one point in it. As can be seen, however, many regions considerably larger than this are not sampled at all, while points in other portions of the region form rather dense clusters, thus oversampling those regions. Thus from an information gathering perspective the sampling is sub-optimal. Figure 1(b) shows Sobol’ quasi-random points overlaid on the pseudo-random points. These points do not clump together, and fill the spaces left by the pseudo-random points. A good introduction to why quasi-random distributions are useful in Monte Carlo integration is provided by Press et al. [8]. As far as application of the technique to optimization or sampling is concerned, Niederreiter [10] provides a mathematical treatment of this issue. The goal is to sample the space of parameters with su�cient fineness so that we are close enough to every significant maximum or minimum, and can be assured that the approximation to the functional in any given region is bounded, and is well characterized by the number of points chosen for sampling, N . We will motivate and state below the results
138
V. Philomin, R. Duraiswami, and L. Davis
for the quasi-random points. For a more mathematical and formal treatment, consult [10, 17] Given N points, for the sampling to be e�ective, each point should be optimally far from the others in the set so that a truly representative picture of the function being sampled is arrived at. Intuitively, if the points are su�ciently close, the approximation to the underlying functional at any point will be bounded. This can be made precise by the multidimensional analogue of Rolle’s theorem. The value of a function at some point x2 can be approximated by its value at a neighboring point x1 according to f (x + �) = f (x) + uf |� · �,
for some �
such that |�| � |�|
(1)
where x2 = x1 + �. Thus for su�ciently smooth functions, our sampling of the function will be subject to errors on the order of �, where � is characterized by the intersample point distance. The mathematical quantity “dispersion” was introduced by Niederreiter [10] to account for this property of a set of sample points. Given a set of points, the dispersion is defined by the following construction: place balls at each of the sample points with radii su�ciently large to intersect the balls placed at the other points, so that the whole space is covered. We can now define the average dispersion as the average radius of these balls, and the maximal dispersion by the maximum radius. The sampling error is thus characterized by the value of the dispersion of the set of sample points. As shown in [10], low-discrepancy distributions of points have low dispersions, and hence provide lower sampling errors (see Equation (1)) in comparison with point sets with higher discrepancies. 2.2
Generating Quasi-Random Distributions
Now that we have seen that quasi-random distributions are likely to be useful for numerical problems requiring random sampling, the question is whether such distributions exist, and how one constructs them. Several distributions of quasirandom points have been proposed. These include the Halton, Faur´e, Sobol’, and Niederreiter family of sequences. Several of these have been compared as to their discrepancy and their suitability for high-dimensional Monte Carlo calculations [14, 15]. The consensus appears to be that the Sobol’ sequence is good for problems of moderate dimension (k � 7), while the Niederreiter family of sequences seems to do well in problems of somewhat higher dimension. For problems in very large numbers of dimensions (k>100), the properties of these distributions, and strategies for reducing their discrepancies to theoretical levels, are active areas of research [17]. The Sobol’ and the Niederreiter sequences of order 2, which can be generated using bit shifting operations, are the most e�cient. For reasons of brevity, their generation algorithms are not discussed here; the readers are referred to [13, 16]. The complexity of these quasi-random generators is comparable to that of standard pseudo-random number generation schemes, and there is usually no performance penalty for using them.
Quasi-Random Sampling for Condensation
3
139
The Modified Tracking Algorithm
In the standard formulation of the Condensation algorithm [1], the sample posi(n) tions st at time t are obtained from the previous approximation to the posterior (n) (n) (n) {(st�1 , �t�1 )}, �t�1 being the probabilities, using the motion model p(Xt /Xt�1 ) as a predictor. The dynamics is usually represented as a second-order autoregressive process, where each of the dimensions of the state space is modelled by an independent one-dimensional oscillator. The parameters of the oscillators are typically learned from training sequences that are not too hard to track [19, 20, 6, 7]. To learn multi-class dynamics, a discrete state component labelling the class of motion is appended to the continuous state vector xt to form a “mixed” state, and the dynamical parameters of each class and the state transition probabilities are learned from example trajectories. However, for the complicated motions exhibited by pedestrians walking in front of a moving car, it is not easy to identify di�erent classes of motions that make up the actual motion. Moreover, we would like to make no assumptions about how the camera is moving (translation, rotation, etc.) or about the viewing angle. We need a general model that is able to cope with the wide variety of motions exhibited by both the camera and the object being tracked, as well as the shape variability of the object. We propose using a zero-order motion model with large process noise high enough to account for the greatest expected change in shape and motion, since we now have a method of e�ciently sampling high-dimensional spaces using quasi-random sequences. (n) (n) Given the sample set {(st�1 , �t�1 )} at the previous time step, we first choose (i) (i) a base sample st�1 with probability �t�1 . This yields a small number of highly probable locations, say M , the neighborhoods of which we must sample more densely. This has the e�ect of reducing � when the Jacobian term in Equation (1) is locally large, thereby achieving a more consistent distribution of error over the domain (importance sampling). If there were just one region requiring a dense concentration, an invertible mapping from a uniform space to the space of equal importance could be constructed, as given below in Equation (3) for the case of a multi-dimensional Gaussian. Since we have M regions, the importance function cannot be constructed in closed form. One therefore needs an alternative strategy for generating from the quasi-random distribution, a set of points that samples important regions densely. We have devised a simple yet e�ective strategy that achieves these objectives. Let the M locations have centers µ(j) and variances � (j) based on the process noise, where these quantities are k-dimensional vectors. We then overlay M + 1 distributions of quasi-random points over the space, with the first M distributions made Gaussian, centered at µ(j) and with diagonal variance �(j) (3). Finally, we also overlay a (M + 1)th distribution that is spread uniformly over the entire state space. This provides robustness against sudden changes in shape and motion. The total number of points used is N, where N = N1 + N2 + . . . + NM+1 ,
(2)
140
V. Philomin, R. Duraiswami, and L. Davis (n)
the sample size in the Condensation algorithm. We have in e�ect chosen st by (i) sampling from p(Xt /Xt�1 = st�1 ). The conversion from a uniform quasi-random distribution to a Gaussian quasi-random distribution is achieved using the mapping along the lth dimension (j)
yjl = µl +
s (j) �1 2�l erf ((2�l � 1)) ,
(3)
where erf �1 is the inverse of the error function given by ] z 2 2 e�t dt, erf(z) = s � 0 and �l represents the quasi-randomly distributed points in [0, 1]. (n) (n) Finally, we measure and compute the probabilities �t = p(Zt /Xt = st ) for these new sample positions in terms of the image data Zt . We use a measurement density based on the multi-feature distance transform algorithm (see [3] for details) that has been successfully used for detecting pedestrians from static images. Therefore + , M 1 [ 2 d (zi , I) , log p(Zt /Xt ) = log p (Z/X) b � M i=1 typed where the zi ’s are measurement points along the contour, I is the image data, and dtyped (zi , I) denotes the distance between zi and the closest feature of the same type in I. We use oriented edges discretized into eight bins as the features in all our experiments.
4
Results
In order to investigate the e�ectiveness of quasi-random sampling we performed experiments using a simple synthetic example, as well as real video sequences of pedestrians taken from moving cars. Both sets of experiments demonstrated the expected improvements due to the use of quasi-random sampling. We describe these below. 4.1
Synthetic Experiments
We constructed the following simple tracking problem to illustrate the e�ectiveness of using quasi-random sampling as opposed to pseudo-random sampling for the Condensation tracker. The motion of an ellipse of fixed aspect ratio (ratio of axes) �
x � xc (t) a (t)
�
�2 +
y � yc (t) �a(t)
�2 =1
(4)
Quasi-Random Sampling for Condensation
(a) Error in xc , exc p and exc q
141
(b) Error in yc , eyc p and eyc q
Fig. 2. Error distributions vs. frame number. Light - PseudoRandom; Dark - QuasiRandom.
was simulated using a second-order harmonic oscillator model (4) independently in each of the ellipse parameters xc , yc and a. The ellipse translates and scales as a result of the combination of their motions. Reasonable values for the parameters of the oscillators were chosen manually. We ran the tracking algorithm described in Section 3, first with a standard pseudo-random number generator and then with the quasi-random number generator for a given value of N (the Condensation sample size). The tracking algorithm generates estimates for the ellipse parameters at each time step, ˆp (t) in the pseudo-random case and x ˆcq (t), yˆcq (t) namely x ˆcp (t), yˆcp (t) and a and a ˆq (t) in the quasi-random case, from which the errors in the estimates exc p (t), eyc p (t), eap (t) (pseudo-random case) and exc q (t), eyc q (t), eaq (t) (quasirandom case) are obtained. A consistent and reliable value of the error in each dimension was obtained by performing M Monte Carlo trials with each type of generator (for quasi-random, using successive points from a single quasi-random sequence) for each N. All plots shown here are for a sequence of length 500 frames and for 50 trials. Figure 2 shows the errors in the estimates of the center of the ellipse in all the 50 trials. The errors for both type of generators are plotted on top of each other. One can clearly see that the standard pseudo-random number generator leads to higher errors at almost every time step. To get a feel for how the sample size of the tracker a�ects the error rates resulting from the two sampling methods, the mean of the root mean square errors and the standard deviation over the entire sequence are plotted against N on a log-log scale (base 2). Figure 3 shows the plots of the average rmse and standard deviation errors in the estimation of the center coordinates of the ellipse, xc and yc . From these experiments, as well as those described below, it can be seen that quasi-random sequences generally result in lower errors than standard random sequences. Fur-
142
V. Philomin, R. Duraiswami, and L. Davis
High Process Noise
High Process Noise
3.6
8
3.4
7.5
log2(avg. sd error (pixels) in xc)
log2(avg. rmse (pixels) in xc)
3.2 3 pseudo
2.8 2.6 quasi 2.4 2.2 2
7 6.5 pseudo
6 5.5 quasi 5 4.5 4
1.8 1.6 5.5
6
6.5
7
7.5
8
8.5
3.5 5.5
9
6
6.5
7
log2(N)
(a) Avg. RMSE in estimating xc
High Process Noise
8.5
9
High Process Noise 8
3.6
7.5
log2(avg. sd error (pixels) in xc)
3.4 log2(avg. rmse (pixels) in yc)
8
(b) Avg. standard deviation error in xc
3.8
3.2 3
7.5 log2(N)
pseudo
2.8 quasi 2.6 2.4 2.2
7 6.5 pseudo
6 5.5 quasi 5 4.5 4
2 1.8 5.5
6
6.5
7
7.5
8
8.5
log2(N)
(c) Avg. RMSE in estimating yc
9
3.5 5.5
6
6.5
7
7.5
8
8.5
9
log2(N)
(d) Avg. standard deviation error in yc
Fig. 3. Log-log plot of estimation error vs. N (sample size). * - PseudoRandom, + QuasiRandom.
thermore, for low values of N , the errors for quasi-random sampling drop faster as the number of samples is increased, but as N gets very large, a saturation condition is reached, and a further increase in the sample size does not lead to comparable drops in the error rates, although they are still lower than in the pseudo-random case. These graphs thus show that for a given tolerance to error, quasi-random sampling needs a significantly smaller number of sample points (between 1/3 and 1/2 as many), thereby speeding up the execution of the algorithm considerably. Figure 4 shows similar plots for the low process noise case, where the e�ects of using quasi-random sampling are slightly reduced compared to the high process noise case. Finally, Figure 5 (not a log-log plot) shows the behavior of the error rates with increasing process noise for a fixed value of N . As the process noise
Quasi-Random Sampling for Condensation
Low Process Noise
3.5
7
3
6 log2(avg. sd error (pixels) in xc)
log2(avg. rmse (pixels) in xc)
Low Process Noise
2.5
pseudo
2
143
quasi 1.5
1
5 pseudo 4
quasi
3
2
0.5 4.5
5
5.5
6
6.5 7 log2(N)
7.5
8
8.5
1 4.5
9
(a) Avg. RMSE in estimating xc
5
5.5
6
6.5 7 log2(N)
7.5
8
8.5
9
(b) Avg. standard deviation error in xc
Low Process Noise
Low Process Noise 3.5
7 6.5 6 log2(avg. sd error (pixels) in yc)
log2(avg. rmse (pixels) in yc)
3
2.5 pseudo quasi
2
1.5
5.5 5
pseudo
4.5
quasi
4 3.5 3 2.5
1 4.5
5
5.5
6
6.5 7 log2(N)
7.5
8
8.5
(c) Avg. RMSE in estimating yc
9
2 4.5
5
5.5
6
6.5 7 log2(N)
7.5
8
8.5
9
(d) Avg. standard deviation error in yc
Fig. 4. Log-log plot of estimation error vs. N (sample size). * - PseudoRandom, + QuasiRandom.
increases, the superiority of quasi-random sampling becomes clearer and both the rmse and sd errors for pseudo-random sampling increase much more rapidly than their quasi-random counterparts. We have thus seen that using quasi-random sampling as the underlying random sampling technique in particle filters can lead to a significant improvement in the performance of the tracker. Even in a simplistic 3-D state space case such as that presented in this section, there is a sizable di�erence in the error rates. Furthermore, quasi-random sampling is actually more powerful in higher dimensions, as will be qualitatively demonstrated in the following section. We also note that adding noise to the simulations only helps the quasi-random case, since there are more clusters corresponding to multiple hypotheses which need to be populated e�ciently.
144
V. Philomin, R. Duraiswami, and L. Davis
N = 50
N = 50
11
180
10
160
9
140 Avg. sd error in xc
200
Avg. rmse in xc
12
8 7 pseudo 6 quasi
120 100
quasi 60
4
40
3
20
2
2
4
6
8
10 12 Process noise
14
16
0
18
(a) Avg. RMSE in xc vs. process noise
pseudo
80
5
2
4
6
8
14
16
18
(b) Avg. sd error in xc vs. process noise
N = 50
N = 50
14
250
12
200
8
Avg. sd error in yc
10 Avg. rmse in yc
10 12 Process noise
pseudo quasi
6
150
100
pseudo quasi
50
4
2
2
4
6
8
10 12 Process noise
14
16
18
(c) Avg. RMSE in yc vs. process noise
0
2
4
6
8
10 12 Process noise
14
16
18
(d) Avg. sd error in yc vs. process noise
Fig. 5. Estimation error vs. process noise (fixed N). * - PseudoRandom, + - QuasiRandom.
4.2
Tracking pedestrians from a moving vehicle
We now present some results on tracking pedestrians from a moving vehicle using the techniques discussed above. First, a statistical shape model of a pedestrian was built using automatically segmented pedestrian contours from sequences obtained by a stationary camera (so that we can do background subtraction). We use well-established computer vision techniques (see [22] and [23]) to build a LPDM (Linear Point Distribution Model). We fit a NURB (Non-Uniform Rational B-spline) to each extracted contour using least squares curve approximation to points on the contour [21]. The control points of the NURBs are then used as a shape vector and aligned using weighted Procrustes analysis, where the control points are weighted according to their consistency over the entire training
Quasi-Random Sampling for Condensation
(a)
145
(b)
Fig. 6. Tracking failures using standard pseudorandom sampling. Dark - Highest probability state estimate; Light - Mean state estimate. The quasi-random tracker was successful using the same number of samples.
set. The dimensionality is then reduced by using Principal Component Analysis (PCA) to find an eight-dimensional space of deformations. Hence, the total dimension of xt (the state variable) is 12 (4 for the Euclidean similarity parameters and 8 for the deformation parameters). We used N = 2000 samples and the tracker was initialized in the first frame of the sequence using the pedestrian detection algorithm described in [3]. We introduced 10% of random samples at every iteration to account for sudden changes in shape and motion. We applied the tracker to several Daimler-Chrysler pedestrian sequences and found that the quasi-random tracker was able to successfully track the pedestrians over the entire sequence. The tracker was also able to recover very quickly from failures due to sudden changes in shape or motion or to partial occlusion. On the other hand, the pseudo-random tracker was easily distracted by clutter and was unable to recover from some failures. Figure 6 shows some frames where the pseudorandom tracker drifts and fails. For the same sequences with the same sample size, the quasi-random tracker was able to track successfully. Figures 7 and 8 show the tracker output for two pedestrian sequences using the quasi-random tracker. In each frame, both the state estimate with the maximum probability and the mean state estimate are shown.
5
Conclusions
In this paper, we have addressed the problem of using the Condensation tracker for high-dimensional problems by incorporating quasi-Monte Carlo methods into the conventional algorithm. We have also addressed the problem of making the tracker work e�ciently in situations where the motion models are unknown. The superiority of quasi-random sampling was demonstrated using both synthetic
146
V. Philomin, R. Duraiswami, and L. Davis
Frame 4
Frame 9
Frame 2
Frame 7
Frame 2
Frame 26
Fig. 7. Tracking results for Daimler-Chrysler pedestrian sequence using quasi-random sampling. Dark - Highest probability state estimate; Light - Mean state estimate.
Quasi-Random Sampling for Condensation
Frame 4
Frame 9
Frame 25
Frame 33
Frame 38
Frame 49
147
Fig. 8. Tracking results for Daimler-Chrysler pedestrian sequence using quasi-random sampling. Dark - Highest probability state estimate; Light - Mean state estimate.
148
V. Philomin, R. Duraiswami, and L. Davis
and real data. Promising results on pedestrian tracking from a moving vehicle were obtained using these techniques. Monte Carlo techniques are used in other areas of computer vision where there is a need for optimization or sampling. The use of quasi-random points can be readily extended to these areas and should result in improved e�ciency or speed-up of algorithms.
Acknowledgements The partial support of ONR grant N00014-95-1-0521 is gratefully acknowledged. The authors would also like to thank Azriel Rosenfeld, Dariu Gavrila, Michael Isard, Jens Rittscher and Fernando Le Torre for their useful suggestions and comments.
References . M. Isard and A. Blake. Contour tracking by stochastic propagation of conditional density. Proc. European Conf. on Computer Vision, pages 343-356, 996. 2. M. Isard and A. Blake. ICONDENSATION: Unifying low-level and high-level tracking in a stochastic framework. Proc. European Conf. on Computer Vision, vol. , pp. 893-908, 998. 3. D. Gavrila and V. Philomin. Real-time object detection for “smart” vehicles. Proc. IEEE International Conf. on Computer Vision, vol. , pp. 87-93, 999. 4. D. Gavrila and V. Philomin. Real-time object detection using distance transforms. Proc. Intelligent Vehicles Conf., 998. 5. M. Oren, C. Papageorgiou, P. Sinha, E. Osuna, and T. Poggio. Pedestrian detection using wavelet templates. Proc. IEEE International Conf. on Computer Vision, pp. 93-99, 997. 6. A. Blake, B. North and M. Isard. Learning multi-class dynamics. Advances in Neural Information Processing Systems 11, in press. 7. J. Rittscher and A. Blake. Classification of human body motion. Proc. IEEE International Conf. on Computer Vision, pp. 634-639, 999. 8. W. H. Press, S. A. Teukolsky, W. T. Vetterling and B. P. Flannery. Numerical Recipes: The Art of Scientific Computing. 2nd Edition, Cambridge University Press, Cambridge, UK. 9. J. Carpenter, P. Cligord and P. Fearnhead. An improved particle filter for nonlinear problems. IEE Proc. Radar, Sonar and Navigation 146, pp. 2-7, 999. 0. H. Niederreiter. Random Number Generation and Quasi-Monte Carlo Methods. SIAM, Philadelphia, PA, 992. . J. MacCormick and A. Blake. A probabilistic exclusion principle for tracking multiple objects. Proc. IEEE International Conf. on Computer Vision, vol. , pp. 572-578, 999. 2. B. L. Fox. Algorithm 647: Implementation and relative e�ciency of quasirandom sequence generators. ACM Transactions on Mathematical Software 12, pp. 362376, 986. 3. P. Bratley and B. L. Fox. Algorithm 659: Implementing Sobol’s quasirandom sequence generator. ACM Transactions on Mathematical Software 14, pp. 88-00, 988.
Quasi-Random Sampling for Condensation
149
4. P. Bratley, B. L. Fox, and H. Niederreiter. Implementation and tests of lowdiscrepancy sequences. ACM Transactions on Modeling and Computer Simulation 2, pp. 95-23, 992. 5. W. J. Morokog and R. E. Caflisch. Quasi-random sequences and their discrepancies. SIAM J. Sci. Comput. 15, pp. 25-279, 994. 6. P. Bratley, B. L. Fox, and H. Niederreiter. Algorithm 738: Programs to generate Niederreiter’s low-discrepancy sequences. ACM Transactions on Mathematical Software 20, pp. 494-495, 994. 7. B. Moskowitz and R. E. Caflisch. Smoothness and dimension reduction in quasiMonte Carlo methods. Math. Comput. Modelling 23, pp. 37-54, 996. 8. M. J. Black and A. D. Jepson. Recognizing temporal trajectories using the Condensation algorithm. Proc. IEEE International Conf. on Automatic Face and Gesture Recognition, 998. 9. D. Reynard, A. Wildenberg, A. Blake and J. Merchant. Learning dynamics of complex motions from image sequences. Proc. European Conf. on Computer Vision, pp. 357-368, 996. 20. B. North and A. Blake. Learning dynamical models using ExpectationMaximisation. Proc. IEEE International Conf. on Computer Vision, pp. 384-389, 998. 2. L. Piegl and W. Tiller. The NURBS Book. Springer-Verlag, 995. 22. T. F. Cootes, C. J. Taylor, A. Lanitis, D. H. Cooper, and J. Graham. Building and using flexible models incorporating grey-level information. Proc. IEEE International Conf. on Computer Vision, pp. 242-246, 993. 23. A. Baumberg and D. C. Hogg. Learning flexible models from image sequences. Proc. European Conf. on Computer Vision, 994.