Query-Based Summarization Based on Document Graphs. Ahmed A. Mohamed, Sanguthevar Rajasekaran. Department of Computer Science & Engineering.
Query-Based Summarization Based on Document Graphs Ahmed A. Mohamed, Sanguthevar Rajasekaran Department of Computer Science & Engineering University of Connecticut Storrs, CT 06268 {amohamed, rajasek}@engr.uconn.edu Abstract - Text summarization is an important problem, which has numerous applications. This problem has been extensively studied and many approaches have been proposed in the literature for its solution. One of the most challenging problems in the field of text summarization is generating a user-focused summary based on a query. In this paper, we investigate a new approach that tackles this problem and propose a new solution using document graphs. This is our first time to participate in Document Understanding Conferences.
sentence is parsed using Link Parser [6], and the noun phrases (NP) are then extracted from the parsing results. The relations are generated based on four heuristic rules:
Keywords - text summarization, query-based summarization, and document graphs.
1
The NP-heuristic helps to set up the hierarchical relations. For example, from a noun phrase “folk hero stature”, we generate relations “folk hero stature isa stature”, “folk hero stature related_to folk hero”, and “folk hero isa hero”.
•
The NP-PP-heuristic attaches all prepositional phrases to adjacent noun phrases. For example, from “workers at a coal mine”, we generate a relation, “worker related_to coal mine”.
•
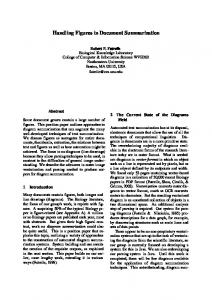
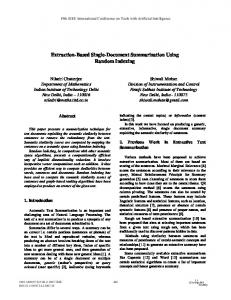
The sentence-heuristic relates concepts/entities contained in one sentence. The relations created by sentence-heuristic are then sensitive to verbs, since the interval between two noun phrases usually contains a verb. For example, from a sentence “Workers at a coal mine went on strike”, we generate a relation “worker related_to strike”. Another example, from “The usual cause of heart attacks is a blockage of the coronary arteries”, we generate “heart attack cause related_to coronary artery”. Fig. 1. shows an example of a partial DG [5]. The NP-VP-NP-heuristic generates isa relations from two NPs connected by to be verb. For example, from "John is a student", we generate "John isa student" [3].
INTRODUCTION
One of the most challenging problems in text summarization is to provide an informative summary based on a question given by the user. We participated in the DUC-2006 task for the first time. The goal of the task for this year was to model real-world complex question answering, in which a question cannot be answered by simply stating a name, date, quantity, etc. The dataset contains 50 document sets where each set contains 25 relevant documents and a topic statement. The task requirement is to compose a fluent, wellorganized summary such that the target length does not exceed 250-words and that the summary of the documents should answer the questions in the topic statement. In the following subsections, we will describe our query-based summarization approach. 2
•
•
REPRESENTING CONTENT BY DOCUMENT GRAPHS
In our approach, each document is represented as a document graph (DG) which is a directed graph of concepts/entities and the relations among them. A DG contains two kinds of nodes, concept/entity nodes and relation nodes. Currently, only two kinds of relations, “isa” and “related_to”, are captured [4] for simplicity. To generate a DG, a document/summary in plain text format is first tokenized into sentences; and then, each
3
BRIEF DESCRIPTION OF DGS SUMMARIZER
In this section, we give a brief description of the DGS summarizer which will be modified in 4.2 to suit our approach. In [3], a centric graph is generated from all source documents to guide the summarizer in its search for candidate sentences to be added to the output summary. A centric graph, as defined by [3], is a graph which is
highly bushy, i.e. has the highest number of bushy nodes. A bushy node is a concept/entity node and is connected to many other nodes. The hypothesis is that bushy nodes are the most important nodes in the graph and form the basis of a quality summary. Since bushy nodes are highly connected by/to other nodes, this indicates that they contain the core concepts/entities about which the document is focusing.
avg − stddev ≤ Scorei ≤ avg + stddev; general avg + stddev ≤ Scorei ; medium avg + 2 * stddev ≤ Scorei ; high
(2)
Where avg, stddev and Scorei are the average score, standard deviation of all scores and the Score of relation i respectively. After generating the centric graph, we collect all sentences that are highly related to the centric graph. We hypothesize that sentences with high correlation to the centric graph are important sentences and should be included in the final summary. We measure the similarity between each sentence’s graph and the centric graph, and then only those with the highest similarity values are collected to form the final summary. 4 4.1
OVERVIEW OF OUR SYSTEM
Query-based Summarization
Fig. 1. A partial DG
Each relation in the graph has two sides, left and right sides, separated by the relation type (related_to or isa). To generate the centric graph, the weight of every relation has to be calculated in all the sources’ graphs according to the formula: K
∑ ConFreq Weight Ri =
j
j =1
(1)
NumberOfConceptsRi
Which is modified from [3], and Ri, ConFreqj and NumberOfConceptsRi are relation number i, number of occurrences of Conceptj from Ri in the document and total number of concepts in relation Ri, respectively. After calculating the weights of all relations in all documents, we build a centric graph from each document and merge them all together to form a global centric graph which is going to be used in the summary generation step. Three types of centric graphs are being generated: general, medium and high focus centric graphs. To compose a centric graph, we select from each source’s graph those relations that have scores in the following ranges:
Text summarization systems usually provide the user with a generic summary that highlights the most salient information in a text. A Question-Answering (QA) system, however, tries to find an exact answer to the user’s query and generate a suitable response to the query [1]. In our system we are using three different techniques to generate a query-based summarization and present the best summary, according to a modified version of the evaluation measure described in [5], to the user. 4.2
First Approach
In our first approach, we used the document graph summarizer as described in section 3 but with a little modification. The modification is done on the centric graph generation algorithm such that every time we add a relation to the centric graph it must belong to one of the three centric graph models described in the DGS algorithm or contains at least one concept/entity that exists in the query (topic). By following this approach we are trying to include all the relations that are pertinent to the query (topic) so that the resulting summary will contain as much relevant information to the query (topic) as possible. We call this summarizer the modified DGS-summarizer
4.3 Second Approach The algorithm of our second approach can be described as follows: 1. Generate a DG for each sentence in the input documents, 2. Generate a DG for the query (topic), 3. Measure the similarity between each sentence and the query (topic), 4. Finally, we form the summary by collecting and adding the best sentences from the input documents, according to their qualities calculated in the previous step. After collecting the best sentences we sort them chronologically according to their appearance in the input documents. We will refer to our new query summarizer as the Qsummarizer 4.4
Third Approach
In our final attempt we are using a query modification technique to add extra information to the query. The algorithm of this approach is as follows: 1. Generate a DG for each sentence in the input documents, 2. Generate a DG for the query (topic), 3. Measure the similarity between each sentence and the query (topic), 4. Search for and add the best sentence to the summary, 5. If the summary’s length restriction is met or there are no more sentences to add then finish and report the target summary; otherwise add the DG for the chosen sentence to the query graph, 6. Repeat from step 3 until no more sentences can be added to the summary. In this approach, every time we add a sentence to the target summary, we extend the query graph by adding the sentence’s DG to it. We called this new summarizer the QInc-summarizer. The “Inc” stands for increment, since in this approach we increment the query graph every time we add a sentence to the summary. 4.5
Evaluation Measure
We used a modified version of the evaluation measure described in [5] to measure the quality of our summaries prior to submitting the best of them to the user. The modified measure is computed from the following formula:
2× P× R ( P + R) P = Sim( Summ, Query) F ( Summ) =
(3)
R = Sim(Query, Summ) Where Summ and Query are the document graph representation of the summary and the query associated with the document cluster being summarized, respectively and the similarity between two document graphs is computed using the following formula [5]:
Sim ( DG1 , DG 2 ) =
n m + 2 N 2M
(4)
Where N, M, n, m are number of concept/entity nodes in DG1, number of relations in DG1, number of matched concept/entity nodes and number of matched relations, respectively. 5
EXPERIMENTAL DESIGN
To calculate the quality of our summaries produced by our summarizers, we measured their similarity values to the query (topic) using the evaluation measure described in 4.5. Then, we present the best summary of the three approaches to the user. 6
EVALUATION RESULTS
According to the modified evaluation measure we used, the results from Table 1 shows that the Qsummarizer has produced 37 better summaries than the modified DGS and the QInc summarizers. The QInc summarizer has produced 12 better summaries than the modified DGS and the Q summarizers. The modified DGS summarizer has produced only one summary better than the QInc and the Q summarizers.
Table 1. Number of best summaries produced by the modified DGS, QInc and the Q summarizers
Modified DGS
QInc
Q
# of best summaries
1
12
37
Avg. Quality
0.030
0.068 0.084
NIST evaluation results shown in Table 2 show the ranking results of our summaries according to the quality questions, average content coverage and the overall responsiveness of the system, respectively. The quality questions were used to evaluate grammaticality, non-redundancy, referential clarity, focus and structure and coherence, respectively.
Quality Questions
Table 2: NIST evaluation results of our system
Quality Level Rank (out of 5) (out of 35) 3.64 16 4.12 22 2.88 25 3.46 25 2.12 26
Q1 Q2 Q3 Q4 Q5 Overall
3.24
22
Avg. Content Avg. Overall
2.3 1.98
31 29
ROUGE [2] evaluation results shown in Table 3 show the ranking results of our summaries according to the recall, precision and F-measure for ROUGE-1, ROUGE-2, ROUGE-3, ROUGE-4, ROUGE-L, ROUGE-SU4 and ROUGE-W-1.2, respectively. Table 3: ROUGE evaluation results of our system
ROUGE type ROUGE-1 ROUGE-2 ROUGE-3 ROUGE-4 ROUGE-L ROUGE-SU4 ROUGE-W-1.2 7
R 25 24 26 24 24 25 24
Rank P 32 28 27 27 30 30 31
F 27 27 26 27 27 28 27
experiments, the results reported by the Q and the QInc summarizers have mistakenly flipped. This means that we mistakenly, and instead of submitting our best summaries, submitted our worst summaries. We are not satisfied with the results reported and believe that our summarizer could have been ranked higher if that mistake has been discovered earlier and before submitting the results to NIST for evaluation. We are planning on improving our summarizer to provide better quality summaries and hope to participate in future DUC conferences. 8
In this paper we presented new approaches for querybased text summarization based on document graphs. Document graphs have been used before in automatic evaluation of summaries and proved successful. We used three approaches to summarize the documents provided for DUC-2006 task. Our goal was to submit the best summaries generated by the three approaches to NIST for evaluation. Unfortunately, and due to an unintended mistake, we submitted our worst summaries to DUC, which (as we believe) has affected our system’s overall quality dramatically. Despite this unfortunate mistake, we were pleased by participating in DUC-2006 which was a good opportunity for us to evaluate our system’s quality and we are planning on improving our system’s performance and hope to participate in future DUC conferences. ACKNOWLEDGMENT SR has been supported in part by the NSF Grant ITR:0326155. REFERENCES [1]
[2]
ANALYSIS
The results show that our system did not perform well compared to other summarization systems, which was disappointing to us. Unfortunately, during our
CONCLUSIONS
[3]
L. Hirschman and R. Gaizauskas, "Natural language question answering: The view from here," Natural Language Engineering, vol. 7, pp. 275–300, 2001. C.-Y. Lin, "ROUGE: A Package for Automatic Evaluation of Summaries," presented at Workshop on Text Summarization Branches Out, Document Understanding Conference, Barcelona, Spain, pp., 2004. A. A. Mohamed, "Generating User-Focused, Content-Based Summaries for MultiDocuments Using Document Graphs,"
[4]
[5]
[6]
presented at The 5th IEEE Symposium on Signal Processing and Information Technology (ISSPIT), pp. 675- 679, 2005. E. J. Santos, H. Nguyen, and S. M. Brown, "Kavanah: An Active User Interface information Retrieval Agent Technology," in Maebashi. Japan, 2001. E. J. Santos, A. A. Mohamed, and Q. Zhao, "Automatic Evaluation of Summaries Using Document Graphs," presented at Text Summarization Branches Out: Proceedings of the ACL-04 Workshop, Barcelona, Spain, pp. 66-73, 2004. D. Sleator and D. Temperley, "Parsing English with a link grammar," presented at The Third International Workshop on Parsing Technologies, pp. 277-292, 1993.