Query-log mining for detecting spam Claudio Corsi† Debora Donato‡ Carlos Castillo‡
[email protected] [email protected] [email protected] Paolo Ferragina† Aristides Gionis‡
[email protected] [email protected] ‡
Yahoo! Research Labs Barcelona, Spain
ABSTRACT Every day millions of users search for information on the web via search engines, and provide implicit feedback to the results shown for their queries by clicking or not onto them. This feedback is encoded in the form of a query log that consists of a sequence of search actions, one per user query, each describing the following information: (i) terms composing a query, (ii) documents returned by the search engine, (iii) documents that have been clicked, (iv) the rank of those documents in the list of results, (v) date and time of the search action/click, (vi) an anonymous identifier for each session, and more. In this work, we investigate the idea of characterizing the documents and the queries belonging to a given query log with the goal of improving algorithms for detecting spam, both at the document level and at the query level.
1. INTRODUCTION We start from the classic definition of click graph [1, 4], and we introduce two novel graph definitions: the view graph and the anticlick graph. We study the use of these graphs for characterizing the spammicity of queries and documents, and propose two novel syntactic and semantic features to be used for web-spam detection by means of a standard classifier. The syntactic features are defined for the document nodes of such graphs, and aim at capturing the query attractiveness of a document based on the distinctness of the queries adjacent to it in those graphs. The semantic features are defined on all nodes of the graphs (documents and queries), and are based on a novel concept of entropy defined on the distribution of inferred categories for the topics of that node. In order to get topical data, we follow [1, 9, 12, 16] and start from the labeling information available for a small set of topicallycategorized pages in the considered graphs derived from the Open Directory Project (DMOZ). Next we propagate those category labels in the graph in order to obtain labels for queries and for previously unlabeled documents, together with their strength of association. Through this propagation algorithm, queries and documents do not obtain a single category label but a probability distribution over all possible labels. This distribution can be used to
Permission to make digital or hard copies of all or part of this work for personal or classroom use is granted without fee provided that copies are not made or distributed for profit or commercial advantage and that copies bear this notice and the full citation on the first page. To copy otherwise, to republish, to post on servers or to redistribute to lists, requires prior specific permission and/or a fee. AIRWeb ’08, April 22, 2008 Beijing, China. Copyright 2008 ACM 978-1-60558-159-0 ...$5.00.
†
Dipartimento di Informatica University of Pisa, Italy provide measures regarding whether queries and documents are multi-topical or not, and thus be used as indicators of query attractiveness, and thus potential spammed documents or queries. The idea to propagate labels through a graph structure is not new [11, 16, 4, 13], but unlike previous research, we propose to use the category propagation as an intermediate step towards the computation of new features which can improve current machine learning methods for spam detection [3, 6, 7, 15, 5]. We deploy the syntactic and semantic features in two applications: Web spam detection. Our intuition is that spammers have an incentive to aim at the top results of frequent queries, and to aim at queries that are semantically far apart from each other in order to cover the largest web audience. So, instead of concentrating on adapting to specific techniques that spammers use to create their sites, we concentrate on the eventual outcome of their techniques by detecting specific structural and content patterns in the query log graphs. Query spam detection. We are interested in detecting all those queries that generate a high number of spam pages placed in the first top-N positions of their answer lists. Detection of such queries can be used for improving quality of search results by, say, applying a more aggressive spam threshold on pages shown for spamattracting queries, or by using those queries to design more sophisticated spam-detection algorithms.
2.
PRELIMINARIES AND NOTATION
The click graph C = (VQ , VD , E) is an undirected, weighted and labeled bipartite graph, consisting of a node set VQ ∪ VD and an edge set E. Nodes in VQ denote the set of distinct queries occurring in a query log, nodes in VD denote a set of distinct documents, and an edge (q, d) ∈ E denotes the fact that the query q ∈ VQ has led some user to click on the document d ∈ VD . Edge (q, d) ∈ E has associated a weight w(q, d), which denotes the strength of the relation between q and d. We will consider two weights: (i) the number of times query q led a user to click on document d; (ii) the number of distinct search-sessions in which q clicked on d. We also use Nk (x) to denote the set of nodes in G that lie at distance exactly k from node x, and use N≤k (x) = ∪i=1,...,k Ni (x) to indicate the set of nodes in G that lie at distance at most k from node x. Starting from the click-graph we define two alternative graphs: View graph. We replace the edge set E of the click graph with the one containing edges (q, d) where q is the issued query and d is the document whose URL has been viewed in the answer list returned to the user, but has been not necessarily clicked by that user. The view graph is a generalization of the click graph since each click is also a view. Moreover a query could produce no click and so be not present in the click graph, but be present in the view graph.
We notice that the view graph is more noisy than the click graph because it does not contain any user feedback. Nonetheless it can be still useful to detect spam sites, since spam sites try to be in the answer lists of different queries, while users do not necessarily click on those spam sites. Anticlick graph. We define the anti-click graph Ar , containing an edge (q, d) whenever (i) the document d appeared in the topr positions of the ranked list of results for the query q, (ii) the user who submitted q did not click on d, but (iii) the user clicked on another document ranked below d. This type of negative feedback was shown to be useful by [10]. The anti-click graph intends to capture the negative judgment that users give implicitly to the r-top ranked documents when ignoring them by clicking on documents ranked below. It is reasonable to consider small values for r as we do in our experiments, for which we set r = 3. The above graphs (click, view and anti-click) can be defined on hosts by replacing the set of document nodes with their hosts. We notice that, although it is very common to see spam pages on a good host (e.g. forum or guestbook is defaced, or a host have been hacked), our experiments of section 4 shows that our approach on host-graphs is robust and improves known results. In the rest of this paper we will refer to these graphs as, in order: Cd and Ch , Vd and Vh , Ad and Ah . When there is no need to distinguish among those graphs we will use the generic name G. Additionally, for every node x ∈ VQ ∪ VD ∪ VH , we associate a string `(x) describing the node: if x ∈ VQ , `(x) is the query string, otherwise x ∈ VD or x ∈ VH then `(x) is the document URL/host string.
3. QUERY GRAPH MEASUREMENTS Driven by our applications on spam query/document detection, we define features on our graphs that will then be used for building machine-learning models.
3.1 Syntactic features The most obvious feature is simply the degree of a node. For a document d, |N1 (d)| is the number of queries adjacent to d. This set provides a “good description” of the content of document d [17, 8]. Similarly, for each query q we consider |N1 (q)|, the number of distinct documents clicked for q. Next we want to refine this feature and concentrate on popular elements based on frequencies: • For each document d, we define topQx (d) as the set of queries adjacent to d in G and being among the fraction x of the most frequent queries in the query log. We consider x = 0.01, 1.0, where topQ1.0 (d) = N1 (d), and select as a feature the cardinality |topQx (u)|. We notice that x = 0.01 gives good results, and similar values of x give similar sets. • For each document d, we define topTy (d) as the set of query terms (except stop words) which compose the queries adjacent to d in G and being among the fraction y of the most frequent terms in the query log. We consider y = 0.01, 1.0, where topT1.0 (u) is the dictionary of all query terms (except stop words). Again, we select as a feature the cardinality |topTy (d)|. Note that topTy (u) is less precise than topQx (u) but it relaxes the dependence on small variations in the query composition. The intuition underlying the selection of the above two features is that the larger their values are, the stronger and wider the query attractiveness of d should be and thus the more evident should be that d is a spam page. Clearly, this may induce false positive detection for good pages dealing with several topics (e.g. a multi-author blog). However, those pages can be easily detected as non-spam by using classic link- and/or content-based approaches (see section 4).
3.2 Semantic features The values of the syntactic features for a document d are not robust estimators of the semantic coverage of that document which, in turn, could be a useful measure in order to make the detection of spam hosts more effective. For instance, cloaked hosts are returned to possibly much different queries (in their semantic). Of course this property can’t be taken as a discriminant in order to mark a site as spam, but it represent a good feature to consider in deploying an automatic classifier (see section 4). We then propose new measures of semantic coverage of a node (document or query), based on a novel use of our graphs and of Web directories, such as the Open Directory DMOZ1 . Our approach consists of two main phases: (i) we first categorize the subset of documents in VD that can be found in DMOZ, (ii) then, in order to amplify the DMOZ coverage, we propagate the categories assigned to the (few) documents/hosts nodes of G to other document/host nodes and query nodes by exploiting the structure and edge weights of the graph G. At the end, many categories will be possibly associated with a node of G, denoting the fact that this node is polysemous, in case of a query node, or multi-topical, in case of a document/host node. Furthermore, each category will have associated an assignment strength denoting the relation between the node content and the category label. This propagation process is based on [16] and has been implemented in two ways which are detailed in the next section. Finally, we will deploy this multi- and weighted-category assignment to derive three dispersion measures which will be able to catch the semantic spread of every (document or query) node in G.
3.2.1
The Category Tree and its computation
Let TL be the category tree underlying the DMOZ directory, pruned to its top L levels. In our experiments we consider L = 2, thus managing 577 categories. We assume that every category (node) c of TL is associated with a string `(c), which denotes the name of the category. Our goal is to associate one category tree TL (v) with each vertex v of the graph G (either query or document node), in such a way that each score scorev (c) attached to the (node) category c denotes the strength of the relation between v’s content and c’s topic. We observe that TL (v) offers a good description of the semantic coverage of the node v. We then assert that the “wider” is the distribution of positive scores among the nodes of this tree, the wider should be the semantic spread of vertex v (being v either a query or a document). In order to compute these trees, we associate an initial tree TL (v) to each node v in G, with all the scores set to zero. Then, we scan through the document-nodes d of G and check whether d is assigned to some category c of DMOZ. If so, we increment by 1 the score of c and of all its ancestors in TL (d). Note that, if c occurs deeper than level L in DMOZ, then we take its ancestor at level L, and perform the above updates on this node (and P its ancestors). We normalize all the scores in such a way that c0 ∈child(c) scorev (c0 ) = 1. Doing this we can look at scorev (c) as the probability that (document/query) node v is about sub-topic c0 , conditioned to the fact that it is about c. Given the score values scorev (c), we also define score0v (c) = score0v (π(c))×scorev (c), where π(c) is the parent of c in TL . In particular, for the category node r at the root of TL (v), we define score0v (r) = 1 because we assume that category r includes all possible topics. In some sense score0v (c) captures the probability of reaching a category-node c of TL , when one starts on the root of TL and moves downwards according to the scores scorev (c). 1
http://www.dmoz.org/
After the initialization step, few category trees are non-null because DMOZ covers a small portion of the Web (see Table 1). Then we apply a category propagation processes whose goal is to spread the category scores to other query and document nodes, driven by the structure of G and boosted by its edge weights. We propose two propagation strategies. Tree-based propagation by weighted average. The first propagation algorithm views the graph G as a network of voters. Their contributions may sum up over multiple paths, but also decay with the lengths of those paths. In order to take into account these issues, we propagate the category scores through the graph G by means of the following process. At the generic step i = 0, . . . , t, we scan through the nodes v in G and update the scores of all categories c in TL (v) as follows: X i−1 scorei+1 scoreiv0 (c) × f (v 0 , v) v (c) += α (v 0 ,v)∈E
where score0v (c) = scorev (c), to log2 (1 + w(v 0 , v)), and α is a
f is a increasing function set damping factor that takes into account the fact that the relatedness between two nodes at distance t in G decays with t. In our experiments α has been set to 0.85, as is usual in the PageRank algorithm, and t = 2, which means that we propagate forth and back the category trees starting from the document nodes of G having the category trees defined directly from DMOZ. Moreover we normalize the scores of each category tree at each propagation step in order to guarantee P 0 c0 ∈child(c) scorev (c ) = 1. Propagation by random walk. Our second propagation algorithm flattens the category structure, by considering only the 17 top-level categories in DMOZ. For a fixed category c, the randomwalk approach models the behavior of a random surfer that walks through the click-graph G and swaps her interests from queries to documents, and reverse. The way the surfer chooses the next node among the ones adjacent to the current one (being either a document or a query) depends on their popularity among the search-engine users: The transition probability over edge (v, v 0 ) is P proportional to w(v, v 0 )/ z w(v, z) [4], where the weight w(·) can be defined either in terms of number of clicks or on the number of distinct search-sessions (we use the first one). The surfer has no memory of her previous location and sometimes she may restart (or “teleport” herself) to a document belonging to category c, chosen among all those documents with probability proportional to score0v (c). This way we take into account the relatedness of v’s content with c’s topic. Notice that the restart of the random walk reaches only document nodes and that, by using the scores score0v (c) instead of scorev (c), we uncondition on the structure of the categories in the hierarchy tree. By repeating this calculation for all categories of DMOZ in the 17 top-level categories, we get the category trees for all nodes in G as probability distribution p[v] over all the considered categories. In particular we consider the normalized version of such vectors: p[v]/||p[v]||1 .
3.2.2 Measures of dispersion We propose three dispersion measures able to catch the semantic spread of a node by exploiting its category tree. We fix a level i in TL (v) and consider the conditional entropy X X Hi (v) = − p(c) p(c0 |c) log2 p(c0 |c), c0 ∈child(c) level(c)=i−1 where c ranges among the level-(i − 1) nodes of DMOZ, and p(c0 |c) = P
scoreu (c0 ) x∈child(c) scoreu (x)
Table 1: Statistics on the query graphs.
Queries Docs/hosts Edges CD (0) CQ (1) CD (2) CCmax |CC|
Document-level Cd Ad Vd 1.59M 0.75M 2.78M 2.75M 1.31M 23.47M 3.69M 1.67M 40.71M 0.05 0.08 0.03 0.18 0.24 0.39 0.22 0.22 0.45 0.32 0.19 0.92 0.21 0.23 0.007
Ch 1.59M 0.83M 3.50M 0.28 0.58 0.70 0.80 0.08
Host-level Ah 0.75M 0.40M 1.53M 0.35 0.75 0.75 0.83 0.06
Vh 2.78M 3.08M 3.45M 0.15 0.92 0.94 0.98 0.006
is the probability to reach node x given that we are at its parent node c. Therefore, Hi (v) measures the uncertainty of selecting a category at level i given that we are at some category at level (i − 1). Having fixed the maximum depth of the trees to L = 2, we define a first measure of dispersion as follows: H(v) = βH1 (v) + (1 − β)H2 (v). In this case, if β = 0 then the distribution among the level-2 categories dominates; if β = 1 then the distribution among the level-1 categories dominates; finally, if β = 0.5 then H(v) is the half of the joint entropy of the first two levels of TL (v). Therefore by setting β = 0.75 we give a preference to the distribution in the level-1 categories. In a similar way we define the second measure for the semantic coverage of a node in the graph, called the joint entropy (HJ). Considering the nodes c on level 2 of TL (v), we compute their joint probability as p(c) = p(c|parent(c))p(parent(c)). We then apply the standard entropy function over the resulting probability distribution obtaining HJ. As last semantic feature we compute the classic notion of entropy over the vectors p[v] computed in the propagation based on random walk, where we considered just the 17 top-level categories of DMOZ. We denote such measure as Hp .
4.
APPLICATION TO WEB SPAM
The dataset we used contains queries submitted to the Yahoo! UK search engine2 . We picked a sample of about 1.6 million queries leading to clicks on about 2.8 million distinct documents. We also parsed the DMOZ hierarchy, as of October 2007, which contained about 4.2 million distinct documents in about 600 thousand distinct categories. In Table 1, the number of query nodes, document (or host) nodes, and edges is given for all six graphs extracted from the query log. In the table, CD (k) is the fraction of documents (or hosts) covered by DMOZ after the k-th propagation step; CQ (k) is the fraction of queries covered by DMOZ after the k-th propagation step; CCmax is the size of the largest connected component, and |CC| is the number of connected components, both given as a fraction of all the nodes in the graph. Starting from this dataset we generate the graphs Cd , Vd and Ad together with their host-based version (Ch , Vh and Ah ). Over them we generate all the syntactic and semantic features as described in sections 3.1 and 3.2. We include also some statistical information about our graphs, as the number of clicks, views, and anti-clicks per query and document. We computed these statistics in two versions: discarding multiple clicks/views/anti-clicks in the same session for the same query/document pair, or counting them. In total, we have 61 features for each node. Finding Web spam pages. For building and testing our automatic classifier, we use the hosts occurring in the click-graph Ch and in the WEBSPAM-UK2006 dataset [2] which comes with a set of 2
http://search.yahoo.co.uk/
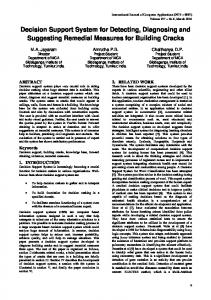
Figure 1: Distribution of entropy Hp for (non)spam nodes. 0.06 Non−spam Spam
Frequency
0.05 0.04 0.03 0.02
5.
0.01 0 0
0.5
1
1.5
2
2.5
3
Entropy
Table 2: Results for Web spam classifiers. Feature set Features TP FP F1 Content (C) 98 75.8% 9.8% 0.692 Links (L) 139 84.2% 9.5% 0.739 Usage (U) 61 54.2% 7.4% 0.557 C∪L 237 83.9% 8.6% 0.756 C∪U 159 68.4% 6.6% 0.693 L∪U 200 78.5% 6.5% 0.757 C∪L∪U 298 78.9% 6.2% 0.765
AUC 0.912 0.939 0.872 0.952 0.917 0.951 0.951
pre-computed content-based and link-based features3 . Some of our usage-based features are very good at separating spam and normal hosts, as is indicated in Figure 1 where the distributions of Hp in Ch for spam hosts (lines) and normal hosts (bars) are clearly different. We then used a cost-sensitive decision tree with bagging (for an introduction on these techniques see [14]) and adopted the following performance measures: the true positive rate T P (or recall), the false positive rate F P , the F1 metric, which combines R , and the area under the precision P and recall R by F1 = 2 PP+R ROC curve (AUC), which is the area under the plot of the true positive rate against the false positive rate. We compare the performance of our 61 usage-based features against the 98 link-based and the 139 content-based features provided with the dataset. Table 2 reports the experimental results, in terms of F1 and AUC. We notice that, in term of global accuracy, the classifiers (C ∪ L ∪ U), (C ∪ L) and (L ∪ U) are comparable. Nonetheless our (L ∪ U)-classifier has less features than the (C ∪ L)-classifier introduced in [3] and, remarkably, it does not need to look at the content of the pages. Finding queries that attract spam. We refer to a spam-attracting query as one that has a high number of spam hosts in its result set. We take the WEBSPAM-UK2006 dataset to obtain spam and normal labels for a subset of the hosts in Vh , the view-graph at the host level. All hosts that do not get a label are dropped. Next we define the spamicity of a query as the number of results labeled as spam and shown to the user for that query, over the total number of results labeled (spam or normal) and shown to the user. For instance, a spamicity of 0.5 for a query q indicates that from the labeled hosts present in the result set of q, half of them were spam. To reduce the noise given by the low coverage of our labels, we consider only the set of queries for which we have at least 10 labeled hosts in the results shown to the user. Next we divide the queries into two groups: queries having spamicity ≥ 0.5 and queries having spammicity < 0.5. Using a decision tree for this task we obtain an AUC of 0.798, true positive rate of 73.7% with 29.0% of false positives. If instead we consider the task of find3
ing queries with spamicity=0 versus queries with spamicity≥ 0.5, we can obtain an AUC of 0.838 with a true positive rate of 74.0% and false positive rate of 22.1%. These results suggest that usage data can be used to automatically extract queries that are likely to be showing a substantial amount of spam results; however, probably other features are required to improve the accuracy of such a detection system.
http://webspam.lip6.fr/
CONCLUSIONS
Our experiments on spam detection have shown interesting performance, which sometimes improved known results, as we can achieve the same performance as known classifiers with much less features and considering usage information. We think that detecting spam-attracting queries is particularly interesting because we might argue for two-lines of defense against Web spam: the classic automatic classifier built over the collection at indexing time (and used by all large-scale search engines), and the spam detection based on observing usage patterns in the search engine’s query log as we do in this paper. To the best of our knowledge, no usagebased spam-detection method has been described in the past. We would like to refine the metrics we have proposed here and study other potential applications in the future. Studying the individual impact of each graph and feature we have introduced in this paper, is another relevant topic for future work. Acknowledgements We thank Ricardo Baeza-Yates for comments on the early versions of this work.
6.
REFERENCES
[1] R. Baeza-Yates and A. Tiberi. Extracting semantic relations from query logs. In Procs KDD, 76–85, 2007. [2] C. Castillo, D. Donato, L. Becchetti, P. Boldi, S. Leonardi, M. Santini, and S. Vigna. A reference collection for web spam. SIGIR Forum, 40(2):11–24, 2006. [3] C. Castillo, D. Donato, A. Gionis, V. Murdock, and F. Silvestri. Know your neighbors: Web spam detection using the web topology. In Procs SIGIR, 423–430, 2007. [4] N. Craswell and M. Szummer. Random walks on the click graph. In Procs ACM SIGIR, 239–246, 2007. [5] D. Fetterly. Adversarial information retrieval: The manipulation of web content. ACM Computing Reviews, July 2007. [6] Z. Gyöngyi and H. Garcia-Molina. Web spam taxonomy. In Procs AIRWEb, 39–47, 2005. [7] A. Ntoulas, M. Najork, M. Manasse, and D. Fetterly. Detecting spam web pages through content analysis. In Procs WWW, 83–92, 2006. [8] D. Puppin and F. Silvestri. The query-vector document model. In Procs CIKM, 880–881, 2006. [9] G. Qiu, K. Liu, J. Bu, C. Chen, and Z. Kang. Quantify query ambiguity using ODP metadata. In Procs ACM SIGIR, 697–698, 2007. [10] F. Radlinski and T. Joachims. Query chains: learning to rank from implicit feedback. In Procs ACM SIGKDD, 239–248, 2005. [11] D. Shen, J.-T. Sun, Q. Yang, and Z. Chen. A comparison of implicit and explicit links for web page classification. In Procs WWW, 643–650, 2006. [12] R. Song, Z. Luo, J.-R. Wen, Y. Yu, and H.-W. Hon. Identifying ambiguous queries in web search. In Procs WWW, 1169–1170, 2007. [13] M. Szummer and T. Jaakkola. Partially labeled classification with markov random walks. In Advances in Neural Information Processing Systems, volume 14, 2001. [14] I. H. Witten and E. Frank. Data Mining: Practical Machine Learning Tools and Techniques with Java Implementations. Morgan Kaufmann, October 1999. [15] B. Wu and B. D. Davison. Detecting semantic cloaking on the web. In Procs WWW, 819–828, 2006. [16] G.-R. Xue, Y. Yu, D. Shen, Q. Yang, H.-J. Zeng, and Z. Chen. Reinforcing web-object categorization through interrelationships. Data Min. Knowl. Discov., 12(2-3):229–248, 2006. [17] G.-R. Xue, H.-J. Zeng, Z. Chen, Y. Yu, W.-Y. Ma, W. Xi, and W. Fan. Optimizing web search using web click-through data. In Procs CIKM, 118–126, 2004.