Weigang et al. / J Zhejiang Univ-Sci C (Comput & Electron) 2014 15(2):81-90
81
Journal of Zhejiang University-SCIENCE C (Computers & Electronics) ISSN 1869-1951 (Print); ISSN 1869-196X (Online) www.zju.edu.cn/jzus; www.springerlink.com E-mail:
[email protected]
Querying dynamic communities in online social networks* Li WEIGANG†1, Edans F. O. SANDES1, Jianya ZHENG1, Alba C. M. A. de MELO1, Lorna UDEN2 (1Department of Computer Science, University of Brasilia, Brasilia 70910-900, Brazil) (2School of Computing, Staffordshire University, Stafford ST18 0AD, UK) †
E-mail:
[email protected]
Received Oct. 8, 2013; Revision accepted Dec. 22, 2013; Crosschecked Jan. 15, 2014
Abstract: Online social networks (OSNs) offer people the opportunity to join communities where they share a common interest or objective. This kind of community is useful for studying the human behavior, diffusion of information, and dynamics of groups. As the members of a community are always changing, an efficient solution is needed to query information in real time. This paper introduces the Follow Model to present the basic relationship between users in OSNs, and combines it with the MapReduce solution to develop new algorithms with parallel paradigms for querying. Two models for reverse relation and high-order relation of the users were implemented in the Hadoop system. Based on 75 GB message data and 26 GB relation network data from Twitter, a case study was realized using two dynamic discussion communities: #musicmonday and #beatcancer. The querying performance demonstrates that the new solution with the implementation in Hadoop significantly improves the ability to find useful information from OSNs. Key words: Follow Model, Hadoop, MapReduce, Querying, Twitter doi:10.1631/jzus.C1300281 Document code: A
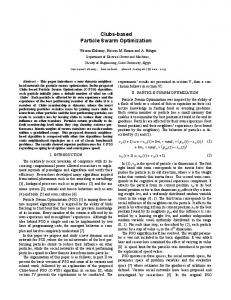
1 Introduction Online social network (OSN) is a category of social media. It uses social network sites and their tools for communication, collaboration, interaction, and sharing ideas, interests, and knowledge with other people. These people may be friends, professional colleagues, or other relations. One of the most popular social network tools is micro-blogging, using sites such as Twitter and Sina Weibo. On 2 May 2011, Osama bin Laden was shot and killed inside a private residential compound in Abbottabad, Pakistan. This news was broadcast over the world. On Sina Weibo, 54 000 messages were issued by users that day. The distribution of the number of messages showed a strong pulse (Fig. 1). In general, OSN platforms, such as Twitter and Weibo, provide a ranking list to show the number of *
Project supported by the Brazilian National Council for Scientific and Technological Development (CNPq) (No. 304058/2010-6) © Zhejiang University and Springer-Verlag Berlin Heidelberg 2014
CLC number: TP393.09
fans of each user, especially for celebrities. This kind of query is easy and not the concern of academic research. Due to the dynamic real-time characteristics of OSNs, an incident happening in the world will be reflected by wide dissemination of information within and outside the social media. In such cases, relationships between the involved users are immediately established in a community or among several groups. It is a challenge to query specific information, such as to query top-X users who have the most followers, in such a dynamically formed community. Sandes et al. (2012) have developed the Follow Model and an Aggregate-Rank-Delete algorithm using a conventional computation environment. However, as the scale of OSNs increases, it is necessary to develop a new computing paradigm to process the massive amounts of data. Zheng et al. (2014) proposed a new method for top-X querying in OSNs using the MapReduce solution in the Hadoop system. This involves the use of MapFollowee&ReduceFollower to find the top-X users from the following relation and obtain the users’
82
Weigang et al. / J Zhejiang Univ-Sci C (Comput & Electron) 2014 15(2):81-90
followers. Based on their work, this paper extends the research to more general situations such as: (1) mapping a relation function to its reverse function; (2) mapping a relation function to its high-order function. 5.0
(A, B), (A, D), (B, C), (B, D), and (C, D)E; relations between objects are associated, i.e., (u, v), (u, x), (v, w), (v, x), and (w, x)R. D
The death of Osama bin Laden
Number of messages (×104)
4.5 4.0 3.5 3.0 2.5
A
B
C
2.0
Fig. 2 A simple undirected graph
1.5 1.0 0.5 0 Jan-2009
May 2, 2011
Jan-2010
Jan-2011
Jan-2012
Jan-2013
Fig. 1 The distribution of messages about the death of Osama bin Laden
From Twitter, message data with 75 GB (Yang and Leskovec, 2011) and relation network data with 26 GB (Kwak et al., 2010) were used in experiments to demonstrate the utility of the developed solution in distributed platforms managed by the Hadoop system. This approach effectively accelerates the querying process. The performance is better not only than the matrix algorithm but also than the original algorithm in the stand-alone version. We chose two groups related to different topics (#musicmonday and #beatcancer) from Twitter to find the top-10 users who have the most followers within each group.
With this definition, we separate the objects from the vertices and the relations from the edges. In OSNs, an object located in a vertex could be a user, a tweet, or a retweet; a relation aggregated in an edge could be a following, a mentioning, or a retweeting relationship. 2.2 Activity associated multi-typed relations In OSNs, the network topology depends on users’ activities associated with their relationships. These activities include following, tweeting, mentioning, retweeting, and commenting (Fig. 3). D r-friends following
A
2 Study of online social networks The study of the formation and dissemination of dynamic communities has attracted much attention recently. In this section, we present mechanisms of OSNs to understand better the interactions between users based on their relationships. 2.1 Multi-typed objects and relations of OSNs To present the problem better, we introduce a typical definition of OSNs based on graph theory. An undirected graph consists of nodes and edges (Fig. 2), which can be described as G=(V, E). The vertex set V contains the vertices, i.e., A, B, C, DV; objects u, v, w, and x are associated in these vertices; the undirected edge set E: V×V represents the edges, i.e.,
following
B
C
Fig. 3 Network relations, relative to user v
Tweeting relationship. When user w posts a message in his/her microblog site, this message is called a tweet and the OSN service will send it to all followers of w, such as v, who will receive this tweet. This process forms a tweeting network topology, where the directional signal ‘→’ indicates the tweeting relation as shown in Fig. 4. In Fig. 4, suppose user w sends a tweet at time t, represented by Tw(w, t). His/Her follower v receives this tweet. Comparing Figs. 3 and 4, the tweet Tw(w, t) is sent from node C to node B, while their following relationship is in the opposite direction: v is a follower of w, from node B to C.
83
Weigang et al. / J Zhejiang Univ-Sci C (Comput & Electron) 2014 15(2):81-90
D
Tw(x, t) D mention
tweeting tweeting
A
B
retweeting retweeting
Tw(w, t) C
Fig. 4 Tweeting and mentioning network topology
Mentioning relationship. When user x writes a tweet Tw(x, t) (Fig. 4), he/she may mention user u, in node A. The user u would know this tweet. If u wants to read this tweet, he/she may visit x’s site. This differs from the situation between users v and w. As a follower of x, v receives the tweet Tw(x, t) from x automatically. In Fig. 4, the dashed directional signal indicates the mentioning relation. In this network topology, user x is called the mentioner and user u is called the mentionee. Retweeting relationship. Retweeting is a complicated activity in OSNs. To explain this scenario, we divide two episodes according to time: 1. The scenario before retweeting. When user w sends a tweet Tw(w, t) and user x sends a tweet Tw(x, t) (Fig. 4), their follower v will receive these tweets. At this moment, v does not repost any tweet. In the network topology of Fig. 4, there are two tweeting connections: tweet Tw(w, t) is sent from node C to B and tweet Tw(x, t) is sent from D to B. Typically, there is a high probability that a user will retweet his/her followee’s message. In the case of v, he/she will probably retweet the tweets from w and x. 2. The scenario in retweeting. After a short time Δt, user v reposts the tweet Tw(w, t), but does not repost Tw(x, t). This action is called retweeting and the tweet reposted by v is called retweet Rt(v, w, t+Δt). The OSN service sends this retweet to user v’s followers, u and x. This process forms a retweeting network topology (Fig. 5), where the directional signal ‘→’ indicates the retweeting relation and the dashed directional signal indicates the tweeting relation. In Fig. 5, user v reposts the tweet from w, where the retweet is represented by Rt(v, w, t+Δt) and the original tweet by Tw(w, t). The retweet is propagated from node B to A and D. Comparing Fig. 5 to Fig. 3, the retweet Rt(v, w, t+Δt) follows the opposite direction to their following relationship.
retweeting Rt(v, w, t+∆t)
A
B
Tw(w, t)
C
Fig. 5 Retweeting network topology
2.3 Follow Model To simplify the description of the relationships in OSNs, Sandes et al. (2012) developed a logical model, the Follow Model, to formulate the following relations between users. Based on this meta model, the relationships associated with different activities can be extended in this manner, such as tweeting, mentioning, and retweeting. In this subsection, we will formally describe the Follow Model and its characteristics. The terms of followee, follower, and r-friends mentioned in Fig. 3 can be represented by functions fout(·), fin(·), and fr(·), respectively, defined as follows: fout(u)={v|(u, v)E}, is the followee function to present the subset, V*, of all followees of user u, V→ V*, V*V; fin(u)={v|(v, u)E}, is the follower function to present the subset, V*, of all followers of user u, V→ V*, V*V; fr(u)=fout(u)fin(u), is the r-friend function to present the subset, V*, of all r-friends of user u, V→V*, V*V. The functions above are collectively known as the Follow Model, which has the following three properties: reverse relationship, compositionality, and extensibility. Reverse relationship. For functions in the Follow Model, the reverse function f′ of the basic functions is defined as f (u ) {v | v f (u )} .
(1)
For the relationship function f{fin, fout, fr}, with the definition of reverse function, we can obtain
f in , f f out , f f out , f fin , f , f f . r r
(2)
84
Weigang et al. / J Zhejiang Univ-Sci C (Comput & Electron) 2014 15(2):81-90
With this definition, the Follow Model can be more easily used in querying optimization. Compositionality. Some new functions can be composed from the Follow Model using union or intersection operations. A new function may present a specific user subset. If f1, f2{fin, fout, fr}, for f1, f2, V→V*, there are f1 f 2 (u )
f1 (v) ,
(3)
I (u , v) f1 (u ) f 2 (v) .
(4)
v f 2 ( u )
The r-friend function fr is an example of the intersection between the followee function fout and the follower function fin. Extensibility. For more query operations, the Follow Model is extensible to form new functions. If f{fin, fout, fr}, there is f·f=f 2, and also f·f n−1=f n. To find the function of the followers of followers of u, there is f in2 (u ). To find r-friends of r-friends of r-friends of … of u, there is f rn (u ). With the above definitions and properties, the Follow Model is proposed with both numeric and symbolic presentations for more sophisticated relationships between the users. It can be used for more relation combinations of queries in OSNs and to develop optimization algorithms.
3 Querying dynamic communities
In this section, the ‘people you may know’ problem is introduced to illustrate the difficulty of querying in a big community. We then present the related work in querying and the MapReduce study. 3.1 Difficulty of querying in the ‘people you may know’ problem
The ‘people you may know’ problem is usually used to explain the difficulty of querying in a big community. The general idea behind the friend recommendation system is that the friends of one’s friends may also be one’s friends. So, if two users have common friends, it is very likely they will become friends in the future. Suppose there are 100 million users in a social network, and that everybody has 100 friends on av-
erage. Bhandarkar (2010) developed an algorithm to find the top three probable friends for each user. In this specific case, the number of the iterations of the algorithm is 108×102×102. If each access to the database costs 1 ms, it would take more than 10 000 days to finish this job using one common computer. In general, the complexity of this algorithm is O(n3). In OSNs, event-driven communities are dynamically generated day by day. For example, on March 11, 2011 Japan’s Tohoku earthquake caused enormous material and human losses. By 18:00, only four hours after the earthquake, 4.5 million messages had been sent on Sina Weibo, of which 300 000 were sent by users in Japan. Querying information from such a community is important and places a high demand in real time. The main purpose of this paper is to propose a new computation model to cater for this requirement. 3.2 Related work
In a virtual community, the querying task is to find the most influential person or most original messages. Influence measurement is an important research topic in OSNs. Cha et al. (2010) collected a large amount of data from Twitter to study user’s influence by indegree, retweets, and mentions. Tang et al. (2009) proposed a method based on the theory of factor graphs to incorporate the information of topic and social relationship into a unified probabilistic model. Goyal et al. (2010) developed a framework using the General Threshold Model to measure probabilities of influence by neighbors of a user. Time was considered as a factor in their model, which can make the computation incremental and efficient. Anagnostopoulos et al. (2008) distinguished social influence from various factors, such as homophile and unobserved confounding variables, which can have statistical correlation. The research by Chen et al. (2009) focused on influence maximization within social networks. To reduce the large running time of greedy algorithms, these authors proposed degree discount heuristics to select the proper user as seed to propagate the information. This work determined the location of the users who had more influence (those who promoted the information propagation). Weigang et al. (2013) developed the W-entropy index based on information theory, to study the influence of individuals reflecting
85
Weigang et al. / J Zhejiang Univ-Sci C (Comput & Electron) 2014 15(2):81-90
uneven information distribution across various social networks. The above studies provide us with the challenge and references to measure the influence within a special community. Tang et al. (2012) used an in-memory social network query system to realize 19 querying problems. This method needs 64 GB RAM for execution. Sandes et al. (2012) developed the Follow Model to describe the relationships of OSNs, and the Aggregate-Rank-Delete algorithm to optimize querying performance. A method of accelerating queries over microblog datasets via grouping and indexing techniques was presented by Zheng et al. (2012). Zhu et al. (2012) demonstrated fast and high throughput with an SQL query system. Theobald et al. (2008) mentioned the top-X problem and proposed an efficient and versatile top-K query process for semi-structured data. There are many methods to formulate OSNs using graph theory. A popular method is the technique related to complex networks. For example, the problem of the prediction of new relation between the users was formulated as the link prediction method (Liben-Nowell and Kleinberg, 2007; Lü and Zhou, 2011). Another method involves hypergraph theory (Karypis et al., 1999). Zhang and Liu (2010) developed a model for social tagging networks considering a user’s tags association with the folksonomy concept. Sun et al. (2012) used graph theory to define a model of heterogeneous information networks. As there are series of numeric indices and metrics related to complexity networks and hypergraph theory, these formulations are frequently used in the study of complex communities. Considering the human aspect of social networks, the symbolic representation of OSNs is a necessity for semantic analytics and parallel paradigms. 4 Parallel querying using MapReduce
This section describes the application of the Follow Model and MapReduce solution to querying in OSNs. The MapReduce method (Dean and Ghemawat, 2008) was created to simplify data processing on clusters. This technique allows large-scale computation to be performed in a parallelized computing and distributed storage environment. A research group, originally from Yahoo, developed a pioneer
system call Hadoop (Bialecki et al., 2005), which is unique in its ability to simultaneously process and analyze complex and disparate types of data. 4.1 MapReduce model for reverse relationship queries
In Twitter, Weibo, or other OSNs, the relations and activities of users are dynamically changing. Besides the traditional actions such as retweeting, mentioning, commenting, and liking (recommending), the latitude relationship between the users has recently been added. These refinement relationships require more specialization in the query. The most common case is to query the top-X users in a particular community (usually those with the same tag or those doing the same action) with a time restriction, for example, within the period [ta, tb]. Suppose in time span [ta, tb] a tweet was retweeted by a set of m users Z={A, B, C, …, P, Q, R, …}. This set dynamically changes as other users retweet the same tweet. This variation is a great challenge for traditional computation. To overcome this difficulty, we have introduced a new algorithm called MapFollowee&ReduceFollower (Zheng et al., 2014), which uses the Follow Model and the MapReduce concept to parallelize the calculation. This technique is suitable for this kind of task, i.e., to find the couples of (follower, followee) from the changing set Z (referred to as the mapping step), and then rank top-X members (referred to as the reducing step). Table 1 shows the mapping and reducing steps in top-X querying. Table 1 The MapFollowee&ReduceFollower algorithm in top-X querying Set Z fin(·)
Follower Followee user A
user P
user A
user Q
user B
user Q
user B
user R
user C … Top-2
P
Set Z |fin(·)|
A
P
1
Q
2
R
2
S
…
Q
A, B
R
B, C
…
…
user R
A
…
A
…
…
…
…
…
…
Map
→
Reduce →
Q, R
The proposed top-X querying algorithm, MapFollowee&ReduceFollower, is basically divided into four steps:
86
Weigang et al. / J Zhejiang Univ-Sci C (Comput & Electron) 2014 15(2):81-90
1. Collecting step. This step is to construct the correlation of users in the set Z. Usually we can find the following relations from social network data. For each user, there are a number of pairs to present his/her following relation, namely, fout(·). In the first two lines of Table 1, the relation means that user A follows user P. 2. Mapping step. With the following pairs between the users, we use the mapping function to obtain the followed relation fin(·). This function obtains the followers for every user in set Z, which is dynamically formed and is of significant scale in OSNs. As shown in the second part of Table 1, user Q has two followers: users A and B. 3. Reducing step. With the followers of everyone in set Z, we calculate the follower number in this step. For example, user P has one follower and user Q has two followers, as shown in the last column of Table 1. 4. Ranking step. In this step, we order the users by the number of their followers, and the result is what we expected: top-X, in Table 1, is top-2. In fact, the ranking function is inherent in the reducing function. We list them here to explain our algorithm more clearly. With the Follow Model description, the followee function fout(·) and follower function fin(·) are mutually inverse functions. Consequently, this algorithm can be extended to more general cases: 1. MapFollowee&ReduceFollower (Table 1). This function can find out who has the most followers in a given group. 2. MapFollower&ReduceFollowee. This function can be used to find the users who have the most followees. 4.2 MapReduce model for high-order relationship queries
Besides the basic relations between the users, we need to find out other complicated relations because they can offer more information. For example, in the ‘people you may know’ problem, the most interesting idea is to find out the friends of friends. Here, we list common composition functions of the Follow Model: 1. fout(fout(·)). This function can be used to query the followees of someone’s followees. 2. fin(fin(·)). This function can be used to query the followers of someone’s followers.
3. fin(fout(·)). This function can explore the followers of someone’s followees. It can be used to find out who has the same interests as the user. 4. fout(fin(·)). This function can be used to find out the followees of someone’s followers. The high-order function can also be presented using the MapReduce solution. We take fout(fout(·)) as an example to explain the procedure of the solution (Table 2). Table 2 The MapFollowee&ReduceFollowee model for finding out fout(fout(·)) u u1 u1 u1 u2 u2 u3 u3 u4 …
X x1 x2 x2 x3 x4 x2 x2 x5 … Top-3
Y u y1 u1 y2 u2 y3 u3 y1 Map u4 y2 → … y2 … y3 … y3 … … …
List Y y1, y2, y3 y1, y2 y2, y3 Reduce y3 → … … … … … u1, u2, u3
u u1 u2 u3 u4 … … … … …
|Y| 3 2 2 1 … … … … …
Set X is the result of fout(u); set Y is the result of fout(fout(u))
The process of the MapFollowee&ReduceFollowee algorithm consists of four steps: 1. Collecting step. The first step is to collect the user pairs from the given relationship in the network dataset. For every user in the set, it is necessary to collect all the relation pairs (x, y) (namely (fout(u), fout(fout(u))), xfout(u), yfout2(u)) from the whole social network, where y is not in subset X. 2. Mapping step. For every pair collected in the first step, we build a list of the followees in the mapping process. During this process all the pairs of (u, y) connected by x will be found. 3. Reducing step. From the result of the mapping process, we calculate the number of y in the list for each u. 4. Ranking step. The ranking function is applied to select the top-X. In this process, we can rank the users u who have most followees of followees. Another three composition functions can be described in the same way to realize the parallel computation.
Weigang et al. / J Zhejiang Univ-Sci C (Comput & Electron) 2014 15(2):81-90
4.3 Implementation of the algorithm to find the top-X in Hadoop
Clearly, the previously developed models are effective for achieving parallel computing by implementation in the Hadoop system. For studying unstructured data of a user relationship network from OSNs, the proposed algorithm has a complexity of O(n3). The procedure of mapping the couples of (follower, followee) is the most complicated and time-consuming part of this method. So far there is no magic bullet to avoid data processing with the complexity of O(n3). Because of the parallel paradigm of Hadoop, it is an ideal solution for this kind of problem. Fig. 6 presents the implementation of the algorithm MapFollowee&ReduceFollower to find the top-X using the Hadoop system. The main functions are described. // Class mapper // Find the relationship in the scope of the community method map(followerid, followeeid) for all followeridS if (followeeidS) emit pair(followeeid, followerid) // Class reducer method reduce(followeeid, pairs) for all pairspairs // Cfollowee: the number of followers this followee has Cfollowee←Cfollowee+1 sort(Cfollowee) emit (followeeid, Cfollowee) Fig. 6 Algorithm of the MapFollowee&ReduceFollower model
With data collected from Twitter or Weibo, interesting members of the group are selected using hashtag or timeline. In the mapping step, the method map(followerid, followeeid) is applied to take the members of the defined community as followerid, and all the relationship records (followerid, followeeid) are picked out as the result set from the entire social relation network. Then, every followeeid is identified whether or not he/she belongs to the community. If he/she does not belong, the corresponding relationship will be eliminated from the set. After the mapping step, a new social relation network is constructed within the defined dynamic community.
87
In the reducing step, method reduce(followeeid, pairs) (Fig. 6) is applied to work out the number of followers for every user in the dynamic community defined previously. In the ranking step, the influence of the users in the community is ranked by certain criteria or rules, such as the number of followers or the users who have been most retweeted. The number of followers within the selected community is used for ranking in the following section. In this case, the more followers a user has, the more influential he/she is.
5 Case study
At the start of this section, the details of a dataset from Twitter are described. Then, in Section 5.2., the system setup of Hadoop is listed. The results and performance comparisons of our proposed algorithm are reported in Section 5.3. Finally, we list some remarks. 5.1 Message and relation network datasets
In our experiment, the social relation graph crawled by Kwak et al. (2010) from Twitter has 41.7 million users and 1.47 billion relationships. We obtain the relations from this social graph. The message dataset of OSNs was collected by Yang and Leskovec (2011). There are nearly 580 million posts from 20 million users covering an eight-month period from June 2009 to February 2010. It consists of about 20%−30% of all posts published on Twitter during that time period. Almost 71 million Twitter posts were retweets. Moreover, 66 935 426 events (words starting with #) are referred to in the dataset. Once redundant records (when the same user referred to the same event several times) were removed, 4 086 161 of them were unique. These two datasets were used to evaluate our proposal. 5.2 Hadoop system setup
The Apache Hadoop software library is a framework that allows for the distributed processing of large datasets across clusters of computers using MapReduce programming models. The cluster, which has four computers, is connected by an eightport gigabit Ethernet switch with category 6 cables. This connection guarantees that the maximum
88
Weigang et al. / J Zhejiang Univ-Sci C (Comput & Electron) 2014 15(2):81-90
transmission rate between any two computers reaches almost 100 MB/s. This high-speed connection can make the cluster work more efficiently. Computer 1 plays two roles in this cluster. First, it is the master machine, which manages the running of the cluster. On the other hand, it is a slave machine to execute the computation of other computers. With this setup, the ‘people you may know’ problem was first simulated to test the effectiveness of the proposed algorithms and implementation in Hadoop. The results of the pre-calculation demonstrated the consistency and effectiveness of our proposed method and implementation.
in the community concerning the topic #musicmonday, and was considered top of this group based on his number of followers.
5.3 Results and performance using Hadoop
When finding the top-X influential users within a particular group, the MapFollowee&ReduceFollower algorithm in Section 4.1 was tested using the data concerning two communities of the discussion topics #musicmonday and #beatcancer from Twitter. The subset of top-X contains the users who have the most followers in a group. For the first community, we chose the users who sent the tweet and mentioned the topic #musicmonday as a group comprising 150 545 users. In this group, relations of 55 115 users were available from the dataset; we focused only on those users with complete information. There were a total of 18 580 632 relations related to these users in the entire relation network of Twitter at that time. In the group #musicmonday, there were 257 379 relations. Our aim was to find out who had the most followers among the 55 115 users, based on 257 379 relations. In the experiment, the followers were classified as followers and event followers. The index of followers is the number of a member’s fans in the entire social network. However, according to our problem, we focused on the influence of someone in a dynamic community, considering that the number of fans in the scope of the proper community is more reasonable than the number of followers in the global sense. Therefore, the index of event followers is proposed. With different configurations in a cluster, we tested the MapFollowee&ReduceFollower algorithm for top-10 querying. Souja Boy Tell'Em (Table 3) is a rapper, record producer, actor, and entrepreneur. He has 4 882 022 followers in Twitter and 4572 followers
Table 3 Top 10 users in the group with event #musicmonday in Twitter (June 2009−Dec. 2009) User name
@Twitter
Souja Boy Tell'Em @soujaboytellem
Number of Number of followers event followers 4 882 022 4572
Pete Cashmore
@mashable
3 230 134
4222
Hayley Williams
@yelyahwilliams
3 132 653
4167
Jimmy Eat World
@jimmyeatworld
2 668 879
2534
PostSecret
@postsecret
TWT.FM
@twtfm
Cassadee Pope
@cassadeepope
Juelz Santana
@thejuelzsantana
520 801
2180
1 495 309
2139
391 934
1524
1 022 751
1518
Mariana de Souza @marimoon
1 560 793
1330
Pleasure Principle @pleasurep
82 616
1066
We also chose topic #beatcancer as a group consisting of 66 846 users (Table 4). In this group, relations of 26 930 users were available from the dataset. There were a total of 8 668 545 relations related to these users in the entire relation network of Twitter. The number of effective relations was 56 948. We used the algorithm of MapFollowee&ReduceFollower to find the top-X users. The first one was Pete Cashmore, CEO and founder of the blog Mashable. He has a total of 3 230 134 followers in Twitter, of whom 2494 are in this group. From Table 5 we observed that the cluster was more efficient than a stand-alone computer carrying out the same task. When the computation task with 26 GB data was processed by one machine, the CPU time was 4830 s from the community with the #musicmonday event with 55 115 users (Table 5). When used by two machines in the Hadoop system, it cost 3526 s; and by four machines, 2482 s. In querying the community with the topic of #beatcancer, the CPU time was 3020 s by one computer, 2294 s by two machines, and 1751 s by four. The percentage of the improvement did not match the increment of the cluster, because with more computers in the cluster, the communication between the nodes cost more system overhead. For large scale computation with more nodes, such as 100 to 4000, this scenario will be improved.
Weigang et al. / J Zhejiang Univ-Sci C (Comput & Electron) 2014 15(2):81-90
Table 4 Top 10 users in the group with event #beatcancer in Twitter (June 2009−Dec. 2009) User name
Number of Number of followers event followers 2494 3 230 134
@Twitter
Pete Cashmore
@mashable
Stephanie Pratt
@stephaniepratt
638 059
644
Charlie Brooker
@charltonbrooker
715 148
535
Mikey Way
@mikeyway
284 845
485
117 040
409
Jeanette Joy Fisher @JeanetteJoy Richard Bacon
@richardpbacon
1 487 418
405
Calvin Harris
@CalvinHarris
2 149 058
356
Shannon Seek
@shannonseek
59 312
343
Don Lemon
@DonlemonCNN
177 646
331
Calvin Lee
@mayhemstudios
81 211
331
Table 5 A comparison of the execution times of different configurations of the cluster Event
Number of users
#musicmonday #beatcancer
55 115 26 930
Execution time (s) One Two Four node nodes nodes 4830 3526 2482 3020 2294 1751
5.4 Remarks
As the querying from OSNs is a big data problem, there are basically two directions of investment to develop an efficient algorithm: (1) to reduce the search space; (2) to use a parallel paradigm. To reduce the search space, Sandes et al. (2012) proposed the Aggregate-Rank-Delete algorithm to rank the users according to the query interest and to delete the most uninteresting users from the dataset. This paper provides potential to use parallel paradigm for querying in OSNs. It will be interesting to combine this computation model with the AggregateRank-Delete algorithm in our future research.
6 Conclusions
Querying the information from dynamic communities/groups in OSNs is a complicated problem involving real-time information acquisition and online big data processing. The development of more efficient methods is a challenge for the scientific community. In this paper, we described the mechanisms of OSNs and the relationships and actions of the users by
89
using the Follow Model, and proposed a new querying solution with the MapReduce concept. The developed algorithms are based on the property of parallel computation and implemented in the Hadoop system. In the specification of the mapping and reducing procedures for reverse and high-order relation functions of users, the Follow Model can be used to present the relationships of the OSN to parallelize the computation using the Hadoop system. We tested our proposed method using real data collected from Twitter. Top-10 results were listed from two different discussion communities: #musicmonday and #beatcancer. The performance of computation showed positive implementation of the algorithms in parallel paradigms. In future research, we intend to collect more large-scale dynamic groups from OSNs to develop related experiments and connect more computers in the Hadoop system. With this advanced and sophisticated implementation, we can make deeper performance analysis to improve the efficiency of the proposed algorithm. We also propose to introduce a more comprehensive model to reflect the time factor in retweeting querying and prediction. References Anagnostopoulos, A., Kumar, R., Mahdian, M., 2008. Influence and correlation in social networks. Proc. 14th ACM SIGKDD Int. Conf. on Knowledge Discovery and Data Mining, p.7-15. [doi:10.1145/1401890.1401897] Bhandarkar, M., 2010. MapReduce programming with Apache Hadoop. 24th IEEE Int. Parallel & Distributed Processing Symp., p.1. [doi:10.1109/IPDPS.2010.5470377] Bialecki, A., Cafarella, M., Cutting, D., et al., 2005. Hadoop: a framework for running applications on large clusters built of commodity hardware. Available from http://lucene. apache.org/hadoop. Cha, M., Haddadi, H., Benevenuto, F., et al., 2010. Measuring user influence in Twitter: the million follower fallacy. Proc. 4th Int. AAAI Conf. on Weblogs and Social Media, p.10-17. Chen, W., Wang, Y., Yang, S., 2009. Efficient influence maximization in social networks. Proc. 15th ACM SIGKDD Int. Conf. on Knowledge Discovery and Data Mining, p.199-208. [doi:10.1145/1557019.1557047] Dean, J., Ghemawat, S., 2008. MapReduce: simplified data processing on large clusters. Commun. ACM, 51(1):107113. [doi:10.1145/1327452.1327492] Goyal, A., Bonchi, F., Lakshmanan, L.V.S., 2010. Learning influence probabilities in social networks. Proc. 3rd ACM Int. Conf. on Web Search and Data Mining, p.241-250. [doi:10.1145/1718487.1718518]
90
Weigang et al. / J Zhejiang Univ-Sci C (Comput & Electron) 2014 15(2):81-90
Karypis, G., Aggarwal, R., Kumar, V., et al., 1999. Multilevel hypergraph partitioning: applications in VLSI domain. IEEE Trans. VLSI, 7(1):69-79. [doi:10.1109/92.748202] Kwak, H., Lee, C., Park, H., et al., 2010. What is Twitter, a social network or a news media? Proc. 19th Int. Conf. on World Wide Web, p.591-600. [doi:10.1145/1772690.177 2751] Liben-Nowell, D., Kleinberg, J., 2007. The link-prediction problem for social networks. J. Amer. Soc. Inform. Sci. Technol., 58(7):1019-1031. [doi:10.1002/asi.20591] Lü, L., Zhou, T., 2011. Link prediction in complex networks: a survey. Phys. A, 390(6):1150-1170. [doi:10.1016/j.physa. 2010.11.027] Sandes, E.F.O., Weigang, L., de Melo, A.C.M.A., 2012. Logical model of relationship for online social networks and performance optimization of queries. LNCS, 7651:726736. [doi:10.1007/978-3-642-35063-4_59] Sun, Y., Han, J., Aggarwal, C.C., et al., 2012. When will it happen?—relationship prediction in heterogeneous information networks. Proc. 5th ACM Int. Conf. on Web Search and Data Mining, p.663-672. [doi:10.1145/2124 295.2124373] Tang, J., Sun, J., Wang, C., et al., 2009. Social influence analysis in large-scale networks. Proc. 15th ACM SIGKDD Int. Conf. on Knowledge Discovery and Data Mining, p.807-816. [doi:10.1145/1557019.1557108] Tang, Z., Lin, H., Li, K., et al., 2012. Acolyte: an in-memory social network query system. Proc. 13th Int. Conf. on Web Information Systems Engineering, p.755-763. [doi:10.1007/978-3-642-35063-4_62]
Theobald, M., Bast, H., Majumdar, D., et al., 2008. TopX: efficient and versatile top-k query processing for semistructured data. VLDB J., 17(1):81-115. [doi:10.1007/ s00778-007-0072-z] Weigang, L., Zheng, J., Liu, G., 2013. W-entropy method to measure the influence of the members from social networks. Int. J. Web Eng. Technol., in press. Yang, J., Leskovec, J., 2011. Patterns of temporal variation in online media. Proc. 4th ACM Int. Conf. on Web Search and Data Mining, p.177-186. [doi:10.1145/1935826. 1935863] Zhang, Z.K., Liu, C., 2010. A hypergraph model of social tagging networks. J. Stat. Mech., 2010(10):P10005. [doi:10.1088/1742-5468/2010/10/P10005] Zheng, J., Weigang, L., Uden, L., 2014. Top-X querying in online social networks with MapReduce solution. Proc. 8th Int. Conf. on Knowledge Management in Organizations, p.397-410. [doi:10.1007/978-94-007-7287-8_32] Zheng, L., Zhou, X., Lin, Z., et al., 2012. Accelerating queries over microblog dataset via grouping and indexing techniques. Proc. 13th Int. Conf. on Web Information Systems Engineering, p.764-770. [doi:10.1007/978-3-642-350634_63] Zhu, F., Liu, J., Xu, L., 2012. A fast and high throughput SQL query system for big data. Proc. 13th Int. Conf. on Web Information Systems Engineering, p.783-788. [doi:10. 1007/978-3-642-35063-4_66]