(Device;Rectangle;)V. 2 : ListView.handleResize(Z)V. 3 : ListView$14.run()V. 4 : ... Figure 2. Sample typestate history for a single instance of. Image that was ...
QVM: An Efficient Runtime for Detecting Defects in Deployed Systems Matthew Arnold
Martin Vechev
Eran Yahav
IBM Research
IBM Research
IBM Research
Abstract
1. Introduction
Coping with software defects that occur in the post-deployment stage is a challenging problem: bugs may occur only when the system uses a specific configuration and only under certain usage scenarios. Nevertheless, halting production systems until the bug is tracked and fixed is often impossible. Thus, developers have to try to reproduce the bug in laboratory conditions. Often the reproduction of the bug consists of the lion share of the debugging effort. In this paper we suggest an approach to address the aforementioned problem by using a specialized runtime environment (QVM, for Quality Virtual Machine). QVM efficiently detects defects by continuously monitoring the execution of the application in a production setting. QVM enables the efficient checking of violations of user-specified correctness properties, e.g., typestate safety properties, Java assertions, and heap properties pertaining to ownership. QVM is markedly different from existing techniques for continuous monitoring by using a novel overhead manager which enforces a user-specified overhead budget for quality checks. Existing tools for error detection in the field usually disrupt the operation of the deployed system. QVM, on the other hand, provides a balanced trade off between the cost of the monitoring process and the maintenance of sufficient accuracy for detecting defects. Specifically, the overhead cost of using QVM instead of a standard JVM, is low enough to be acceptable in production environments. We implemented QVM on top of IBM’s J9 Java Virtual Machine and used it to detect and fix various errors in realworld applications.
Despite increasing efforts and success in identifying and fixing software defects early in the development life cycle, some defects inevitably make their way into production. The wide variety of deployment configurations and the diversity of usage scenarios is almost a certain guarantee that any large system will exhibit defects after it has been deployed. Detecting and diagnosing defects in a production environment remains a significant challenge. Failures in such environments might occur with low frequency and be virtually impossible to reproduce. For example, a defect might occur due to a specific concurrent interleaving, a specific lengthy user interaction, or a slow resource leak that gradually degrades system performance leading to an eventual crash. Existing tools for diagnosing defects “in the wild” are limited and usually incur an unacceptable overhead that significantly disrupts the operation of the deployed system. On the other hand, reproducing the failure in a test environment (if at all possible) may require considerable time and effort. One way to detect rarely occurring defects is to continuously monitor a system for violations of specified correctness properties. For example, this can be achieved by using global property monitors and local assertions. However, the typical cost of these techniques prevents programmers from widely using them in production environments. This work describes a runtime environment that is able to detect and help diagnose defects in deployed systems. Towards this end, we present the Quality Virtual Machine (QVM), a runtime environment that uses the technology and infrastructure available in a virtual machine to improve software quality. QVM provides an interface that allows software monitoring clients to be executed with a controlled overhead. Based on this interface, we present three such clients that continuously monitor application correctness by using a combination of simple global property monitors (typestate properties) and assertions. In addition, QVM automatically collects debug information which enables effective defect diagnosis. We implemented QVM on top of IBM’s J9 Java Virtual Machine. We used a number of large-scale real-world appli-
Categories and Subject Descriptors D.2.5 [Testing and Debugging] General Terms Algorithms, Reliability
Permission to make digital or hard copies of all or part of this work for personal or classroom use is granted without fee provided that copies are not made or distributed for profit or commercial advantage and that copies bear this notice and the full citation on the first page. To copy otherwise, to republish, to post on servers or to redistribute to lists, requires prior specific permission and/or a fee. OOPSLA’08, October 19–23, 2008, Nashville, Tennessee, USA. c 2008 ACM 978-1-60558-215-3/08/10. . . $5.00 Copyright °
cations with QVM and found defects in many of them. We explain the design rationale behind QVM in Section 3.1. 1.1
Main Contributions
The contributions of this paper include: • QVM: a runtime environment targeted towards defect
detection and diagnosis in production systems. • A novel overhead manager that enforces an overhead
budget on client analyses, while maintaining sufficient accuracy for detecting defects. • We introduce property-guided sampling and in particular
object-centric sampling, to collect sampled profiles while preserving correctness of the analysis. • A lightweight interface that helps separate analysis clients
from the details of the underlying VM, and transparently manages overhead of these clients. • We use this infrastructure to implement three representa-
tive analysis clients: (i) tracking simple temporal safety properties and providing debug information; (ii) checking standard Java assertions; (iii) checking expressive heap queries pertaining to object ownership. • We implemented QVM on top of IBM’s production Java
Virtual Machine (J9). We used QVM as our standard day to day virtual machine, running a wide range of applications without a noticeable slowdown. We show that QVM can be used to effectively detect defects in such applications, and help diagnose them. In addition, we evaluate the overhead on the standard SPECjvm98 and Dacapo benchmarks. 1.2
Overview
In this section we provide a brief informal overview of QVM components and our experimental evaluation. Overhead Manager QVM allows the user to specify an overhead that is considered acceptable for the current monitoring environment. The maximum acceptable overhead may be 5%-10% in a live deployed system, yet 100% overhead (factor of 2 slowdown) may be considered acceptable in a testing environment. Given an overhead budget, the QVM strives to collect as much useful information as possible from the executing program while staying within the specified budget. QVM Interface (QVMI) A performance-aware profiling/monitoring interface that allows client analyses to remain decoupled from the VM, while maintaining efficiency. The design goal of this component is to enable development of powerful, yet efficient dynamic analyses. Technically, the overhead manager and the QVMI work together to provide clients with a transparent adaptive overhead management. Analysis Clients Using the QVM platform, we implement three analysis clients as follows.
Typestate Properties: This analysis client enables the dynamic checking of typestate properties. Dynamic checking of typestate properties, as well as generalized multipleobject typestate, has been addressed before in Tracematches [3] and MOP [12]. We use the typestate client to demonstrate three contributions of our platform: (i) adaptive overhead management; (ii) collection of timing information for typestate transitions; (iii) collection of additional detailed debug information with low overhead. Local Assertions: QVM allows efficient sampling of user assertions by intercepting standard Java assertions and managing their execution through the overhead manager. Heap Probes and Operations: QVM enables the dynamic checking of various global heap properties such as object-sharing, ownership, thread-ownership and reachability. These properties are useful for both debugging and program understanding purposes. Experimental Evaluation To evaluate the usability of QVM in finding defects and diagnosing them, we focused on typestate properties that correspond to resource leaks. For that purpose, we set QVM as the default JVM used in our environment and used it to perform all of our daily tasks while recording its error reports. To further exercise QVM, we used a wide range of applications on a regular basis. Some of the applications considered are an instant-messenger (goim), newsfeed readers (feednread, rssowl), file management utilities (virgoftp, jcommander), large IBM internal applications, etc. For all of these applications, the overhead incurred by running them on top of QVM was unnoticeable to the user. In some of our experiments (e.g., Azureus, virgoftp, goim), we investigated each report manually, diagnosed the causes of the errors, and implemented fixes. For some applications, our defect reports were confirmed by the development team, and our fixes were incorporated into the codebase. To evaluate the usability of heap and local assertions, we have added such assertions to a small number of applications and evaluate their effectiveness. The overhead of QVM is not noticeable by the user while using interactive applications, so we use the SPECjvm98 and Dacapo benchmarks to perform evaluate the overhead manager’s effectiveness.
2. Motivating Example Azureus [8] is an open-source implementation of the BitTorrent protocol. It supports several modes of user interaction, all implemented using the Standard Widget Toolkit (SWT) [18]. Azureus is the #1 downloaded Java program from SourceForge, and has more than 160 million downloads to date. Azureus plays the role of both a client and a server for P2P file sharing, and is therefore a relatively longrunning application. Finding Bugs We run Azureus with QVM, monitoring various correctness properties, including possible SWT resource leaks and IOStream leaks. Azureus runs on QVM
QVM ERROR:[Resource_not_disposed] object [0x98837030] of class [org/eclipse/swt/graphics/Image] allocated at site ID 2742 in method [com/aelitis/azureus/.../ListView.handleResize(Z)V] died in state [UNDISPOSED] with last QVM method [org/.../Image.isDisposed()Z]
initial
1 : Image.(Device;Rectangle;)V Image.(Device;Rectangle;)V
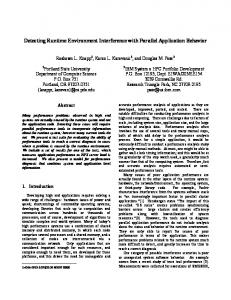
Figure 1. A sample QVM error report for Azureus. with no apparent slowdown. Over the course of few hours, we check the QVM logs and observe that some errors were reported. Fig. 1 shows an example of an error reported by QVM while running Azureus. This is the actual error report as produced by QVM where some package names have been abbreviated. By itself, this error report provides useful information about the property being violated. In this case, the reported Image object has not been properly disposed before it became unreachable. Failure to properly dispose such SWT resources leads to leakage of OS-level resources and may gradually hinder performance and even lead to a system crash. The error report of Fig. 1 provides the basic information necessary to track down the error: the method in which the object was allocated, the object’s last state, and the last method invoked on the object. Diagnosing the Cause The QVM error report above notifies the user that there is an error, but understanding the cause of the error and introducing a fix is still nontrivial. The programmer needs to track the flow of the object through the program to identify why dispose was not called. To assist the programmer in this task, QVM provides additional, more detailed, debug information in the form of a typestate history. A typestate history for an object shows all the methods that have been invoked with that object as a receiver, over the course of the object’s lifetime — from allocation to collection. For every method invocation, the invocation history collects the contexts in which it was invoked. (We provide a more elaborate description of the typestate history in Section 5.1.) To maintain a low runtime overhead, a typestate history is only collected for some of the tracked objects. Whenever an allocation site is identified as allocating a number of objects that violate a property, QVM starts recording typestate histories for a sample of objects allocated at that site. This object-centric sampling is one of the features that makes it possible to collect detailed debug information with low overhead. Fig. 2 shows an example of a typestate history for an object allocated at the same site as the object reported in Fig. 1. The typestate history abstracts the history of methods invoked on the object. Technically, the typestate history is a directed graph with labeled nodes and labeled edges. A node in the graph represents the state of the object after a specific method has been invoked on it. There is a single node in the graph for each method invoked on the object
2 : ListView.handleResize(Z)V 3 : ListView$14.run()V 4 : ... 1 : Image.init(Device;II)V
Image.init(Device;II)V
2 : Image.(Device;Rectangle;)V 3 : ListView.handleResize(Z)V 4 : ... 1 : Image.internal_new_GC(GCData;)I
Image.internal_ new_GC(GCData;)I
2 :GC.(Drawable;I)V 3 : GC.(Drawable;)V 4 : ListView.handleResize(Z)V 1 : Image.internal_dispose_GC(IGCData;)V
Image.internal_ dispose_GC(IGCData;)V
2 : GC.dispose()V 3 : ListView.handleResize(Z)V 4: ...
1 : Image.isDisposed()Z Image.isDisposed()Z
2 : GC.drawImage(Image;IIIIIIII)V 3 : ListView$canvasPaintListener .doPaint(Event;)V 4: ...
OD
Figure 2. Sample typestate history for a single instance of Image that was reported as non-disposed in Fig. 1. The figure only shows a single sample stack trace for every method invoked on the object.
(summarizing all invocations of that method). A node in the graph is labeled by the name of the invoked method, and by a set of (bounded) contexts — representing the contexts in which the method was invoked. An edge between nodes m1 and m2 in the graph represents the fact that the method corresponding to m2 has been invoked immediately after the method corresponding to m1 has been invoked. Note that this directed edge only denotes the order in time between the two methods. It does not say that m2 is called from m1 . Next, we show how we used the debug information provided by QVM in order to find the cause of an error. In the example of Fig. 2, there are 5 methods that have been invoked on the tracked object. First, the object is initialized by invoking the and init methods. Then, a graphical context (GC) is created around the image (internal new GC) and disposed (internal dispose GC). Finally, isDisposed is invoked over the image. The method Image.dispose() that is required for properly disposing the image is never invoked.
c l a s s ListView extends . . . { p r i v a t e Image imgView = n u l l ; / / . . . protected void h a n d l e R e s i z e ( boolean bForce ) { / / . . . i f ( imgView == n u l l | | b F o r c e ) { imgView = new Image ( l i s t C a n v a s . g e t D i s p l a y ( ) , c l i e n t A r e a ) ; l a s t B o u n d s = new R e c t a n g l e ( 0 , 0 , 0 , 0 ) ; bNeedsRefresh = true ; } else { // ... } // ... } }
protected void h a n d l e R e s i z e ( boolean bForce ) { / / . . . i f ( imgView == n u l l | | b F o r c e ) { assert ( ! QVM.isShared ( imgView ) ) ; i f ( imgView ! = n u l l && ! imgView . i s D i s p o s e d ( ) ) imgView . d i s p o s e ( ) ; imgView = new Image ( l i s t C a n v a s . g e t D i s p l a y ( ) , c l i e n t A r e a ) ; l a s t B o u n d s = new R e c t a n g l e ( 0 , 0 , 0 , 0 ) ; bNeedsRefresh = true ; } else { // ... } // ... }
Figure 3. Azureus code fragment leaking SWT Image objects.
Figure 4. A fix to the Image leak in handleResize of Fig. 3
In this simple example, there is only one context in which each method has been invoked. The context is shown inside a rectangle next to its corresponding graph node. Considering the contexts in which the methods in this example were invoked, we can see that most of the operations on the tracked object are performed through the handleResize method in which it was allocated. The only exception is the call to isDisposed() which originates in a paint event of the list view. We therefore focus our attention on the handleResize method in azureus.ui.swt.views.list.ListView. The typestate history serves as a guide to the execution in which the property was violated. Following the sequence of calls in the debug information we further focus attention to the code excerpt shown in Fig. 3. The problem in this method represents a common source of leaks: a new image is stored into the field imgView without properly disposing the previous image that was stored in the field. In this example, handleResize mixes the case of imgView == null (no previous image is known for taking previous bounds) with the case of forced resize (bForce == true). As a result, there are cases in which a new Image is created without properly disposing the previous Image stored in imgView. The number of Image objects leaked as a result of this bug directly depends on user interaction. Since this leak is associated with a resize event, it may not occur in highfrequency. However, the cumulative effect of a large number of small leaks may be fatal. In Section 7.1, we discuss additional problems found on Azureus by QVM, and show that some of these occur very frequently and result in significant resource leaks.
to be shared between multiple GUI components. The convention is that whoever allocates the resource is responsible for its safe disposal. When we reach the point of allocating a new Image and storing it into imgView, we don’t know whether the previous value of imgView was allocated in this method. Furthermore, we don’t know whether other GUI components are still using the image. At this point, we leverage QVM’s heap assertions and check that the object pointed-to by imgView is not shared (i.e., does not have any references other than imgView pointing to it). We introduce disposal code preceded by an assertion that makes sure that we are not disposing a shared resource. (The disposal of a shared resource might end up crashing the application at a later point when the user takes an action that uses the resource.) The modified handleResize method is show in Fig. 4. We now run the fixed version of this method with QVM for a few weeks, and observe that the previously reported leak does not occur. Our assertion also makes sure that the disposal of the Image does not affect any other GUI component. We reported this leak and its fix, as well as other problems mentioned in Section 7, to the Azureus development team. The problems were confirmed as real bugs, and our suggested fixes were incorporated into the project’s codebase.
Developing a Fix Now that we have diagnosed the bug as being caused by not disposing the old Image object stored in imgView, the question is how do we introduce a fix. What we would like to do is to invoke dispose on the object stored in imgView before we stored the newly allocated image into the field. Unfortunately, we do not know what is the source of the Image stored in imgView, and in particular, whether this image is shared with other GUI components. In SWT, it is common for resources such as images, fonts, and colors
3. QVM Platform In this section we describe the QVM platform. First, we provide some background and design rationale, then we briefly describe the overall QVM architecture and its main components. Finally, in Section 3.3, we describe the QVM interface (QVMI). 3.1 Design Rationale: Modifying a VM Today’s production-grade virtual machines employ sophisticated techniques and optimizations to achieve maximal application performance. In contrast, there is little support for application correctness in a production environment besides checking low-level properties such as absence of null dereferences and array index bounds. While rich in functionality,
current debug and monitoring interfaces (e.g., JVMTI) are also not applicable as they incur a slowdown that is unacceptable in production mode. The goal of this work is to extend a production-grade virtual machine to provide software-quality services while maintaining competitive performance. We would like a solution to provide: (I) high performance and low overhead (II) maximal separation of analysis clients from the details of the underlying VM There is an apparent tension between requirement (I) and (II). We resolve this tension by providing a generic interface (QVMI) that manages functionality common to all analysis clients, but in addition, we allow clients to cut through abstraction layers and use other VM services when appropriate. However, our technique still requires VM modifications, and modifying a production-grade virtual machine is a nontrivial task. A virtual machine is a large, complex system. Moreover, implementing the quality services inside a specific VM makes them non-portable and ties users of the system to the specific VM version. In contrast, using pure bytecode instrumentation at the language level or a standard profiling interface such as JVMTI [29] is portable across virtual machines. Despite these disadvantages, there are a number of advantages in having at least part of an analysis reside within production VM, as we describe below. VM only information Having access to the runtime allows the client analyses to utilize information that is not readily available at the language level. For example, analyses can use free bits in object headers, directly examine the heap, quickly access structures like thread local storage, re-use existing VM code (such as garbage collection heap traversal logic) to perform a slightly different functionality. Analyses can utilize low-level profile data and infrastructure, such as hardware performance monitors (HPM) and fine-granularity timing (for example, see overhead monitor in Section 4). Performance Having access to the dynamic optimizer (JIT) ensures that the critical code paths are well optimized. The JIT can also use advanced optimization techniques for fast and slow paths (thin guards [5], code patching [37], full duplication [4], etc.). The system can also make use of profile data already collected by the VM to optimize and tune a dynamic analysis. Dynamic updating By using advanced techniques such as code patching and on-stack replacement (OSR) [20], VMs can support efficient dynamic updating of instrumentation during an application run. Deployment The deployment process becomes trivial because the required features become as ubiquitous as the VM.
Figure 5. Overall architecture of QVM. There is no need to “install” an analysis (recompile the program source to add instrumentation, etc) which is particularly difficult for large production application that might make heavy use of custom class loaders. Our analysis can be run by simply enabling a command line flag on the VM. In the next section, we provide an overview of the QVM architecture and show how we hide the complexity of the underlying VM from most analysis clients by using the generic QVMI interface. 3.2 QVM Architecture Fig. 5 shows the overall architecture of QVM. At a high level, the QVM extends the VM execution engine with three main components: 1. QVM Interface (QVMI): A performance-aware profiling/monitoring interface that allows client analyses to remain decoupled from the VM, while maintaining efficiency. The design goal of this component is to enable quick and easy development of powerful, yet efficient dynamic analyses. QVMI is described in Section 3.3. 2. Overhead Manager (OHM): The overhead control system enables users to bound the overhead incurred by QVM clients. The system does fine-grained monitoring of the time spent in the clients and adapts the sampling to stay near or below overhead bounds. OHM is described in Section 4. 3. QVM Clients: A flexible set of clients that leverage QVMI. In this paper we describe three example clients that enable checking of a variety of correctness properties with controlled overhead. Clients are discussed in Section 5. In this architecture, the overhead manager and the QVMI work together to provide clients with a transparent adaptive overhead management. The clients use QVMI without the
need to be aware of overhead management mechanisms (but with the ability to partially control it when desired). The OHM uses the information collected by QVMI to adjust the sample rate such that the overhead matches the desired overhead specified by the user. 3.3
QVMI: The QVM Interface
Various profiling interfaces such as JVMTI make it easy to write monitoring clients. The client specifies the events of interest, and these events are provided by the interface. Clients are kept separate from the internal VM implementation that collects the events. Similarly, although our profiling clients are packaged as part of the VM, keeping a clear abstraction interface between the core VM details and the profiling clients is important for software engineering reasons, for both maintenance and ease of adding additional clients in the future. The primary limitation with existing and general profiling interfaces is performance. For example the granularity at which events are requested is too coarse. With existing interfaces such as JVMTI, if a client wants to receive method callbacks for some subset of the method invocations, it must register to receive callbacks for all method invocations, and filter out the unnecessary callbacks on the client side of the interface. This introduces significant overhead that is completely unnecessary if the analysis needs only a subset of the methods. Filtering on the VM side To address this problem, the QVM interface is designed such that an efficient implementation is possible. The key difference from existing profiling interfaces is that it is structured with the goal of allowing as much filtering as possible to occur on the VM side of the interface. For example, if an analysis client needs method callbacks, it must specify what methods callbacks are necessary. This allows the remainder of the program to run at full speed. Similarly, the client may request method callbacks only for a subset of the objects in the program. The VM can use its suite of dynamic optimization techniques to achieve an efficient implementation of the sampled profile. Table 1 shows a partial list of the operations supported by QVMI. Clients that register with QVMI have to support a similar set of operations (as described below). In addition to the operations listed in Table 1, QVMI has similar callbacks for field read and writes, exceptions being thrown, and other events supported by standard interfaces such as JVMTI. In the table, we separate operations of different stages of the execution by double horizontal lines. The manner in which these operations are used is illustrated below. On VM initialization Upon startup of the virtual machine, the clients have to register themselves with QVMI to receive callbacks by calling registerClient. On method compilation During the compilation of a method, the VM queries the QVM agents to determine
whether the code being compiled needs any form of instrumentation. This insures that maximal filtering occurs; instrumentation is not inserted on any program statements if it is not required by at least one client. This querying is done by invoking QVMI operations such as isTrackedAlloc and isTrackedCallSite, which query all of the registered QVM clients to obtain a TrackLevel, which determines what level of instrumentation is needed. For example, for our typestate client, the compiler prompts QVMI to check whether allocation or method call sites in the code should be tracked. Further details on how the typestate client is implemented via QVMI is discussed in Section 6.2. During execution Depending on the tracking-level, the VM fires events for tracked sites by invoking operations such as allocEvent and invocationEvent. When an object is collected by the garbage collector, QVMI is notified by calling objectDeath.
3.4 Property-guided sampling One of the major features provided by QVMI is the ability to perform property-guided sampling. Sampling is a key mechanism QVM uses to reduce analysis overhead, but for many analyses using naive random sampling would render the analysis completely useless because the analysis relies on certain relationship between events. For example, if a dynamic analysis detects files that are opened but not closed, and tracking of method invocations were sampled randomly, QVM would report false positives any time file open was sampled, but file close was not. To address this problem, QVM performs property-guided sampling, ensuring that the sampled profile maintains sufficient properties to make the dynamic analysis meaningful. Object-centric sampling QVM supports a novel feature called object-centric sampling. This technique allows an analysis to sample at the object instance level; an object can be marked as tracked and the analysis can receive all profile events for this object, while receiving no events for untracked objects. This allows overhead reduction via sampling, without destroying the profile properties needed for the dynamic analysis to produce meaningful results. We refer to the points in the execution at which sampling decisions are made (ie, whether an object is tracked, whether an assertion is executed) as origins. Allocation sites are origins in our implementation of object-centric sampling. The decision of whether an object is tracked is made at allocation time; if sampled, a bit is set in the object header to mark the object as tracked. A short inlined code sequence checks this tracked bit on calls to QVM methods to determine whether a callback is needed.
Method void registerClient(Client c) TrackLevel isTrackedAlloc(AllocSite as) CallTrackLevel isTrackedCallSite(CallSite cs) boolean shouldExecute(Site s) void allocEvent(AllocSite as) void invocationEvent(CallSite as) void objectDeath(Object o)
Description Registers a client to receive callbacks should the specified allocation site be tracked should the specified call site be tracked should this site fire an event (based on sampling info) tracked allocation event tracked invocation event object death event
Table 1. A Partial list of the operations supported by QVMI. 3.5
Extensions
Our current interface is not intended to be complete, but is sufficient to cover a broad range of clients, including those included in this paper. The clients we currently implemented are built as part of the VM, but the interface could also be exposed to enable external clients. A full spec that could be published as a performance-aware alternate to the JVMTI is left for future work.
4. Overhead Manager Traditional dynamic analyses typically operate under the model that the user defines an analysis, then evaluates it to determine whether the overhead is acceptable. The instrumentation that is used to implement the analysis is fixed, and the overhead incurred is a function of the program that is executed. The QVM Overhead Manager, or OHM, reverses this mentality by allowing the user to specify an overhead that is considered acceptable for the current monitoring environment. The maximum acceptable overhead may be 5%-10% in a live deployed system, yet 100% overhead (factor of 2 slowdown) may be considered acceptable in a testing environment. Thus, the acceptable overhead is one of the inputs to QVM. Given an overhead budget, the QVM strives to collect as much useful information as possible from the executing program while staying within the specified budget. If the maximum overhead specified is too low, QVM may not report any useful information. This is obviously not the desired outcome, but in many cases it is more desirable than losing control of the overhead and having a performance crisis as a result. There are three components to the overhead manager, each of which are discussed in the sections that follow. 1. Monitoring: measures the overhead imposed by the QVM clients 2. Sampling strategy: a strategy for sampling each origin (e.g. allocation site or an assertion site) to ensure the system stays within the overhead budget 3. Controller: adjusts the sampling strategies for each origin based on the measured overhead
4.1 Monitoring The overhead monitor uses fine granularity timers on entry and exit to all QVMI calls to record the time spent in QVM clients and in the QVMI itself. The time is maintained separately for each origin (see Section 3.4) so that the sample rate of each origin can be adjusted independently. Timer accuracy The most important step in managing overhead is having the ability to measure overhead accurately. The overhead controller cannot be expected to make reasonable decisions if it is being given incorrect timing data as input. Measuring overhead for coarse grained events (such as garbage collection time) is relatively easy; a number of system timing routines can be used to obtain reasonable results. However, timing short, frequently executed regions is more difficult and requires having a timer that is both accurate and efficient. Using an inefficient timer mechanism has two serious problems: 1) it can cause significant overhead if called frequently (which can be the case with some QVM clients), and 2) the error can be significant when timing short regions and these timing errors will accumulate. To address these problems, our OHM implementation uses inline assembly to read the cycle counter using the Intel’s RDTSC (Read Time Stamp Counter) instruction. This mechanism results in very fast and accurate time stamping on entry and exit of the QVMI. Our initial implementation used the system call gettimeofday() and it created significant inaccuracies, as described in Section 7. Measuring total application time The timers measure time spent performing QVM tasks. To compute overhead relative to the non-QVM application, the OHM must also measure the total execution time. Using wall clock time, rather than process time, would be grossly incorrect for two reasons. First, interactive applications would create significant error because idle time would be counted as application time. Second, wall clock would be wrong for multi-threaded applications running on multi-processor machines. QVM time is measured and accumulated from all running threads, thus the total time must be the sum of the time spent executing on all processors.
For these reasons, we compute total time by using the getrusage() Linux system call to obtain the total time used by the JVM process. This solves the problems associated with using wall clock time discussed above and works well in practice for most applications. However, it is still not a fully robust solution when QVM activity is not evenly distributed across the application threads. For example, consider an application with 2 threads running for 1-second each in parallel on a 2-processor machine; getrusage() will report 2 seconds of total execution time. Assume that QVM was given a 10% overhand budget, which translates to 0.2 seconds allocated to QVM. If all of the QVM callback activity takes place in one of the two application threads, one thread will run for 1.2 seconds while the other runs for 1 second. Although the total CPU time is increased by 10% a user of the program would observe the program terminating after 1.2 seconds, a 20% increase. The most robust solution to this problem is to perform overhead tracking at the thread-level. If overhead budgets are tracked and enforced per-thread, total overhead as perceived by the user will always be within budget as well. A similar approach of using per-thread metrics has been employed by real time systems to track time spent performing system services [6]. We leave an implementation of this approach within QVM as part of future work. Base overhead Even when accurately measuring the time spent in the QVM clients, there are still two potential sources of errors: 1) checking overhead, and 2) indirect effects. The main sources of checking overhead is the inlined filtering. For example: • virtual method calls (or inlined method bodies) for meth-
ods relevant to QVM clients filter samples by checking a bit in the object header. • origin sites (i.e. allocation sites) check their sampling
strategy (described in Section 4.2) to decide whether the allocated object is tracked. These checks are short inlined code sequences and contribute very little to overall overhead (see Section 7); however, for very aggressive instrumentation, such as instrumenting all calls in the program, the base overhead can potentially become significant. Although not easy to measure online while the application is executing, base overhead can be estimated by observing the frequencies of the checks, and using a model of performance to estimate the overhead. Using a model is less desirable than direct measurement, but can still be used as a way of avoiding large performance surprises for aggressive clients. Our implementation does not yet perform this modeling to avoid large base overhead, and it is left as part of future work. The second source of base overhead is indirect effects on performance, such as cache pollution, or optimization in the JIT that are hindered by the presence of instrumenta-
tion. These sources of overhead are very difficult to measure without having two separate versions of the code and using techniques such as performance auditor [25] to identify the performance differences. 4.2 Sampling strategy The QVMI maintains separate overhead statistics for each origin (see Section 3.4), allowing the OHM to increase or decrease the sample rate independently for each origin. Having origin-specific sample rates enables significant advantages for the client analysis. Maintaining a single sample rate would be sufficient for managing total overhead, but would be likely to miss origins in infrequently executed code. With origin-specific sampling, the controller can reduce overhead by scaling back hot origin sites, but continues to exhaustively track objects from cold sites, thus allowing the client analysis to see a broader view of the program execution. As shown in Section 7, this sampling strategy results in increased error coverage for a given overhead budget. Our implementation achieves sampling by maintaining a sampleCounter and a sampleCounterReset for each origin. At runtime, the checking code at each origin site decrements and checks sampleCounter; if it is less than zero, the origin is selected to be tracked and the counter is reinitialized by the value in sampleCounterReset. The sampleCounterReset for each origin is adjusted by the Overhead Controller to change the sample frequency for that origin, thus reducing or increasing its overhead. Emergency shutdown Object-centric sampling is most effective for managing overhead when there are a large number of objects contributing to total overhead. If the majority of execution is dominated by method calls on a single, longlived object, tracking this object will result in large overhead. To avoid severe performance degradation when a hot, long lived object is tracked, the QVM supports the notion of an emergency shutdown. On each QVMI callback for allocations and invocations, the system checks a flag to determine whether an emergency shutdown is needed. If so, it disables the monitoring bit in the object header such that the object will no longer be sampled. The client analysis may now need to discard this object, as the method callbacks are not complete. However, this mechanism allows the system to ensure that overhead can be controlled. 4.3 Overhead Controller The job of the Overhead Controller is to periodically check the QVM overhead, and adjust the sampling frequencies accordingly. If the overhead is above the budget, sample frequencies are reduced; if the overhead is below budget, the frequencies are increased. To avoid oscillation and large spikes in overhead, the controller monitors not only total overhead, but recent overhead. Recent overhead is computed via exponential decay; a second copy of application time and QVM time are maintained,
and multiplied by a decay factor each time the controller wakes up. This gives more weight to recent timings, effectively measuring the overhead over a previous window of execution. The primary focus of the controller is keeping the overhead below the overhead budget. Maximizing the client executing time within that budget is also a goal, but it is secondary. Thus the controller reduces sample frequencies if either the total overhead or recent overhead exceed their budgets. If the overhead deviates too high above the budget, the controller enacts the emergency shutdown to stop profiling in the current set of objects, and starts tracking new objects once the overhead is within budget. Origin-specific adjustment The QVMI maintains separate overhead statistics for each origin (see Section 4.2), allowing the OHM to increase or decrease the sample rate independently for each origin. These origin-specific adjustments are made as follows. The controller decides on sample rates for each origin by maintaining a second overhead threshold, called originOverheadBudget. The sample rate of each origin is adapted to stay below this overhead budget. If the overhead for an origin is below originOverheadBudget, the sample rate is increase (or left alone if the origin is already exhaustively tracked). When the controller sees that total overhead is too high, it reduces the originOverheadBudget, thus effectively reducing the sample frequency only for origins that exceed this overhead threshold. The originOverheadBudget is always less than or equal to the total overhead budget, but may be significantly lower if there are a large number of origins. This approach is similar to [22] which uses inverse sampling to avoid missing memory leaks in cold code.
5. QVM Clients In this section, we describe three clients built on top of the QVM platform. We have implemented a number of clients in order to cover a range of user properties: ranging from local assertions to continuous monitoring using temporal safety properties. 5.1 Typestate In this section, we show how QVM is used to dynamically check typestate properties. Typestate [36] is a framework for specifying a class of temporal safety properties. Typestates can encode correct usage rules for many common libraries and application programming interfaces (APIs). For example, typestate can express the property that a Java program should dispose a native resource before its Java object becomes unreachable and is collected by the garbage collector.
* else initial
undisposed
dispose* | release*
disposed
object death
*
err
Figure 6. A typestate property tracking proper disposal of SWT resources. Names of tracked types are not shown. Dynamic checking of typestate properties, as well as generalized multiple-object typestate (also known as “first-order properties” [34, 38]), have been addressed before in Tracematches [3] and MOP [12]. We use the typestate client to demonstrate three contributions of our platform: (i) adaptive overhead management; (ii) timed typestate transitions; (iii) collection of additional detailed debug information with low overhead. Using the QVM platform to implement dynamic typestate checking also provides us with an advantage in getting object-death callbacks directly from the garbage collector and not relying on a finalizer method to be called. This guarantees that object-death events are fired in a timely manner (which is not guaranteed to happen when using finalizers) and allows us to measure resource-drag (see below) more precisely. QVM uses a simple input language to let the user specify a finite-state automaton that represents the typestate property, and the types to which it applies. We refer to a type that appears in at least one typestate property as a tracked type. Once the tracked type is specified, our implementation instruments every object of this tracked type with additional information that maps the object to its typestate. During execution, QVM updates the typestate of each tracked object, and when an object reaches its error state, QVM records an error report (as the one shown in Fig. 1) in a designated log file. E XAMPLE 5.1. Fig. 6 shows a typestate property (represented as a finite state automaton) that identifies when an SWT resource has not been disposed prior to its garbage collection, thus possibly leaking native resources such as GDI handles. The tracked types are not shown in the figure, as this property applies to a large number of types (e.g., org/eclipse/swt/widgets/Widget). Since all states other than the designated error state are accepting, we simplify notation by not using a special notation for accepting states. We label edges of the finite-state automaton with regular expressions that define when the transition is taken. For example, the transition from undisposed to disposed occurs when invoking a method whose name begins with dispose or release. We use else to denote a transition that is fired when no other transition from the state can be matched (note that the automaton is deterministic).
initial 1/1 1 : Image.(Device;InputStream;)V Image.(Device;InputStream;)V
2 : IR.loadImage(ClassLoader;...)Image 3 : IR.loadImage(Display;...)Image
1/1 1 : Image.init(Device;ImageData;)V Image.init(Device;ImageData;)V
2 : Image.(Device;InputStream;)V 3 : IR.loadImage(ClassLoader;...)Image;
1/1 1 : Image.createMask(ImageData;Z)I Image.createMask(ImageData;Z)I
2 : Image.init(Device;ImageData;)V 3 : Image.(Device;InputStream;)V
1/1 Image.isDisposed()Z 69 / 39 4 / 39
4 / 39 65 / 39 65 / 39
Image.getImageData()ImageData;
OD 65 / 52
Image.getBounds()Rectangle;
64 / 52 1 / 52
Image.createMask()V
1 : Image.getImageData()ImageData;
1 : Image.getBounds()Rectangle;
1 : Image.createMask()V
2 : BGT1.doPaint(Z)V 3 : BGT1.setGraphic(Image;)Z
2 : CLabel.getTotalSize(Image;...)Point; 3 : CLabel.computeSize(IIZ)Point;
2 : GC.drawImageMask(Image;...)V 3 : GC.drawImage(Image;...)V
Figure 7. An example typestate history for a leaking Image in Azureus. For brevity, we only show sample contexts and omit the context for isDisposed. In Section 7.1 we report experimental results for such properties. For every typestate property, QVM tracks the number of times it has been violated. When the number of violations passes a specified threshold, QVM starts recording additional debugging information in the form of a typestate history. As mentioned in Section 2, a typestate history of an object o is an abstraction of the sequence of method invocations performed during execution with o as a receiver. We use the name typestate history because we summarize the sequence of method invocations as an annotated DFA, similar to a typestate property. Intuitively, a state in the typestate history represents the state of the object after a specific method has been invoked on it. A state in the history is labeled with a set of (bounded) contexts — representing the contexts in which the method has been invoked. A transition between states m1 and m2 in the history represents the fact that the method corresponding to m2 has been invoked immediately after the method corresponding to m1 has been invoked. A typestate history therefore provides information about the way a single object that violates the property was used in the program. This helps the programmer to diagnose the cause of the reported violation. E XAMPLE 5.2. Fig. 7 shows an example typestate history produced by QVM. This provides an account of
the behavior of a single object that violates the property. In the figure, we have abbreviated the type name BufferedGraphicTableItem1 to BGT1, and the type name ImageRepository to IR. In figures of typestate histories we do not show method signatures on the edges because the label of an edge is always identical to the label of its target state. Unlike the simple typestate history of Fig. 2, the typestate history of Fig. 7 contains cycles and multiple invocations of methods. The label on a transition edge represents the number of times this transition occurred in the execution and the last time when it occurred. For example, the transition from the state in which createMask is the last method invoked on the object to the state in which isDisposed is the last method invoked on the object occurs 64 times in the execution summarized by the history of Fig. 7. The last time in which the transition occurred is 52, where time is measured as the number of allocations performed by the program. In the figures, we show the time counter divided by 1024. Resource Drag and Lag Since QVM tracks the last time each transition took place, it can be used to identify when a resource is not released in a timely manner (known as resource drag). In such cases it is sometimes possible to improve performance by releasing the resource earlier. Similarly, since QVM also tracks calls to constructors and objectdeath events, it can be used to identify when an object is al-
c a n v a s . a d d D i s p o s e L i s t e n e r ( new D i s p o s e L i s t e n e r ( ) { @Override public void widgetDisposed ( DisposeEvent arg0 ) { i f ( img ! = n u l l && ! img . i s D i s p o s e d ( ) ) { assert ( QVM.isObjectOwned ( img ) ) ; img . d i s p o s e ( ) ; } } });
Figure 8. Using QVM to check that an SWT resource is not shared before attempting to dispose it. located too early (memory lag) or kept reachable for a longer time than necessary (memory drag). Extensions Our current implementation supports singleobject typestate properties. In the future, we plan to investigate how our VM extensions can be combined with techniques for handling multiple object typestates such as Tracematches [3] and MOP [12]. In some cases, static analysis (e.g., [19, 10]) can be used to verify that a typestate property is never violated, or that some transitions of a typestate property never occur in a program. These static approaches can be used to reduce the runtime overhead by eliminating some of the dynamic checks. However, in practice, the static approaches usually do not scale to the systems targeted by QVM. 5.2
Local Assertions
To allow adjustment of overhead, we allow Java assertions to be sampled. This means that during execution, we may sometime choose not to evaluate an assertion.
E XAMPLE 5.3. Disposal of SWT resources is based on two principles: (i) the object which allocated the resource is responsible for its disposal; (ii) disposing a parent object disposes its children. These principles work well for many cases as a large number of the allocated resources are set to form immutable containment tree that guarantees proper (albeit not timely) disposal. However, the treatment of shared resources such as Color, Fonts, and Images, is more complicated and error prone. For shared resources, finding the proper disposal point in the program may be rather challenging. In particular, the disposal may be based on programmer knowledge of the last use of the shared resource in the application. Fig. 8 shows how a QVM assertion can be used to check that a resource is not shared by others, before it is being disposed. The code fragment shown here corresponds to a common idiom for disposing a resource by a dispose listener. This particular code fragment is taken from a fix we introduced for the Azureus benchmark as described in Section 7.1. 5.3.1 Discussion and Extensions When assertions are not sampled, our approach is also applicable for reducing verification efforts by adding runtime checks of heap properties. For example, establishing that parts of the heap are disjoint may allow us to employ more efficient verification techniques that abstract each part separately. The heap operations supported by QVM could be extended to provide a comprehensive runtime support for ownership (e.g., the release and capture operations of [32]).
5.3 Heap Probes
6. Implementation
QVM enables the dynamic checking of various global heap properties such as object-sharing, heap-ownership, threadownership and reachability. These properties are useful for both debugging and program understanding purposes. QVM provides a library that exports a set of methods, one for each heap property. We refer to these library methods as heap probes. The programmer can invoke heap probes from her program in order to inspect the shape of the heap at a program point. The library uses various components of the underlying runtime in order to obtain an answer. Our list of currently supported probes is shown in Table 2. In the table, We use T C(o) to denote the set of all objects that are transitively reachable from o. Technically, o can refer to either an object or a thread. Similarly to non-heap probes, our heap-probes can be sampled by the overhead manager to allow adjustment of overhead, and can therefore evaluate to one of three possible values: true, false, and unknown. The return value of a heapprobe can be used in a standard Java assertion. When a heap probe is used inside an assertion we refer to it as a heap assertion.
In this section we provide the implementation details of object-centric sampling, as well as QVM clients of Section 5. 6.1 Object-Centric Sampling There are two key components to the efficient implementation of object-centric sampling. First is the ability to obtain a single free bit in the object header, to enable efficient checking of whether an object is tracked. Once identified as a tracked object, QVM clients need the ability to associate analysis data with an object. We implemented this in QVM by creating an O BJECT I NFO for every tracked object. This ObjectInfo is then passed to the client on all object-related callbacks so the client can lookup or store data associated with the object (such as DFA state, etc). The mapping from object to ObjectInfo is performed via a hashtable lookup. On allocation of an object, the corresponding ObjectInfo is created and inserted into the hashtable; on object death, they are removed. QVMI callbacks that require access to the ObjectInfo obtain it by doing a hash lookup.
Probe Name isHeap(Object o) isShared(Object o) isObjectOwned(Object o1 , Object o2 ) isObjectOwned(Object o) isThreadOwned(Thread ta , Object o) isThreadOwned(Object o) isUniqueOwner(Object root) isReachable(Object src, Object dst)
Description Returns true if object o is pointed to by a heap object, false otherwise Returns true if object o is pointed to by two or more heap objects, false otherwise Returns true if o1 dominates o2 , false otherwise Returns true if the object pointed to by this dominates o, false otherwise Returns true if ta dominates o, false otherwise Returns true if the current thread dominates o, false otherwise Returns true if root dominates all objects in T C(root), false otherwise Returns true if object dst is reachable from object src, false otherwise
Table 2. QVM heap probes. We use T C(o) to denote the set of all objects that are transitively reachable from o.
An alternate implementation would be to reserve a word in the object header to point to the object’s ObjectInfo. While this provides faster lookup, it is not necessarily the superior design because it reduces locality by increasing object size, and this overhead is regardless of the sample rate. A hashtable lookup is significantly slower, but the hashtable lookup is performed only for sampled objects; the inlined fast path only checks the tracked bit in the object header. So although the hashtable implementation is slower for tracked objects, it allows a lower base overhead that converged upon when the sample rate is reduced. Because the goal of QVM is to target low-overhead scenarios, the hashtable design was chosen. 6.2
Typestate Client
Upon VM startup, the typestate module loads all of the user supplied properties, parses and stores that information in its own internal data structures. The typestate module then registers itself with the runtime via the QVMI.registerClient call. On method compilation, the QVMI interface is called by the JIT via the isTrackedAlloc and isTrackedCallSite functions to determine whether instrumentation is needed for allocations and calls. These functions return a value of type TrackLevel. This type can take on one of three totally ordered values: NEVER (the minimal value), SOMETIMES and ALWAYS (the maximal value). All of the registered QVM clients are queried and the return result is computed by taking the maximal value from all of the client responses to ensure that sufficient instrumentation is inserted. QVM then adjusts the instrumentation based on the tracking level. If the tracking-level is ALWAYS or SOMETIMES, QVM instruments the code with a callback to report the event that occurred. In the case of SOMETIMES, QVM inserts inlined logic to decide (during execution) whether the callback gets invoked, If the tracking-level is NEVER, no code instrumentation is performed by QVM for the site. For allocations sites marked with track level SOME TIMES , the inlined sampling logic consults the sampling strategy for that origin (see Section 4.2). If selected for sampling, the typestate allocation handler is called via the QVMI allocEvent call. The handler creates its internal QVM
tracking structure for the allocated object, and marks the object as tracked by setting a bit in the object header. Note that there could be multiple tracking structures per-object (e.g. the object is part of multiple typestate properties). For method invocations tagged with SOMETIMES, the inlined code sequence checks whether the receiver is a tracked object by checking the tracked bit in the header. This check is executed even for inlined methods to ensure that callbacks are not optimized away by the JIT. If the object’s tracked bit is set, QVMI’s invocationEvent is invoked which then calls the typestate invocation handler. The handler is passed the receiver object, that object’s O BJECT I NFO, and the method that was invoked. This handler updates the tracking structure for each DFA the object participates in. In our implementation for typestate, we have used the object-centric tracking and sampling capabilities provided by QVMI (Section 3.4) and have inlined check of whether the object is tracked. This keeps overhead low by ensuring that QVMI is invoked only for tracked (sampled) objects. There are many other such property specific optimizations that can be made. For example, if we know that the tracked object is in an error state that will not be exited, QVM does not need to invoke any other callbacks on this object. On Object Death We have instrumented the garbage collector to provide precise death events. Whenever an object is detected to be unreachable during the sweep phase of the collector, the collector calls the QVMI’s objectDeath function. That function leads to calling the typestate module’s handler for death events, where all object tracking information is freed (if the object is tracked), ensuring no memory leakage. If the object is found to be in a nonaccepting state, an error is reported. 6.2.1 Collecting Typestate Histories In typestate histories, we use a notion of “time” to record when events occurred. We measure the time as the number of allocations performed by the program. To provide a scalable and efficient implementation of global clock, each thread maintains a local allocation counter, and these are aggregated to a single global (approximate) time every 10 millisec. The precision of the aggregate global clock can be adjusted by the user by changing the frequency of aggrega-
tion operations (at the cost of a performance hit when using higher frequency). 6.2.2
Discussion
Although the typestate module is written as part of the VM, it is completely isolated from the VM via the QVMI interface; this interface can be used to easily write clients to check properties other than typestate. By having access to an unused bit in the object header bits, QVM is able to efficiently perform object-centric sampling without needing to store additional words in the object. Moreover, the ability to precisely intercept object death events frees us from having to rely on technique such as finalizers and weak references. 6.3 Heap Probes In our platform, the underlying memory subsystem already provides a stop the world mark and sweep, parallel garbage collector, where the number of parallel marker threads is parameterized by the number of cores in the system. This memory system is highly tuned for performance and provides rich synchronization functionality for controlling the application and collector threads. Interestingly, such a setup, although complex, contains many of the basic components necessary to perform our probe evaluation. Hence, we implement our heap probes by re-using and adjusting at key places much of this existing machinery. Next we describe in more detail our heap probe evaluation system. Operation On system startup, a set of evaluation threads Tm is created by the virtual machine, where |Tm | is the number of cores. After creation, each thread tm ∈ Tm immediately blocks. Upon probe invocation, the system unblocks all evaluation threads and each tm starts executing the probe in question. At the abstract level, the basic existing graph traversal components are shown in Fig. 9. Each component is parameterized by the evaluator thread tm . The function trace() performs the transitive closure from the set tm.pending. The only addition we made to the standard parallel tracing phase is the callback trace-step, which is fired whenever a new reference is encountered. Each probe is free to specialize this function. The set Ta denotes the set of application threads ta in the system at the time a probe is invoked. The function mark-thread() processes the contents of each application thread stack but does not trace from it. The function mark-object() marks the object if it is not already marked atomically. If it is not marked, it stores the children of the object in the pending set of each evaluator thread. Since this is a local operation, it is done without synchronization. The function barrier() essentially waits for all evaluation threads tm to reach it and then releases them. To avoid clutter, we assume that all sets are initialized to ∅ before invoking the probe. Probe is-shared Fig. 10 shows how the components of a parallel garbage collector are used to implement the probe is-shared() for a tracked object trackedo . For this probe,
trace(tm ) while (tm .pending 6= ∅) remove s from tm .pending for each o ∈ {v | (s, v) ∈ E} trace-step(s, o) mark-object(tm , o) mark-object(tm , o) atomic if (o 6∈ Marked) M arked ← M arked ∪ {o} else return tm .pending ← tm .pending ∪ {o} mark-thread(tm , ta ) for each o ∈ roots(ta ) mark-object(tm , o) mark-threads(tm , T ) for each ta ∈ T mark-thread(tm , ta )
Figure 9. Basic Components is-shared(tm , trackedo ) tm .sources = ∅ mark-threads(tm , Ta ) trace(tm ) lock(allsources) allsources ← allsources ∪ tm .sources result ← |allsources| > 1 unlock(allsources) barrier() trace-step(s, t) if (trackedo = t) tm .sources = tm .sources ∪ {s}
Figure 10. Shared from heap a special case needs to be addressed in order to compute a sound result of the probe when heap traversal is done in parallel (such a case does not exist in the sequential traversal). The special case is the following: it is possible that with parallel evaluator threads, two or more parallel evaluators tm reach object o only once. In that case, we need to make sure to combine the results of all of the evaluator threads. Note that in the case where a single evaluator reaches two or more source objects pointing to o, the probe will return true without needing to inspect what other threads have reached. One solution is to synchronize the evaluator threads on every trace-step() (e.g. by using a compare-and-swap instruction for example). However, on many processor architectures this would have a negative effect on performance. To avoid this, each parallel thread records the set of sources
pointing to o that it encounters in trace-step(). Note that this is a local operation and requires no synchronization. Upon termination of its tracing phase each tm updates a global set allsources under a lock. If there is more than one object in that shared set, we return true, otherwise we return false. For clarity of presentation we have omitted some implementation details from the figures. For example, in the implementation, both local and global (i.e. allsources) sets of sources are of size two and we stop recording sources once that size is reached for the local set in trace-step(). Next, before agreeing on a global value of result and returning, the threads again synchronize via a call to barrier(). We have also omitted key portions of the runtime system such as load-balancing, a key technique in parallel collectors. Such techniques are completely orthogonal to our implementation and can be added without affecting the code for the probe evaluation. 6.3.1 Optimizations We are currently working on various optimizations to our system including evaluating multiple probes in parallel, concurrent evaluation of probes and heuristic optimizations via write barriers with techniques similar to those described in [33]. Such an optimized implementation of heap probes and its evaluation remains a topic of future work.
7.
Experimental Evaluation
In this section we experimentally evaluate QVM. 7.1 Typestate Monitoring 7.1.1
Methodology
In our experiments we focused on typestate properties that correspond to resource leaks. We monitor leaks of SWT resources and of IO streams. In these experiments the goal was to see if we can detect typestate violations that occur over an extended period of time. It is likely that massive leaks would have been detected and fixed in the testing phase, and therefore what we expect to find in these experiments is mostly a small number of leaks that accumulate over time. For that purpose, we used a range of applications on a regular basis to perform our daily tasks. Some of the applications considered are an instantmessenger (goim), newsfeed readers (feednread, rssowl), file management utilities (virgoftp, jcommander), large IBM internal applications, etc. For all of these applications our strategy was to simply run them over QVM and record the reported errors. In some of our experiments we investigated each report manually, diagnosed the causes of the errors, and implement fixes. This was an important exercise for evaluating and refining the debug information we collect (e.g., the typestate history).
Application azureus etrader feednread goim ibm app 1 ibm app 2 jcommander juploader nomadpim rssowl tvbrowser tvla virgoftp Total
SWT Resources 11 17 1 3 0 3 9 0 2 8 0 0 6 60
IOStreams 0 0 7 0 0 2 0 1 0 3 5 4 0 22
High Frequency 4 2 0 1 0 0 0 0 0 0 0 0 0 7
Fixed 5 0 0 3 0 0 0 0 0 0 0 0 6 14
Table 3. Sources of typestate violations in our application For every application, we indicate the number of sources that are executed in a high-frequency (corresponding to critical leaks). 7.1.2 Applications and Results Table 3 summarizes the number of sources of typestate violations found in our applications. Rather than counting the number of objects that violate the property, we count the allocation sites in which such objects were allocated. This is a more objective measure of the number of bugs in the program than the number of objects exhibiting the violation which usually depends on the duration of program execution. In order to measure the significance of a violation, we record whether it occurs frequently in the program execution. In some of our experiments we took the effort to investigate the errors and come up with appropriate fixes. Column fixed in the table reports the number of fixes we have introduced and tested. Azureus Azureus [8] is a Java implementation of the BitTorrent protocol. It supports several modes of user interaction, all implemented using SWT. Azureus is the #1 downloaded Java program from SourceForge, and has more than 160 million downloads to date. Using QVM we were able to detect 11 sources of resource leaks in this application. We fixed 5 of these and reported them to the Azureus development team. The reports were confirmed by the development team, and the fixes were incorporated into the codebase. At least 4 of the reports correspond to leaks that were occurring rather frequently. One particularly high-frequency case was a method Utils.getFontHeightFromPX(...) that was allocating a Font object in order to compute font height and was not properly disposing the Font object upon its return. This method is frequently called and resulted with thousands of leaking fonts even for short executions. This method was very likely created by copying another method in the class that has similar functionality but returns the Font object. Among our other fixes, we fixed the frequently leaking method getFontHeightFromPX(...) and our fix was incorporated into the Azureus codebase.
Another fix in Azureus required the addition of a dispose listener that properly disposes of an Image object. This leak was not very frequent, but it would leak an image whenever a certain panel would be displayed (image is created in the VivaldiPanel.refreshContacts(...) method). Eclipse Trader eclipseTrader is an SWT application that provides a framework for building an online stock trading system. eclipseTrader uses a frequently-updating UI to present streams of stock information, and as a result may be particulary sensitive to resource leaks. Using QVM, we detected 17 sources of resource leaks. Our count of violation sources represents a lower bound on the number of places that have to be modified for introducing a fix. This is in part due to the fact that we are counting the number of allocation sites and not the allocation sites in context. When a common method (such as a factory method) is used to create objects that violate a property in many contexts, we only count this as a single violation. Specifically, for eclipseTrader, there are several allocation sites that are used in different contexts. For example, the method Settings.getColor(Color) returns a new Color object, and is used in a large number of contexts that fail to properly dispose the color. We count this method as a single violation source that occurs with high frequency (there are tens of thousands leaking objects that are allocated in this method in a typical execution of eclipsetrader). In general, counting the number of violation sources has to be done carefully as the sources are not necessarily independent. For example. a whole sub-tree of components may leak due to a single missing dispose operation on the parent of the tree. Feed’N Read feednread is an open source newsfeed reader. In this news reader, the SWT resources are mostly properly managed. There are some resources that are not disposed before the program exits, but these are resources that are supposed to be live throughout program execution by design. Although QVM reports these as violations, we do not count them here as violation sources because this seems to be acceptable treatment of such resources (resources will be returned to the OS anyway when the application terminates). feednread seems to have some minor problems in properly closing IO streams when managing archived feeds. GOIM GOIM [1] is an Instant Messaging client based on the open source Jabber/XMPP protocol. We used GOIM running on QVM to communicate between team members for a few days. Over the course of our evaluation, we detected 3 sources of leaks and introduced fixes to all of them. We tested our fixed version of GOIM and confirmed that all previously reported leaks have been resolved. The fixes we introduced in GOIM were rather involved as we had to add new disposal code in places where no such code existed. Our fixes therefore involved introducing new
dispose methods as well as making sure that calls to these methods are propagated properly. IBM Applications We used QVM to run a development version of a large scale IBM product on a daily basis for a period of a few weeks. For this application, no problems were reported by QVM. This is not surprising as the development team is putting a lot of emphasis on preventing the kind of leaks we are tracking. We used QVM to run a development version of another smaller IBM tool that makes heavy use of SWT. For this application, we found 5 source of violations. The leaks are associated with user actions like opening a new file. JCommander JCommander is a multi-platform file manager. For this application we found 9 sources of violations. JUploader JUploader is a small application that uploads images to Flickr. Its UI is very basic and only involves a few SWT resources. For this application we found a single source of leaks causing the rather frequent leak of EventOutputStream objects. Nomad PIM Nomad PIM is a personal information manager. It has a rather involved SWT interface. For nomad we found 2 sources of violations. RSS Owl RSSOwl is an RSS newsreader. Running RSSOwl on QVM, we find 8 sources of SWT leaks and 3 sources of IO Streams leaks. TV Browser TV Browser is na electronic program guide. For this application we found 5 sources of leaking streams. TVLA TVLA [26] is a parametric program analysis framework. Running TVLA with QVM we find two input streams that are not closed by the parser processing input files, and two streams that are not closed when producing the analysis output. These are very low frequency leaks that only create one leaking object per execution of the analysis engine. VirgoFtp VirgoFTP is a multi-platform, graphical FTP client written in Java using SWT. For this application QVM reported 6 sources of leaks. We introduced fixes to all of these leaks, and tested that the fixed version resolves them. One source of a low-frequency leak in VirgoFTP is a typical pattern that repeats across many SWT applications. Changing the color/font preferences in an application often causes the leak of the previous colors/fonts used. These kind of leaks occur in such a low frequency that programmers are very likely choosing to ignore disposal of resources in this case. Fixing this simple problem in VirgoFTP was rather complicated because the code was completely non-prepared for handling these leaks. In order to fix these leaks we had to employ a rather significant refactoring of the code.
7.1.3
Overhead Evaluation
Methodology For overhead measurements we use the SPECjvm98 and Dacapo benchmark suites.1 The benchmarks were configured to run for roughly one minute to create a reasonable usage scenario, and total time was measured. 20 runs of each benchmark were used to reduce noise. We created a set of representative typestate properties that incur a significant overhead. We instrumented classes such as Java Collections, Enumerations, Vectors, and Streams. Results Figure 11 reports the overhead of the typestate monitoring client when applied to our benchmarks suite with a range of overhead budgets (5%, 10%, and 20%). The rightmost bar for each benchmark shows the overhead when the typestate client is applied exhaustively, ie, without sampling. The leftmost bar shows the base overhead (as described in which represents the base checking overhead that is incurred when no sampling takes place (see Section 4.1). The overhead incurred when checking these typestate properties exhaustively is high (up to 10x slowdown, with 7 of the benchmarks over 2x slowdown). Heavyweight properties that introduce frequent callbacks were selected intentionally to allow us to evaluate the effectiveness of the sampling infrastructure. The base overhead (leftmost bar) is low, at most 2.5%. Having the base overhead be low is critical, as this is the overhead that is the lowest overhead that can be achieved when sampling is disabled. The middle three bars show overhead incurred when QVM was run with a specific overhead budget. Although there is some fluctuation in the overhead achieved, it is generally quite close to the requested budget. Achieving accuracy at this level is quite challenging because the whole process takes place online and within a single execution of the benchmark. These results demonstrate not only the overhead monitor’s ability to measure the overhead introduced, but the overhead controller’s ability to keep the overhead close to the desired budget. Figure 12 shows an example of the overhead manager adapting the overhead of the typestate client online for the javac benchmark and a 10% overhead budget. The xaxis shows time in seconds, and the y-axis shows percent overhead, as measured online by the QVM overhead monitor. The spike around 0.5 seconds occurs because there is some lag before the overhead monitor can react and reduce the sample rates. However, once the controller throttles the tagged objects at the hot allocation sites the overhead converges on the desired budget of 10%. The goal of QVM is not just to have low overhead, but to collect as much useful information as possible within the overhead budget. The sampling strategy employed by the overhead manager (see Section 4.2) strives to distribute the 1 Jython
and xalan were excluded from the study because they do not run properly on the developmental version of the VM used for this work (independent of the QVM modifications).
Figure 12. Overhead over time
Figure 13. Allocation Site Coverage: Percentage of allocation sites (of tracked types) that allocate at least one tracked object. samples across the allocation sites in the program, to help find bugs that may occur in cold code. Figure 13 compares the coverage of allocations sites achieved with 5% budget when using origin-specific sampling, as well as global sampling, where all sites are sampled equally. Origin-specific sampling enables nearly 100% coverage for all benchmarks, while global sampling misses a significant percentage of the allocation sites for at least half of the benchmarks. QVM is using sampling to reduce overhead so there is no expectation that all objects will be tracked, however in many cases the sampling mechanism allows the dynamic number of tracked objects to be significantly higher than one might anticipate. Table 4 reports the percent of objects allocated (of the tracked types) that are sampled to be tracked by the typestate monitor. Consider the program javac. Previously in Figure 11 we saw that our example set of typestate properties introduces
Figure 11. Overhead with budget
Benchmark db mpegaudio jess jack javac compress mtrt antlr eclipse luindex hsqldb chart fop bloat pmd
1% 100 98 63 22 0.4 100 39 13 4 5 7 40 47 100 81
2% 100 100 76 37 1 100 46 19 7 51 13 64 70 100 99
Overhead Budget 5% 10% 20% 100 100 100 100 100 100 85 87 95 45 52 71 4 9 31 100 100 100 66 83 90 34 68 67 12 28 44 79 97 99 16 30 43 85 88 93 42 66 100 100 100 100 99 99 99
50% 100 100 100 100 41 100 93 92 66 99 31 94 100 100 100
100% 100 100 100 100 49 100 94 98 67 100 75 97 100 100 100
Table 4. Object Coverage: Percent of allocated objects (of tracked types) that are selected by QVM for typestate monitoring.
overhead of around 970% when checked exhaustively. However, Table 4 shows that with an overhead budget of 100% slowdown (more than a factor of 9 less than the exhaustive slowdown) 49% of the objects allocated (of tracked types) were still selected for tracking. This can be explained when a relatively small number of objects contribute significantly to the overhead; once sampling at these sites is throttled, the number of remaining allocations that can be tracked within the overhead budget may be large. Some benchmarks (db, compress, bloat) report 100% for all overhead budgets because their exhaustive overhead for the typestate properties we selected is below 1% (see Figure 11).
7.1.4 Discussion Wrapper Streams For a large number of applications QVM reports violations of stream types that do not hold real resources but violate the contract of the InputStream and OutputStream API specification. An example that is widely reported by QVM is the LEDataInputStream from the package swt.internal.image. This stream is a wrapper around an InputStream and is often not closed because closing the wrapper closes the underlying InputStream. In many cases, the underlying stream outlives the wrapper stream and is therefore closed directly without ever invoking close() on the wrapper stream. In addition, streams such as ByteArrayInputStream and ByteArrayOutputStream are simply wrappers around a byte array. Invoking close on such streams has no effect (although it is required by the streams API in principle), and programmers therefore avoid this redundant method call. We do not consider these to be real violations and do not include them in our QVM reports.
Library Objects vs. Application Objects Our initial specification for SWT resources was not the one shown in Fig. 6. Our initial specification required that dispose() be invoked on every SWT Widget, as this is the public method that an application code can invoke to dispose a resource. However, in SWT, widgets are arranged into an ownership structure in which a widget may have a parent that is responsible for its disposal. When the parent is disposed, it disposes all of its children, but instead of invoking the (public) method dispose to do so, it directly calls the (protected) internal method release. We therefore had to refine our specification to be aware of the internal library implementa-
tion and the fact that an SWT widget could be also released by an invocation of release that originates in library code. Additional refinement of the specification is required to avoid objects that are allocated in the library for internal library use, and their lifetime is not managed (and should not be managed) by the application. For example, Font objects allocated by the static method Font.gtk new() are managed by the library. 7.2 Assertions and Heap Probes Evaluating local assertions and heap probes on realistic benchmarks is a nontrivial task, as it requires that we devise meaningful assertions for each benchmark. Currently, we evaluated assertions and heap probes on a number of synthetic benchmarks and demonstrated that the overhead manager works as expected for these benchmarks. Since these are synthetic benchmarks, the measured numbers are rather arbitrary and we therefore do not report them here. We have also evaluated heap probes in a single benchmark — SPECJbb2005. For this benchmark, heap probes were inserted on fairly frequently executed instructions, thus when run exhaustively caused significant slowdowns (on the order of 100x). However, when running the system with an overhead budget of 10%, the overhead manager successfully achieved an overhead of 10.5% by sampling the heap probes. Furthermore, with 10% overhead, QVM provided 100% coverage of the probe sites.
8. Related Work Aspects and Monitoring Dynamic tools such as Tracematches [3], and MOP [12] are able to detect violation of typestate properties, and in particular detect resource leaks. For example, in [12], JavaMOP was used to successfully detect a number of resource leaks in Eclipse. These tools extend aspect-oriented programming with the ability to specify declarative patterns against the history of the program, rather than against single events as in traditional aspects. Optimizing the performance of code generated from these declarative specifications is a challenging task and is currently an active area of research. In [7], the authors concentrate on dynamic optimizations that only consider the specified declarative pattern and not the program on which it is applied. Such optimizations include avoidance of memory leaks and better representation of the typestate automata. Alternatively, in [10], the authors take the program into account and perform static optimizations, e.g., removing unnecessary instrumentation points from the program. Unfortunately, despite these optimizations, there are cases where the overhead is still unacceptable for some properties. In [9], the authors propose two techniques: spatial and temporal partitioning. In the first optimization, assuming multiple users of the application, the instrumentation points are partitioned into sets optimizing the per-user overhead. However, it is still possible to partition the points in a way that some set has a hot
point. The second optimization spawns a monitoring thread which can switch the instrumentation on and off at various times. The intervals defining when the point should be on or off are predetermined off-line and given to the thread as parameter. It seems that our approach of automatically adjusting the overhead online for a particular set of control sites will be beneficial to the second optimization. Sampling for Scalable Monitoring Previous work has focused on low overhead techniques for sampling instrumentation [4] and collecting such profiles in bursts [14]. However these techniques turn sampling on and off based on time or code execution frequency, and do not support a technique such as our object-centric sampling. In the cooperative bug isolation (CBI) project [27], the overhead of monitoring program execution is mitigated by using sparse random sampling and collecting information from a large number of users exercising the code. Collaborative techniques could be combined into QVM to collect application errors from a wider group of users. We believe that the ubiquity of QVM provides a natural channel for wider adoption of CBI-based techniques. Typestate Verification and Static Leak Detection A number of sound static tools target detection or prevention of memory and resource leaks [23, 15, 16, 21, 19, 35]. Some tools specifically target detection of SWT resource leaks [28], and others target automatic generation of resource management code [17]. In principle, most of these approaches are capable of detecting cases where an object is leaked or double disposed. In practice, however, these approaches do not scale to industrial-sized applications, and produce a large percentage of false alarms. In addition, some of these approaches either require additional (potentially cumbersome) annotations or restrict the class of programs that may be written, e.g. by restricting aliasing [15, 21]. Heap Properties Mitchell [30] provides concise and informative summaries of real world heap graphs arising in production applications. The summaries are done offline and follow a set of useful heuristical patterns for summarizing graphs. In contrast, our goal is to check various user specified heap properties online. Subsequent work by Mitchell and Sevitsky [31] study offline heap snapshots with the goal of finding inefficiencies in memory usage enforced by a particular program design. Chilimbi et. al. [13] provide a two-stage framework suitable for testing, where in the first stage a set of likely heap invariants based on node degree are computed at a small number of program points. Then the instrumented program is executed and checked against these invariants and a bug is reported if a deviation is observed. Various works have relied on the garbage collector to find memory leaks. Jump et al. [24] use the collector to help in suggesting potential leaks. Bond et al. [11] studies efficient leak detection for Java. Similarly to us, they make use of
available bits in the object header and the adaptive profiling techniques from [22] applied on object use sites, in order to reduce the space and time overheads. We see these advances as potential QVM clients, which could manage the overall overhead for them. In a recent paper by Aftandilian et al. [2], the authors suggest the idea of piggybacking on an existing garbage collector in order to check various heap properties. They propose two of the assertions we consider here, namely isShared and isObjectOwned, but have not implemented these assertions and hence have not had the chance to study the wide class of applications we have in order to see where and how the assertions are practically used.
Spain, June 2002), B. Magnusson, Ed., vol. 2374 of Lecture Notes in Computer Science, pp. 498–524. [6] AUERBACH , J., BACON , D., C HENG , P., G ROVE , D., B IRON , B., G RACIE , C., M C C LOSKEY, B., M ICIC , A., AND S CIAMPACONE , R. Tax-and-Spend: Democratic Scheduling for Real-time Garbage Collection. In Proceedings of the International Conference on Embedded Software (New York, NY, USA, 2008), ACM. [7] AVGUSTINOV, P., T IBBLE , J., AND DE M OOR , O. Making trace monitors feasible. In OOPSLA ’07: Proceedings of the 22nd annual ACM SIGPLAN conference on Object oriented programming systems and applications (2007), ACM, pp. 589–608. [8] Azureus - Java BitTorrent client. http://azureus.sourceforge.net/.
9. Future Work The overhead manager stands at the basis of QVM. Our current implementation uses simple strategies that work well in practice, but do not guarantee any sort of optimality or enforce provable bounds. In the future, we plan to investigate how techniques from control theory can be used to provide a robust theoretical foundation for the overhead manager. While our preliminary experience with heap assertions is promising, a thorough evaluation of these assertions is required on two aspects: (i) the appeal of heap assertions to programmers; (ii) the performance impact of heap assertions written in practice. We plan to address these questions in future work.
10. Acknowledgments
´ , O., [9] B ODDEN , E., H ENDREN , L. J., L AM , P., L HOT AK AND NAEEM , N. A. Collaborative runtime verification with tracematches. In 7th International Workshop on Runtime Verification (RV) (2007), vol. 4839 of Lecture Notes in Computer Science, pp. 9–21. ´ , O. A [10] B ODDEN , E., H ENDREN , L. J., AND L HOT AK staged static program analysis to improve the performance of runtime monitoring. In ECOOP (2007), pp. 525–549. [11] B OND , M. D., AND M C K INLEY, K. S. Bell: bit-encoding online memory leak detection. SIGOPS Oper. Syst. Rev. 40, 5 (2006), 61–72. [12] C HEN , F., AND ROS¸ U , G. MOP: An Efficient and Generic Runtime Verification Framework. In ObjectOriented Programming, Systems, Languages and Applications(OOPSLA’07) (2007).
We would like to thank Joshua Auerbach for his helpful discussions on tracking overhead using per-thread metrics.
[13] C HILIMBI , T. M., AND G ANAPATHY, V. Heapmd: identifying heap-based bugs using anomaly detection. vol. 34, ACM, pp. 219–228.
References
[14] C HILIMBI , T. M., AND H IRZEL , M. Dynamic hot data stream prefetching for general-purpose programs. In PLDI ’02: Proceedings of the ACM SIGPLAN 2002 Conference on Programming language design and implementation (New York, NY, USA, 2002), ACM, pp. 199–209.
[1] GOIM: Gamers own instant messenger. http://goim.us/wiki/show/GOIM.
available at
[2] A FTANDILIAN , E., AND G UYER , S. Z. GC assertions: Using the garbage collector to check heap properties. In MSPC (2008), ACM. [3] A LLAN , C., AVGUSTINOV, P., C HRISTENSEN , A. S., ´ , O., DE M OOR , O., H ENDREN , L., K UZINS , S., L HOT AK S ERENI , D., S ITTAMPALAM , G., AND T IBBLE , J. Adding trace matching with free variables to aspectj. In OOPSLA ’05: Proceedings of the 20th annual ACM SIGPLAN conference on Object oriented programming, systems, languages, and applications (2005), ACM, pp. 345–364. [4] A RNOLD , M., AND RYDER , B. G. A framework for reducing the cost of instrumented code. In PLDI ’01: Proceedings of the ACM SIGPLAN 2001 conference on Programming language design and implementation (New York, NY, USA, 2001), ACM, pp. 168–179. [5] A RNOLD , M., AND RYDER , B. G. Thin guards: A simple and effective technique for reducing the penalty of dynamic class loading. In Proceedings of the Sixteenth European Conference on Object-Oriented Programming (M´alaga,
[15] D E L INE , R., AND FAHNDRICH , M. Enforcing high-level protocols in low-level software. In PLDI ’01: Proceedings of the ACM SIGPLAN 2001 conference on Programming language design and implementation (New York, NY, USA, 2001), ACM Press, pp. 59–69. ¨ [16] D E L INE , R., AND F AHNDRICH , M. Adoption and focus: Practical linear types for imperative programming. pp. 13–24. [17] D ILLIG , I., D ILLIG , T., YAHAV, E., AND C HANDRA , S. The closer: Automating resource management in java. In ISMM (2008). [18] E CLIPSE. Standard widget toolkit (swt). http://www.eclipse.org/swt/. [19] F INK , S., YAHAV, E., D OR , N., R AMALINGAM , G., AND G EAY, E. Effective typestate verification in the presence of aliasing. In ISSTA ’06: Proceedings of the 2006 international symposium on Software testing and analysis (New York, NY, USA, 2006), ACM Press, pp. 133–144. [20] F INK , S. J., AND Q IAN , F. Design, implementation and
evaluation of adaptive recompilation with on-stack replacement. In International Symposium on Code Generation and Optimization (CGO 2003) (2003), pp. 241–252. [21] F OSTER , J. S., T ERAUCHI , T., AND A IKEN , A. Flowsensitive type qualifiers. pp. 1–12. [22] H AUSWIRTH , M., AND C HILIMBI , T. M. Low-overhead memory leak detection using adaptive statistical profiling. SIGPLAN Not. 39, 11 (2004), 156–164. [23] H EINE , D. L., AND L AM , M. S. A practical flowsensitive and context-sensitive c and c++ memory leak detector. In PLDI ’03: Proceedings of the ACM SIGPLAN 2003 conference on Programming language design and implementation (New York, NY, USA, 2003), ACM, pp. 168– 181. [24] J UMP, M., AND M C K INLEY, K. S. Cork: dynamic memory leak detection for garbage-collected languages. SIGPLAN Not. 42, 1 (2007), 31–38. [25] L AU , J., A RNOLD , M., H IND , M., AND C ALDER , B. Online performance auditing: using hot optimizations without getting burned. SIGPLAN Not. 41, 6 (2006), 239–251. [26] L EV-A MI , T., AND S AGIV, M. TVLA: A framework for Kleene based static analysis. In Saskatchewan (2000), vol. 1824 of Lecture Notes in Computer Science, SpringerVerlag, pp. 280–301. [27] L IBLIT, B. Cooperative Bug Isolation (Winning Thesis of the 2005 ACM Doctoral Dissertation Competition), vol. 4440 of Lecture Notes in Computer Science. Springer, 2007. [28] L IVSHITS , V. B. Turning Eclipse against itself: Finding bugs in Eclipse code using lightweight static analysis. Eclipsecon ’05 Research Exchange, Mar. 2005. [29] M ICROSYSTEMS , S. Jvmtm tool interface, version 1.0. In http://java.sun.com/j2se/1.5.0/docs/guide/jvmti/jvmti.html. [30] M ITCHELL , N. The runtime structure of object ownership. In ECOOP (2006), D. Thomas, Ed., vol. 4067 of Lecture Notes in Computer Science, Springer, pp. 74–98. [31] M ITCHELL , N., AND S EVITSKY, G. The causes of bloat, the limits of health. In OOPSLA ’07: Proceedings of the 22nd annual ACM SIGPLAN conference on Object oriented programming systems and applications (2007), pp. 245–260. ¨ [32] M ULLER , P., AND RUDICH , A. Ownership transfer in universe types. In OOPSLA ’07: Proceedings of the 22nd annual ACM SIGPLAN conference on Object oriented programming systems and applications (New York, NY, USA, 2007), ACM, pp. 461–478. [33] Q IAN , F., AND H ENDREN , L. An adaptive, region-based allocator for java. In Proceedings of the third international symposium on Memory management (Jun 2002), ACM Press, pp. 127–138. [34] R AMALINGAM , G., WARSHAVSKY, A., F IELD , J., G OYAL , D., AND S AGIV, M. Deriving specialized program analyses for certifying component-client conformance. In PLDI ’02: Proceedings of the ACM SIGPLAN 2002 Conference on Programming language design and implementation (New York, NY, USA, 2002), ACM, pp. 83–94.
[35] S HAHAM , R., YAHAV, E., KOLODNER , E., AND S AGIV, M. Establishing local temporal heap safety properties with applications to compile-time memory management. In Static Analysis Symposium (2003). [36] S TROM , R. E., AND Y EMINI , S. Typestate: A programming language concept for enhancing software reliability. IEEE Trans. Software Eng. 12, 1 (1986), 157–171. [37] S UGANUMA , T., YASUE , T., K AWAHITO , M., KOMATSU , H., AND NAKATANI , T. A dynamic optimization framework for a Java just-in-time compiler. In OOPSLA ’01: Proceedings of the 16th ACM SIGPLAN conference on Object oriented programming, systems, languages, and applications (New York, NY, USA, 2001), ACM, pp. 180–195. [38] YAHAV, E., AND R AMALINGAM , G. Verifying safety properties using separation and heterogeneous abstractions. In Proceedings of the ACM SIGPLAN 2004 conference on Programming language design and implementation (2004), ACM Press, pp. 25–34.