It is common for today's scientific and business industries to collect large amounts of ... allows users to visualize da
R for Machine Learning Allison Chang
1
Introduction
It is common for today’s scientific and business industries to collect large amounts of ) The first argument is the location (full path) of the file. If the first row of )) + } + }
# use paste to concatenate strings
The 1:10 part of the for loop can be specified as a vector. For instance, if you wanted to loop over indices 1, 2, 3, 5, 6, and 7, you could type for (i in c(1:3,5:7)). To pick out the indices of elements in a vector that satisfy a certain property, use which, for example: > which(v >= 0) > v[which(v >= 0)]
3.4
# indices of nonnegative elements of v # nonnegative elements of v
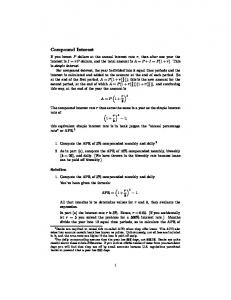
Plotting , xlab="Age", ylab="Number of Nodes", pch=20)
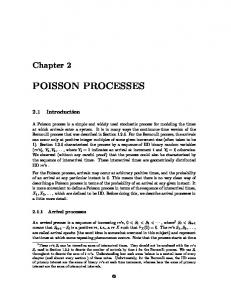
> hist(, xlab="Year", ylab="Count")
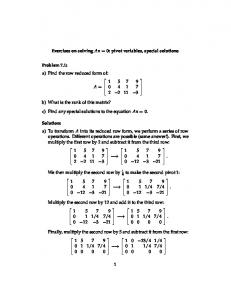
> boxplot(, xlab="Age")
5
80 70 60 50 40
Count
0
30
40 30 20
Number of Nodes
10 0
Boxplot
10 20 30 40 50 60
Histogram
50
Scatterplot
30
40
50
60
70
80
58
60
Age
62
64
66
68
Year
Age
Figure 1: Plotting examples. The pch argument in the plot function can be varied to change the marker. Use points and lines to add extra points and lines to an existing plot. You can save the plots in a number of different formats; make sure the plot window is on top, and go to “File” then “Save as.”
3.5
Formulas
Certain functions have a “formula” as one of their arguments. Usually this is a way to express the form of a model. Here is a simple example. Suppose you have a response variable y and independent variables x1 , x2 , and x3 . To express that y depends linearly on x1 , x2 , and x3 , you would use the formula y ∼ x1 + x2 + x3, where y, x1, x2, and x3 are also column names in your ), )
You can use plot.rpart and text.rpart to plot the decision tree.
4.8
AdaBoost
There are a number of different boosting functions in R. We show here one implementation that uses decision trees as base classifiers. Thus the rpart package should be loaded. Also, the boosting function ada is in the ada package. Let X be the matrix of features, and labels be a vector of 0-1 class labels. The command is > boost_model svm_model summary(svm_model) There are a variety of parameters such as the kernel type and value of the C parameter, so check the documentation on how to alter them.
8
MIT OpenCourseWare http://ocw.mit.edu
15.097 Prediction: Machine Learning and Statistics Spring 2012
For information about citing these materials or our Terms of Use, visit: http://ocw.mit.edu/terms.