Abstractâ In this paper, we suggest a neural network signal detector using radial basis ...... consultant to both private industries and defence organizations. He is.
32
JOURNAL OF COMPUTERS, VOL. 3, NO. 1, JANUARY 2008
Radar Signal Detection In Non-Gaussian Noise Using RBF Neural Network D. G. Khairnar, S. N. Merchant, U. B. Desai SPANN Laboratory Department of Electrical Engineering Indian Institute of Technology, Bombay, Mumbai-400 076, India phone: +(9122) 25720651, Email: dgk,merchant,ubdesai @ee.iitb.ac.in �
Abstract— In this paper, we suggest a neural network signal detector using radial basis function (RBF) network. We employ this RBF Neural detector to detect the presence or absence of a known signal corrupted by different Gaussian, non-Gaussian and impulsive noise components. In case of non-Gaussian noise, experimental results show that RBF network signal detector has significant improvement in performance characteristics. Detection capability is better than to those obtained with multilayer perceptrons (BP) and optimum matched filter (MF) detector. This signal detector is also tested on the simulated signals impacted by impulsive noise produced by atmospheric events and short lived echoes from meteor trains. Tested Results show, improved detection capability to impulsive noise compare to BP signal detector. It also show better performance as a function of signal-tonoise ratio compared to BP and MF. Index Terms— Radial basis function neural network, nonGaussian noise, impulsive noise, signal detection.
I. I NTRODUCTION In radar, sonar and communication applications, ideal signals are usually contaminated with non-Gaussian noise. The radar performance can be degraded by impulsive noise interference such as environmental effects of atmospherics (lighting) and meteor train echoes. Lighting impulsive noise significantly reduces the signal detector performance about 25 percentage. Detection of known signals from noisy observations is an important area of statistical signal processing with direct applications in communications fields. General properties of neural networks include robustness and fault tolerance of the computational elements due to the massive parallesim. Also, adaptive neural networks that very with time are able to change with slowly time-varying signals, improving the non-Gaussian signal detection performance. Neural networks are nonparametric, making no assumptions about the underlying densities, which may provide more robustness and capability for detecting signals generated by nonlinear and non-Gaussian processes. Optimum linear detectors, under the assumption of additive Gaussian noise are suggested in [1]. A class This paper is based on “A Neural Solution for Signal Detection in Non-Gaussian Noise,” by D.G. Khairnar, S.N. Merchant, and U.B. Desai, which appeared in the Proceedings of the Fourth International Conference on Information Technology:New Generations (ITNG’07), Las Vegas, Nevada, USA, April 2007. c 2007 IEEE. �
© 2008 ACADEMY PUBLISHER
of locally optimum detectors are used in [2] under the assumptions of vanishingly small signal strength, large sample size and independent observation. Recently, neural networks have been extensively studied and suggested for applications in many areas of signal processing. Signal detection using neural network is a recent trend [3] [6]. In [3] Watterson generalizes an optimum multilayer perceptron neural receiver for signal detection. To improve performance of the matched filter in the presence of impulsive noise, Lippmann and Beckman [4] employed a neural network as a preprocessor to reduce the influence of impulsive noise components. Michalopoulou it et al [5] trained a multilayer neural network to identify one of orthogonal signals embedded in additive Gaussian noise. They showed that, for , operating characteristics of the neural detector were quite close to those obtained by using the optimum matched filter detector. Gandhi and Ramamurti [6], [7] has shown that the neural detector trained using BP algorithm gives near optimum performance. The performance of the neural detector using BP algorithm is better than the Matched Filter (MF) detector, used for detection of Gaussian and non-Gaussian noise. Michale Turley [10] suggested modifications to a known linear prediction missing data technique, and show that this technique is effective against HF radar impulsive interference. Barnum and Simpson [11] investigated a signal processing algorithm that increases radar sensitivity by 20 dB, after excising noise impulses, such as those caused by lighting at the receiver output. In our previous work [12], [13] we suggest the signal detector for non-Gaussian cases such as Double exponential, Contaminated Gaussian and Cauchy noise components. In this work , we explore it further and propose a neural network detector using RBF network and we employ this neural detector to detect the presence or absence of a known signal corrupted by Gaussian, non-Gaussian and impulsive noise components. For many non-Gaussian noise distributions such as double exponential, Contaminated Gaussian, Cauchy and impulsive noise components. We found that RBF network signal detector performance is very close to that of MF and BP detector for Gaussian noise. While, we observed that in non-Gaussian and impulsive noise environments the RBF network signal detector show better performance �
�
�
�
JOURNAL OF COMPUTERS, VOL. 3, NO. 1, JANUARY 2008
33
characteristics and good detection capability compared to neural detector using BP. II. S IGNAL D ETECTOR AND S TATISTICS P RELIMINARIES
, which makes it very difficult to design and input realize the detectors. Although some simpler detectors such as locally optimum detectors have been designed for a specific non-Gaussian noise, their performance will greately degrade when the related assumptions are vioas the marginal (symmetric) probability lated. With �
�
%
�
'
1
Signal detection involves inferring from observational data whether or not a target signal is present. In general, the available observational data are the input to the detector and the output from the detector; these can have one of two possible values, either 1 or 0. The value “1” signifies the presence of the target signal and “0” signifies the absence of the target signal. Probability of and the probability of false alarm are the detection two commonly used measures to assess performance of a is defined as the probability signal detector [1] That is, of choosing given that is true, and is defined given that is true. as the probability of choosing �
�
Q
�
�
�
�
� �
�
�
�
�
�
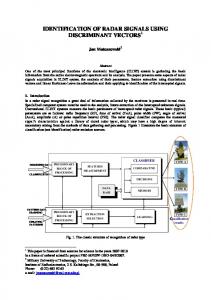
Figure 1. Block diagram of a signal detector.
�
�
�
�
�
�
�
�
�
�
�
�
�
(1) �
L
density function (pdf) of consider the following pdf’s: 1) Gaussian pdf with . 2) Double exponential pdf with and . 3) Contaminated Gaussian pdf with R
*
1
,
U
*
W
*
.
,
.
.
.
*
, here we Y
b
,
'
and
,
Q
and
�
S
�
�
�
[
]
_
`
a
` �
d
W
e
g
&
h
L
�
R
�
�
� �
�
�
�
�
�
�
�
�
�
�
�
(2) �
3
b
g
1
,
'
,
Q
�
� �
[
]
k
_
k
a �
W
g
&
h
L
Consider
vector as an input to the detector in Figure 1. Using the additive observational model, we have (3) &
'
'
�
�
�
a
data
,
'
*
�
�
�
*
.
.
.
.
.
.
�
�
%
�
�
1
*
�
�
�
%
�
�
3
�
3
,
W
g
b
,
7
�
%
�
9
:
�
%
�
n
�
%
�
�
:
�
%
�
for the hypothesis that the signal is absent (denoted by ), where is the target is the signal vector and noise vector. The likelihood ratio is defined by &
7
�
�
%
)
[
D
M
I
M
]
1
D
1
�
M
a �
1
1 �
M
c
c
�
� `
�
�
�
M
(11)
e
b
b
g
i
�
where is a set of basis functions. The constitutes a set of connection weights for the output layer. When using RBF the basis is j
�
M
'
8
;
'
>
'
m
'
-
-
-
-
'
K
o
�
b
7
�
8
;
'
>
'
-
-
'
@
c
�
�
(12)
)
�
M
L
�
D
M
I
r
] !
D
e
'
8
;
'
>
'
m
'
-
-
-
-
'
K
g
A
�
�
�
�
�
C
�
�
D
�
G
I
7
D
(10)
The connection between the hidden layer and output layer are weighted. Neuron of the output layer has a linear input-output relationship so that it performs simple summations. It has been shown experimentally that if a sufficient number of hidden neurons are used and the center vectors are suitably distributed in the input domain, then the RBF network is able to approximate a wide class of nonlinear multidimentional functions. Moreover, the choise of the nonlinearity of the RBF is not crucial for the approximation performance of the network. However, the approximation performance of an RBF network critically depends on the choice of the centers [9].
�
�
�
�
with as unknown where is a symmetric positive centers to be determined. definite weighting matrix of size . represents a multivariate Gaussian distribution with mean vector and covariance matrix . By using above equations we as redefine !
�
t
b
$
!
'
!
)
'
-
-
-
-
-
'
!
1
4
6
!
r
@
M
@
L
�
-
�
!
r
1
1
�
M
a a
�
1
1
�
M
�
`
�
L
�
�
M
'
�
!
�
`
b �
�
L
�
�
D
M
I
!
D
(13) -
b �
�
We determine the set of weights and the set of vectors of centers such that the cost functional, {
$
'
)
b
'
-
-
-
-
-
'
4
b
b
6
~
�
!
!
a
a
�
�
(14) )
�
'
!
�
�
�
` I
�
L
�
�
�
D
M
I
�
D
b
c �
where is a new set of basis functions. The first term on the right hand side of the equation may be expressed as the squared Euclidean norm , where and [8]. j
�
M
'
8
;
'
>
'
m
'
-
-
-
-
'
o
�
)
D
I
L
D
$
'
)
'
'
-
-
-
-
'
4
6
�
$
)
'
b
'
b
'
-
-
-
-
-
-
'
4
b
b
�
�
�
�
`
L
�
�
'
�
L
�
�
'
) �
L
�
�
'
�
�
L
�
) �
'
�
L
�
) �
'
) �
L
�
) �
'
�
`
�
L
�
�
'
�
L
�
�
'
) �
L
�
�
'
�
`
L
.. .
.. .
..
.
.. . `
�
L
�
�
1 '
�
L
�
1 �
'
) �
L
�
�
1 '
�
`
�
Figure 2. Schemetic of the basic RBF signal detector.
$
'
b
)
'
b
'
-
-
-
-
-
-
' 4
-
b b
`
III. A RBF N EURAL S IGNAL D ETECTOR The structure of the signal detector based on an RBF network is shown in Figure 3 [9]. This neural network
© 2008 ACADEMY PUBLISHER
The first step in the learning procedure is to define the instantaneous value of the the cost function. a
�
)
;
Z
>
V `
�
�
(15)
JOURNAL OF COMPUTERS, VOL. 3, NO. 1, JANUARY 2008
35
where is the size of the training sample used to do the learning, and is the error signal defined by �
�
� �
�
�
�
�
�
�
�
�
10-dB-SNR-trained neural network is tested in the 5-dB and 10-dB SNR environment. This latter experiment is carried out to study the neural detector’s sensitivity to the training SNR. To achieve 5-dB SNR environment, we and sufficiently increase the noise variance keep at . E
C
�
� �
�
�
�
�
�
�
�
�
"
�
�
&
�
"
(16) �
�
�
�
-
/
0
2
2
G
>
I
�
�
We assume . is to be minimized with respect to the parameters , , and . The cost function is convex with respect to the linear parameters , but non convex with respect to the centers and matrix . The search for the optimum values of and may get stuck at a local minimum in parameter space. The different learning-parameters assigned updated values to , , and . *
F
7
H
5
3
5
3
8
8
7
8
8
8
5
3
�
&
�
�
3
?
A. Performance in Gaussian Noise (Constant Signal, 10 dB
�
�
@
�
�
A
�
�
3
?
�
�
A
�
3
?
�
�
B
�
�
&
3
?
�
Performance characteristics of neural detectors using RBF, MLP and MF detectors are presented in Figure 4 for Gaussian noise. The RBF and MLP neural detectors are trained using the constant signal and ramp signal with SNR = 10 dB. And then both neural detectors and match filter detector are tested with 10-dB SNR inputs.
Figure 4. Performance in Gaussian Noise (Constant Signal,10 dB).
Figure 3. Signal detector based on the RBF.
RBF networks with supervised learning were able to exceed substantially the performance of multilayer perceptrons [8]. After updating at the end of an epoch, the training is continued for the next epoch and it continues until the maximum error among all K training patterns is reduced to a prespecified level. IV. E XPERIMENTAL R ESULTS AND P ERFORMANCE E VALUATIONS Neural weights are obtained by training the network at and . During 10-dB SNR using is set to , and the simulation, the threshold bias weight value that gives a value in the . For each value that gives a range value in the above range, the corresponding value are values are plotted against the also simulated. These corresponding values to obtain the receiver operating value, larger characteristics. Of course, for a given value implies a better signal detection at that . The 7
C
�
E
F
H
G
2
I
>
�
F
�
8
L