SAVANNAH RIVER PLANT. SAVANNAH RIVER LABORATORY. RADIATION EXPOSURE REPORT. Annual Report for 1988 and Exposure Goals for 1989.
._
Z
DPSPU-89-11.-1
C
SAVANNAH RIVER PLANT SAVANNAH RIVER LABORATORY
RADIATION EXPOSURE REPORT Annual Report for 1988 and Exposure Goals for 1989 Health Protection Department, SRP Occupational Health Protection, SRL
-
C. D. Rogers,S. D.Hyman, L. L. Keisler,D. F. Reeder, L Jolly,M. T. Spoerner G. R.Schramm
_
S
_
E. I.du Pontde Nemours& Co. SavannahRiverPlant Aiken,SC 29808
January 1989
o
_
PREPARED FOR THE U.S. DEPARIMENT
OF ENERGY UNDER CONTRACT
DE.AC09-_IR0_t
--
.
' ,,,
'....,,
,..t
:
_
• _ "i '_ ,_
_
-
-_
DI,.>, F.,_UTIC)t:
':::_ .:';-ii c:_"":_""
.}W;:,:._NTi_'3 L _i4.',.tL,'_I'YEF.', _ =
m
B r
DISCLAIMER This report was prepared by E. I. the United States Department of is an account of work performed the United States Department of _"
du Pont de Nemours and Company (Du Pont) for Energy under Contract DE-ACOg-76SRO0001 and under that Contract. Neither the United States, Energy nor Du Pont, nor any of their employeel,
makes any warranty, expreu or implied, or alsumee any legal liability or mlponlibility for the accuracy, completeness, or uwfulmm of any information, apOeratul, product, or process dlllcloled herein, or represents thor its ule wall not infringe privately owned rights. Reference herein to any specific commericel product, process, or service by trade name, mark, manufacturer, or otherwtw does not necessarily con_itute or imply endormment, recommendation, or favoring of ==me by Du Pont or by the United Statu Government or any agency thereof. The views and opinions of authors expruud herein do not nacemerlly stltl or reflect thaw of the United States Government or any agency thereof.
=
=
=-
=
=.
DPSPU--89-1 DEgl
I-i
-----
005701 E_
_
Contents i
I
Contents Forward
i vi
,:
-
-
.
°
'
_.
_
1 SRP RADIATION EXPOSURE SUMMARY Assimilations 1988 Radiation Exposure Goals 2 100 AREAS P-Area K-Area C-Area L-Area 3 200-F AREA 221-F Canyon FB-Line Outside Facilities 235-F 772-F/1F Waste Management Naval Fuel Material Facility 4 200-H AREA 221-H Canyon HB-Line Tritium Facilities RBOF Waste Management Effluent Treatment Facility , 5 300-M AREA Radiation Exposure 6 400-D AREA Radiation Exposure _7 G-AREA Radiation Exposure 8 SAVANNAH RIVER LABORATORY Radiation Exposure Assimilations 1988 Radiation Exposure Goals 1988 Radiation Exposure Reduction Program
_
1 1 1 15 17 17 18 18 27 27 29 30 31 ' 31 32 34 43 43 44 45 47 48 50 57 57 63 63 65 65 67 67 68 68 68
:__
_
L --
__
-
-_
: : _ -
_=
°
=
DtSTP,IB!J1tC, I'qOF: T14t,£';D(3OUr-,/I_:Nq I,_;ur,41....IM!-i-EO --
E
_ -n
m
i
ii
i
i i i
iii
n
E
m
-
9 ,4LPPENDIX 1988 Reference Information Reporting Methods Special Hazards Investigations, 1988 ' Dosimetry Codes Perspective on SRP/SRL Occupational Radiation Exposures Historical Summary of SRP/SRL Radiation Exposures Construction Radiation Exposure
75 75 76 78 80 86 88 90
_ =
ii
i
E
ii
| TABLES E
1-1 1-2 1-3 1-4 1-5 1-6
:
-_
SRP Radiation Exposure Summary Average Whole Body Radiation Exposure Per Monitored Employee1988 Radiation Exposure Summary of Other Organizations Area Radiation Exposure and Goals Department Radiation ExPOsure and Goals Area Radiation Exposure Breakdown- Tritium, Neutron, and Total 1-7 Individual Employee Whole Body Radiation Exposure Distribution 1-8 Employees With Annual Radiation Exposures Greater Than 2.0 rems I-9 Highest20 Individual Whole Body Exposures-1988 I-I0 ContaminationCasesand Goals 1-111988Assimilations by Area 1,-12 SRP Assimilations 1-13SRP Assimilations by Facilities 1-14Summary ofAssimilations
2 2 5 ._ 5 6 . ' 7
-
-
8 _10 11 !11 12 12 ,12 13
"
-
2-1 2-2 2-3 2-4 2-5 2-6
-
2-7 2-8 2-9 2-10 3-1 3-2
_= -_
3-3 3-4 3-5 3-6 3-7
100-Areas RadiationExposureand Goals 100-Areas Tritium Contribution to Radiation Exposure 100-Areas Tritium Exposure PKCL-Areas Tritium Exposure PKCL-Areas Radiation Exposure 100-Areas 1988 Average Exposure Per Monitored Local Roll Employee Reactor Operator Exposure 100-Areas Health Protection Inspector Exposure 100-Areas Mechanic Exposure 100-Areas Radiation Exposure Indices F-Area Radiation Exposure and Goals F-Area 1988 Average Exposure Per Monitored Local Roll Employee F-Area Operator Exposure F-Area Health Protection Inspector Exposure F-Area Mechanic Exposure FB-Line Operator Exposure--772-F/1F Laboratories Technician Exposure iii
_
1
....
20 2,0 21 21 22 22 23 24 25 26 35
....
36 37 - 38 ...... 39 ......40 41
-
,|
_ %_,mcJ--- ' i
iii
itlJii
i1
i1
IF
i
i iii
TABLES (Continued)
_ _
4-1 H-Area Radiation Exposure and Goals 4-2 H-Area 1988 Average Radiation Exposure Per Monitored Local Roll Employee 4-3 H-Area Operator Exposure 4-4 H-Area Health Protection Inspector Exposure ' 4..5 H-Area Mechanic Exposure 4-6 HB-Line Operator Exposure
51
-
51 52 53 54 55
_ _-_
•
: _
_
5-1 M-Area Radiation Exposure and Goals --. . 5-2 M-Area 1988 Average Exposure Per Monitred Local Roll Employee 5-3 Raw Materials Operator Exposure 5-4 M-Area Radiation Exposure Ratios
59 59 60 62
-
6-1 6-2
D-Area Radiation Exposure and Goals D-Area 1988 Average Radiation Exposure Per Monitored Local Roll Employee .............. .
64
-
7-1 G-Area Radiation Exposure and Goals 7-2 G-Area 1988 Average Radiation Exposure Per Monitored Local Roll Employee
66
8-1 SRL 1988 Radiation Exposure 8-2 SRL Radiation Exposure Summary 8-3 SRL Individual Whole Body Radiation Exposure Distribution 8-4 SRL Average and Maximum Individual Exposure 8-5 SRL Individual Exposure Greater than 1000 mrem 8-6 SRL Assimilations
69 70 71 72 73 73
9-1 9-2 9-3 9-4
78 80 86
1988 Special Hazards Investigations $6090 Organization .... Typical Radiation Exposures . Historical Summary- Exposure Distribution of Annual SRP/SRL Radiation Exposures 1952-1958 ' 9-5 Historical Summary- SRP/SRL Radiation Exposures 1959-1978----9-6 Historical Summary- SRP/SRL Radiation Exposure Breakdown Gamma, Neutron, and Tritium 1959-1987 ........ 9-7 Construction Whole Body Radiation Exposure iv
E
64
66
88 88
-
_ _
=_ = __
89 90
Y _-
FIGURES 1-1 1-2 1-3 1-4 1-5
SRP Radiation Exposure and Goals Percent Change in Exposure and Number Monitored Monitored Employee Average Whole Body Radiation Exposure Plant Exposure Breakdown (Gamma, Neutron, Tritium) Employee Whole Body Radiation Exposure Distribution, Operations and Construction 1-6 Employee Whole Body Radiation Exposure Distribution, 1987 vs 1988 1-7 Annual Radiation Exposures Greater Than 2 rems 1-8 Assimilations of Radionuclides Above Control Limit
._
3 4 7 9 9 10 13
2-1 Reactor Operator Average Radiation Exposure 2-2 Reactor Areas Health Protection Inspector Average Radiation Exposure 2-3 Reactor Areas Mechanic Average Radiation Exposure
23
3-1 F-Area Operator Average Radiation Exposure 3-2 F-Area Health Protection Inspector Average Radiation Exposure 3-3 F-Area Mechanic Average Radiation Exposure 3-4 FB-Line Operator Average Radiation Exposure 3-5 772-F/1F Laboratories Technician Exposure
37
4-1 H-Area Operator Average Radiation Exposure 4-2 H-Area Health Protection Inspector Average Radiation Exposure 4-3 H-Area Mechanic Average Radiation Exposure 4-4 HB-Line Operator Average Radiation Exposure
52
5-1 300-M Area Raw Materials Operator Average Radiation Exposure 5-2 Raw Materials Operator Total Exposure and Workforce
24 25
38 39 40 41
.
53 54 55
60 , 61
,
8-1 SRL Radiation Exposure and Goals 70 8-2 SRL Employee Whole Body Radiation Exposure Distribution ,71, 8-3 SRL Monitored Employee Average Whole Body Radiation Exposure --- 72 -
9-1 Comparison of Occupational and Non-Occupational Exposure 9-2 SRP Construction Average Whole Body Radiation Exposure V
,
87 90
m t
t
t
tt
i
Forward _ ii
t t
t
The protection of' worker health and safety is of paramount concern at the Savannah River Site. Since the site is one of the largest nuclear sites in the nation, radiation safety is a key element in the protection program. This report is a compendium of the results in 1988 of the programs at the Savannah River Plant (Chapters 1 - 7) and the Savannah River Laboratory (Chapter 8) to protect the radiological health of employees. By any measure, the radiation protection performance at this site in 1988 was the best since the beginning of operations. This accomplishment was made possible by the commitment and support at all levels of the organizations to reduce radiation exposures to ALARA ( As Low As Reasonably Achievable). The report provides detailed information about the radiation doses received by departments and work groups within these organizations. It also includes exposure data for recent years to allow Plant and Laboratory units to track the effectiveness of their ALARA efforts. Many of the successful practices and methods that reduced radiation exposure are described.
"_?
=_
_
.
Each year since 1977, radiation protection goals have been developed at the site. These goals set an upper boundary on collective and individual exposures as well as assimilations of radioactive materials. A new goal for personnel contamination cases has been established for 1989. Only through continual and innovative efforts to minimize exposures can the goals be met. The radiation protection goals for 1989 and previous years are included in the report.
--_
-=
_
F
_
m
_
--
vi -
-
E
-ii
SRP RADIATION
_ .....
Collective. --
EXPOSURE I
I
and Individual
SUMMARY
ii
'1
ii iii iql
i
i
Exposures
In 1988 radiation exposure at the Savannah River Plant (SRP) totaled 844.2 rem, the lowest collective exposure in pla_t history. Collective exposure for the plant decreased by 6 % while the number of radiation workers increased by 11% in 1988 as compared to 1987. The plant organizations in the 100, 200, 300, and 400 Areas met their radiation goal_ in 1988.
_
-
-__ -
-
The maximum SRP operations employee whole body radiation exposure was 1590 mrem. This is a plant record for Operations employees and is 260 mrem below the 1850 mrem goal. One Construction employee's whole body radiation exposure exceeded goal. This individual's exposure totaled 2040 mrem. The 1988 average annual radiation exposure was 66 mrem per monitored employee and is the lowest since plant startup. This continuing reduction has resulted in a 60 % decrease since 1979. Ninetyseven percent (97%) of Operations personnel received radiation exposures less than 0.5 rem, with 99% less than 1.0 rem. Ninety-nine percent (99%) of Construction personnel received radiation exposures of less than 0.5 rem, with 99.9% less than 1.0 rem.
= :
-_
-
These achievements demonstrate Operation's and Construction's on and improvement in their ALARA programs. -
--
_
continued emphasis
Assimilations
:-
In 1988 there was one confirmed assimilation _bove the SRP administrative limit. This matches the previous SRP record which was set in 1987. The assimilation was the result of an uptake of tritium and occ_lrred in 100-K Area. The calculated effective dose equivalent for this assimilation for the first 12 months after the intake was 101 mrem.
=
1989 Radiation
:
The 1989 goals listed in this report were based on the recommendations of the Occupational Health Subcommittee and apF:oved by SRP Management. The 1989 Plant cumulative radiation exposure goal is 1164 rem and the Management Challange is 844 rem. The 1989 maximum individual radiation exposure goal is 1800 mrem, and again, the goal is zero for assimilations.
_-
Exposure
-
Goals
_
-
A plantwide goal for personnel contamination cases has been set for the first time. The goal is to experience no more than 175 cases. Tabulation of the cases will follow criteria established by the Institute of Nuclear Power Operations (INPO). _
...=.
i=
SAVANNAH I
2
RIVER 1988
l iii
PL4NT
Radiation
AND
LABORATORY
Exposure
Report
i
I
III
i
TABLE 1-1. SRP RADIATION
YEAR
EXPOSURE
GOAL
SUMMARY *
TOTAL WHOLE BODY EXPOSURE, rem **
1 [ _
1979 1980 1981 1982 1983 1984 1985 1986 1987 1988 1989
1000 1110 1140 1190 1120 1223 1282 1295 1265 1215 1164
1085 1128 1130 1080 1049 1024 1081 1061 896 844
i_
• Includes SRP and Construction. • * Includes the effective dose equivalent from tritium. For SRL see TABLE 8-2. For DOE, SREL, Forestry, Southern Bell, AT&T, NUS, and WSI see TABLE 1-3. ffi
TABLE 1-2. AVERAGE WHOLE BODY RADIATION EXPOSURE PER MONITORED EMPLOYEE * _.k_inm
llll, i
IL
:
-
b"_lmNm_Wllf_
-
_AR
NO. OF PERSONNEL MONITORED
1979 1980 1981 1982 1983 1984 1985 1986 1987 1988 m--
AVERAGE ExPOSURE , (torero), .
6,592 6,962 7,763 7,940 8,896 9,398 11,019 11,892 11,559 12,830 ,
,,
,
164 162 146 136 118 109 98 89 78 ' 66 , ,
,,
,
,,
E =
i
• Includes SRP and Construction. For SRL see Table 8-4. I =.
E
t
i
I
ii
i
1.
i
I
i
SRP Radiation
I
Exposure
r
iii
I
i
,
' 2000_ _
3
Summary
it
i
SRP GOAL
_
SRP EXPOSURE
_ 1216
_
' _oo
,.
._
.
_ :t
-
.
1979
1980
1981
1982
1983
"
1984
•
1985
L988
198"/
BODY
RADIATION
1988
YEAR FIG.
1-1.
SAVANNAH
RrVER
PLANT
WHOLe.
EXPOSURE
=
'SAVANNAH 4
llIll
RIVER
PLANT
1988 Radiation
II
I
II
I
II
II
_u
LABORATORY
Exposure
Report
II
II
11 1
i J_
SO" °
'I
TOTALREM
_
_l
INCREASE
.
--
lr .20
"II------ 22 % ,
_
DECREASE
.40"i ..........,' '" 1979 1980
, 1981
, 1982
_.... 1983
, ...... 1984
, 1985
, 1986
, 1987
, 1988
YEAR FIG. 1-2. PERCENT CHANGE IN THE NUMBER OF MONITORED EMPLOYEES AND THE TOTAL SRP RADIATION EXPOSURE SINCE 1979 ,,,
i
II
I
i
50'
1979
1980
1981
1982
1983
1984
1985
1986
1987
1988
YEAR
__
FIG. 1-3. MONITORED EMPLOYEE AVERAGE WHOLE BODY RADIATION EXPOSURE --_
'I
I
l|IIIIII
I
ii I
i
1. ii
SRP
Radiation
minimal
i
i '
ii
Exposure
I
i
iiI-
|
--
Summary
i
5
i
'
'""'
I
k
TABI.J_ 1-3. 1988 RADIATION EXPOSURE SUM_dARY OF OTHER ORGANIZATIONS i
NO. OF PERSONNEL MONITORED
_LL_
DOE SREL _X)RESTRY SOUTHERN BELL WSI AT&T NUS TOTALS
...
TOTAL WHOLE BODY EXPOSURE. rem
282 108 42 23 978 14 17
1.4 0.5 0.4 0.2 12.3 0.1 _t
1464
14.93
,
i
TABLE 1-4. AREA RADIATION
EXPOSURE
.
imlmm
AND GOALS, REM
m
100 200 300 400 G REST OF PLANT TOTAL (SRP)
1987
1988
1988
1989
129.0 635.1 57.0 5.4 5.5 64.5
216.4 865.0 55.0 6.2 6.6 65.8
125.1 620.6 49.6 1.9 5.1 41.9
142.5 907.6 60.0 4.2 6.2
896_5
1215.0
844.2
1164.0
,
_
ii
i
i
......... 6
U'll
SAVANNAH I
i
1988
RIVER ...........
P'
Radiation I
TABLE 1-5. 1988/89 DEPARTMENT
_LANT AND
LABORATORY
Exposure
Report
RADIATION EXPOSURE
1988 DEPARTMEN._
_
CSWE 17.57 CONSTRL' CTION 320.00 HEALTH PROTECTION 95.25 HEAVY WATER 0.92 LABORATORIES 43.85 POWER/FT 2.68 BUS SERV * 7.40 PROJECT 1.62 RAW MATERIAL OPERATIONS 39.90 ENG.& TECH _..67 RM & TQ REACTOR OPERATIONS 58.33 TECHNICAL 2.51 WORKS ENGINEERING 28.40 PROJ. MTG. RESE MTG. QUALITY SAFEGUARDS & SECURITY 1.34 SEPARATIONS CANYONS 76.20 B-LINES 247.00 OUTSIDE FACILITIES 9.00 PuFF 1.10 RBOF 2.97 PROJECT LIAISON 5.00 TECHNICAL 2.05 WORKS ENGINEERING 41.80 QUALITY MISC. TRITIUM OPERATIONS 4.50 TECHNICAL 0.20 WORKS ENGINEERING 2.21 PROJ. MTG. RTF WASTE MANAGEMENT OPERATIONS 71.17 TECHNICAL 4.55 PROJECTS 0.45 WORKS ENGINEERING 52.86 DEFENSE WASTE 3.30 NAVAL FUEL P&WEfrECH 47.10 OTHER** _ TOTAL 1215.00
...... I
1989 GOAL
12.72 269.45 67.06 25.01 2.01 1.18 0.46 39.32 2.75 1 07
13.8 284.50 100.00 36:15 2.56 5.35 1.22 I 45.46 4.15 1.40
33.56 1.61 21.68 0.14 0.40 0.91 0.41
36.35 2.62 27.32 0.40 0.60 1.60 0.95
61.88 143.85 0.83 0.07 2.45 1..44 1.15 26.35 0.48 22.30
75.00 254.00 2.50 0.50 2.80 4.17 2.41 38.49 1.60
2.95 0.00 1.62 0.00
2.66 0.30 1.86 0.10 0.10
56.31 4.00 0.20 34.81 1.53 4.52 2.0A_ 844.20
74.12 4.85 0.55 93.83 6.00 12.28
_reviou'siy refe_ed i_ as SSD. • * Does. not include or£,anizations listed in TABLE 1-3......
lip
AND GOALS, REM
1988 _
III
1164.00
,.--
II
1. I
SRP
IIiiiii
III
Radiation
iiiii
Exposure
r
I
m
7
Summary ',1lq
iii II
i
TABLE 1-6. AREA RADIATION EXPOSURE BREAKDOWN TRITIUM, NEUTRON, AND TOTAL, REM AREA
TRITIUM
100-P 100-K 100-C 100-L 200-F 200-H 300-M 400-D REST OF PLANT
NEUTRO_
6.5 9.5 1.2 2.6 03 1.6 0.0 0.5 0.8
TOTAL
23.2
:___
OLE BOD.._
0.2 0.1 0.04 0.04 118.3 10.2 0.2 0.02 _
29.0 65.8 10.3 20.0 394.6 226.0 49.6 1.9 _
133.2
844.2
IIII
i
I
III
2.79b 15.8 NEUTRON
81_ t ,AS/MA
I
,
li
ii
i
i
i
i
i
i
FIG. 1.4. PLANT RADIATION EXPOSUR_ BREAKDOWN (TRITIUM, NEUTRON, AND GAMMA) AS A PERCENTAGE OF THE PLANT TOTAL [ [_
IIIII I
I
I
................. SAVANNAH
8 --
'
RIVER
PLANTANDLABORA'rORY ....
1988 Radiation
'
iii rll
Exposure
i
,
Report
I
III
I
iiiii
,,,|,
TABLE 1-7. 1988 INDIVIDUAL EMPLOYEE WHOLE BODY RADIATION EXPOSURE DISTRIBUTION ' 0-0.5 rem
.
OPERATIONS REACT RT ' RWE SEP SEP-T SWE SEPJ FPF WM WO WMWT WMPROJ WM WE DWPF NFP&WE NFr RAW MT RME&T TRITIUM TR TECH RTF TR WE OTHER OPER
_
>2.5 rem
0 0 6 78 0 10 4 0 37 2 1 15 1 1 0 27 2 5 0 0 0 0
0 0 0 '37 0 1 0 0 10 0 0 9 0 0 0 0 0 1 0 0 0 0
0 0 0 7 0 0 0 0 1 0 0 0 0 0 0 0 0 0 0 0 0 0
0 0 0 0 0 0 0 0 0 0 0 0 0 0 0 0 0 0 0 0 0
0 0 0 0 0 0 0 0 0 0 0 0 0 0 0 0 0 0 0 0 0
pLANT FACILITIES AND SERVICES HP 416 46 LABS 283 10 CSWE 842 5 PROJ 183 0 POWER 290 0 POW TEC 48 0 DCS 147 0 OTHER 632 _
2 0 1 0 0 0 0 O
0 0 ,q 0 0 0 0 O
0 0 0 0 0 0 0 0
0 0 0 0 0 0 0 0
TOTAL SRP A_SSI_NED TO SRP* _:)NSTRUCTION TOTAL PLANT AND CONST i,
518 103 391 641 96 . 338 46 3 174 49 48 166 286 407 122 200 183 251 10 33 6'7 284
(Number ofEmployees) 0.fi-l.0rem _ _
7257
250
61
8
0
0
587
3
3
1
0
0
1
0
1
0
4593
.f_
.2,
_Q
12437
317
66
9
i
,,
,- •,
,1
• WILMINGTON, DIVERSCO, BECHTEL-NAT, C & R, AIKEN TECH, INS, WESTINGHOUSE, CONST ESCORT, MR/MS TEMPS, INDUSTRIAL PHASES, US ELEVATOR, DNV, DEC, UNITED, JONES, BECHTEL-SR
,
I
--
1.
SRP Radiation
Iii
Exposure
Iql
Iii
.w ii
II
]_'--
I II
ii
Summary
I
9
il_
ii
"--
' "__
l!i ...... _o!mii)_ili)i!l I iiiiiii!iiii!ilili{ {{{!
mN []
OPERATIONS CONSTRUCTION
i_1 i"_i_!!_!_i_i'_t I! I_o_ i! iiiiiiiii!iiili
!ooi mi!_ii)_i_i_:i)) 7N)))I)_) )
) 1.oi mm_))))ili o.t.' -i_)_)_)_)_)_)))_ .. ;- .- .w...../_/..,:." I I
0.0 - 0.5 ,,,.,am ._.m..
0.5
- 1.0
i
1.0 - 1.5 1.5 - 2.0 REM
I
'_lilr_lr_ll#'jilm/lllr_'m
"_
2.0 - 2.5
>2.5
_
FIG. 1-5, EMPLOYEE WHOLE BODY RADIATION EXPOSURE AS A PERCENT OF THE TOTAL NUMBER OF MONITO_ rl
l
I
lMIi
li
Ill
DISTRIBUTION EMPLOYEES i
350"
i
i
1987 1988
30_ 250'
_o_ 150'
11'00' 50'
0._ - 1.0
.
_.N
1.o - 1.5
1.5 - 2.0 REM
2.0 -2.5
FIG, 1..8, DISTRIBUTION OF 0.5 ItEM AND GREATER WHOLE BODY RADIATION EXPOSES FOR OPERATIONS AND CONSTRUCTION EMPLOYEES
>,2.5
i I _
I
II
I
Ii +
SAVANN._ 10 i
ii
1988
I
TABLE
I
RIVER
PLANT
Radiation I
AND
LABORATORY
Exposure
Report
.
I
1-8. EMPLOYEES WITH ANNUAL RADIATION EXPOSURE GREAsiER THAN 2.0 REM ,, __I,_.F.._
% OF MONITORED
EMPLOYEES
t
1979 1980 1981 1982 1983 1984 1985 1986 1987 1988
i
• Employees
46 53 45 11 1 0 0 2 0 1 ass!gned
0.7 0.8 0:6 0.1 0.01 0.0 0.0 0.02 0.0 0.01
dosimeters,
including
Construction.
56
40
lO ¸
o 19"/9
1980
1981
1982
1983
1984
19815
1986
19@"/
YEAR FIG. 1-7. EMPLOYEES WITH ANNUAL RADIATION EXPOSURE GREATER THAN 2.0 REM
1988
*
iiii
I
I
iiii
iii
iiii I
iii
I
1.
SRP
Radiation
Exposure
11
Summary
i
I
iiiill ii,
TABLE 1.9. HIGHEST
20 SRP INDIVIDUAL
.DEPARTMENT
__
CONSTRUCTION SEPARATIONS SEPARATIONS BECHTEL SEPARATIONS SEPARATIONS SEPARATIONS SEPARATIONS SEPARATIONS SEPARATIONS SEPARATIONS SEPARATIONS BECHTEL SEPARATIO_"_S SEPARATIONS SEPARATIONS SEPARATIONS SEPARATIONS SEPARATIONS SEPARATIONS
WM TANK FB-LINE FB-LINE WM TANK FB-LINE FB-LINE WM TANK FB-LINE FB-LINE FB-LINE FB-LINE FB-LINE WM TANK FB-LINE FB-LINE FB-LINE FB-LINE FB-LINE FB.LINE FB-LINE
--
-L
iiii
J,,,
WHOLE BODY EXPOSURES.
1988
WHOLE BODY EXPOSURE, .torero FARM
2040 1590 1580 1560 1550 1535 1530 1525 1520 1510 1485 1465 1465 1460 1440 1430 1420 1400 1395 1390
FARM
FARM
FARM
ii
TABLE 1-10. DEPARTMENT/ORGANIZATION CASES AND GOALS
CONTAMINATION
i ii
DEPARTMENT SEPARATIONS SWE LABORATORY RAW MATERIALS RME&T REACTOR RWE NF HP CONSTRUCTION WMWE WMWO , DOE OTHER TOTAL
ii
198.8
1989
43 14 10 4 2 21 3 12 3 50 14 28 2 14 220
37 12 8 4 2 7 3 10 2 42 12 23 2 11 175
i,ii,ll
li
_
i
AllDepartmentsnotlisted havea goalofzero. Goalsbasedon Institute ofNuclearPower Operations CINPO") criteria. ...........
ii
I
SAVANNAH RIVER PLANT AND LABORATORY 1988 Radiation Exposur Report
12
,
,
,
TABLE 1-11. 1988 ASSIMH_TIONS
_
1988 GOAL
1988 ASSIMILATIONS
1989 GOAI_
0 0 0 0
1 0 0 _
0 0 0 0
1
0
100 200 300 REST OF PLANT TOTAL (SRP)
0 _
,
,,,
TABLE 1-12. SRP ASSIMILATIONS FISSION
BY AREA
AMERICIUM
(DOSE METHOD) ENRICHED
*
NATURAL
1981 1982 1983 1984
4 5 5 3
0 0 0 0
1 0 0 0
4 4 1 3
0 0 0 0
0 0 0 0
9 9 6 6
+ 12 6 0
1985
6
0
2
2
0
0
10
0
1986 1987 1988
8 1 0
2 0 0
0 0 0
0 0 1
0 0 0
0 0 0
10 1 1
0 0 0
i
,.,
,
i
li
,
• Confirmedby thedosemethod of100mrem orgreatereffective doseequivalent(first 12months after ._ntake). Data prior to 1981 has not been re-evaluated at this time. A quality factor of I was used for tritium calculations. The assimilations reported are subject to change as calculations of intake and thus effective dose equivalents are refined by collection and interpretation of additional bioassay results.
TABLE 1-13. SRP ASSIMILATIONS
,,
YEAR
FB __
1981 1982 1983 1984 1985 1986 1987 1988
1 4 1 3 6 2 1 0
__
HB 772-F _ 0 0 1 0 0 1 0 0
2 1 1 0 0 2 0 0
BY FACILITIES
(DOSE METHOD)*
(NUMBER OF CONFIRMED INTAKES) TRITIUM REACTOR F FACILITY _ _ _ANYON 2 3 0 3 1 0 0 0
2 1 1 0 1 0 0 1
0 0 0 0 0 2 0 0 ,,,,
,,,
1 0 0 0 2 0 0 0
H _
235-F 0 0 2 0 0 1 0 0
1 0 0 0 0 2 0 0 ,
• Confirmed by the dose method of i00 mrem or greater effective dose equivalent (first 12 months after intake). Data prior to 1981 has not been re-evaluated at this time. A quality factor of 1.0 was used for tritium calculations.
I i
ii
1. m
I
SRP
Radiation
lalll
illill
Exposure
i
13
Summary
i
a|l
.d,
TABLE 1-14. SUMMARY OF 1988 ASSIMILATIONS q
ASSIMILATION
DOSE
DEPT _ 1
Coy st.
_
_
8/26/88
100-K
INCIDENT
_
Tritium
101
Contaminated water was used to cool and flush a core drill rig,
I
I
12 U
I
1 0 1981
1982
1983
1984
1985
1986
1987
1988
YEAR
FIG. 1-8. ASSIMILATION II
OF RADIONUCLIDES ,
ABOVE CONTROL LIMITS
I
E
2
100 AREAS I i_
Radiation
IIIII I
II
III
I'1
II
I
I I
II
I I
I
IIII
I
I
I
II
I
I .
I
_
Exposure
During 1988, radiation exposure for the P,K,C, and L Reactor Areas was 125.1 rem compared to 128.9 rem for 1987. The maximum individual exposure for Operations and Construction personnel was 795 mrem and 1090 mrem respectively. The average annual Re, actor Operator radiation exposure continued to decline and was 90 mrem compared to 120 mrem in 1987. Reactor Works Engineering mechanics received an average radiation exposure of 80 mrem in 1988 as compared to 70 mren, in 1987. Major factors which conL REACTOR tributed to the 1988 annual radiation exposure performance in the 100 Areas included continued emphasis on ALARA, increased training, and extended area shutdowns (903 Reactor days in 1988 versus 384 Reactor days in 1987). Tile tritium contribution to the total radiation dose decreased from 21% in 1987 to 14% in 1988. This decrease can be attributed to continued efforts in the control of work with the potential for tritium exposure and increased construction and sub-contractor personnel radiation and contamination control training. The Reactor Areas experienced one tritium assimilation above the control limit during the calender year. The assimilation was received by a Construction worker and occurred in K Area. The effective dose equivalent in the first 12 months after intake was 10 ! mrem. 100 Areas Radiation
Reduction
Program
Following is a list of effective ALARA programs, mented or continued in 1988: o
activities, and actions that were imple-
Job plans and operating procedures involving work with a potential for exposure must include a statement on ALARA actions and must be approved by a Health Protection Supervisor.
' p
16
SAVANNAI-I RIVER PLANT AND LABORATORY 1988 Radiation
iii
Iii
i
i
Exposure ii
i
iii
iiii
iii
RePort
i
H
illllllll
' iii
o
Each major radiation job plan requires that a Reactor Department supervisor be present to monitor the containment and cleanup of moderator and to ensure that the provisions of the job plan are completely followed.
o
Plastic suits are worn when there is a potential tritium intake rate of 100 uCi/hr or greater for Operations personnel and 50 uCi/hr or greater for Construction personnel or any time an individuars total tritium exposure has the potential to reach 100 uCi per shift.
o
Personnel are removed from all tr;.tium work when bioassay sample results are 10 uCi/L of tritium or greater until followup samples indicate a concentration of 2 uCi/L of tritium or less.
o
Details ofjob plans involving potential worker exposure are reviewed in preplan meetings to emphasize specific methods for reducing exp._ Ire.
o
Verbal notification followed by written notification is provided to department and Health Protection supervision when an individual's exposure exceeds a prorated exposure value.
o
Approximately 10 new tritium air monitoring systems were installed in each of the P,K, and L Reactor buildings. The systems will provide improved monitoring capability throughout the facilities.
o
Trend analysis of radiation exposures and bioassay data are conducted to determine problem areas. These findings are reviewed with appropriate department supervision.
Radiation
Exposure
Indices
Radiation exposure indices documenting collective exposures are being developed for a variety of 100 Area jobs. The indices will be used to plan and track the effectiveness of future improvements in radiation exposure reduction by comparison of the exposure received during a job to the established index. Additional indices were developed in 1988. These include the following K-Area jobs: process line inspection, thermal couple replacement, system 2 & 5 suction line removal, 4th emergency cooling water system seismic bracing, system 2 & 3 expansion joint nozzle inspections, number 6 Heat Exchanger expansion joint inspection, and process area painting. These indices and others are listed in Table 2-10.
I III
w.,_I I
2. I
iiiii
1 I
i
iiii
I
.
Rr,_lImiillinIli__
100 AREAS i
i
I
i
17 III
I
,
.........
:nli_miliil
P-Area Radiation
Exposure;
The P Reactor was shutdown for a total of 267 days in 1988. Total whole body radiation exposure was 28.95 rem as compared to an annual goal of 66.97 rem and a 1987 exposure of 40.0 rem. Tritium accounted for 23 % of the total whole body exposure. The average annual radiation exposure ranged from 65 mrem for RWE E&I mechanics to 135 mrem for HP inspectors. There were no confirmed tl-itium assimilations
to P-Area personnel ia 1988. i
Jobs Contributingto
S_g_nificant Radiation Exposure:
There were no specific jobs that accounted for a significant portion of the P-Area total exposure. K.Area Radiation Exvosure: The K Reactor was shutdown for a total of 265 days in 1988. The t_tal whole body radiation exposure was 65.77 rem as compared to a goal of 69.47 rem and a 1987 radiation exposure of 42.6 rem. Tritium accounted' for 14% of the total whole body radiBtion exposures. The average annual radiation exposure ranged from 78 mrem for Day Reactor operators 'to 219 mrem for Construction personnel. There a 101 mrem nated
was one confirmed tritium assimilation in 1988. A Construction worker received mrem effective dose equivalent for the first 12 months after intake. This was 1 above the 100 mrem confirming level. The assimilation occurred when contamiwater was inadvertently used to cool and flush a core drill rig.
18
li
i
iii
SAVANNAH RIVER PLANT AND LABOI_ATORY 1988 Radiation Exposure Report I
']
!
I
Jobs C_ntributing to Si_afficant
iii
I Illlll
IIINB
umm DIN
IIIlU
I
Radiation Exposure.'
Job _
Radiation Exposure, rem
o o o
Process Line Inspections System 2 & 5 Suction Line Removal Inspect Expansion Joints on #6 Heat Exchange o Process Area Painting o Inspect Nozzles on 2 & 3 System Expansion Joints
4.0 3.6 1.8 1.7 1.0
C.Area Radiation
Exposure:
The C Reactor continued in a "Cold" standby status. The total whole body radiation exposure was 10.35 rem versus an annual goal of 26.15 rem. As in 1987, reactor outage specialists based in C Area received 40 % (4.1 rem) of the total C Area exposure. This exposure was received while performing work at P, K, and L reactors. Tritium accounted for 12 % of the total whole body exposure. There were no confirmed tritium assimilations Jobs Cont_buting
to C Area personnel in 1988.
to Significant Radiation Exposure:
There were no specific jobs that accounted for a significant portion of the C-Area total exposure.
L.Area Radiation Exposure: The L Reactor continued to process Mark 18B charges in 1988. The reactor was shutdown for a total 191 days. Total whole body radiation exposure was 20.0 rem versus an annual goal of 53.86 rem. Tritium accounted for 13% of the total whole body exposure. The average annual radiation mrem for HP inspectors.
exposure ranged from 19 mrem for RWE personnel to 71
i
I
i
I
i i
--
2. I
ilii
iiiiiil
I
I
i lI
_'i
m
p,_ i
i
ii,
100 AREAS --
There were no confirmed tritium assimilations
i iii li
19 i
II
ii
I
i
i
to L-Area personnel in 1988.
Jobs Contribating to Sia_nificant Radiation Exposure: There were no specific jobs that accounted for a significant portion of the L-Area total exposure.
i
i
.........
SAVANNAH
20
RIVER
1988
PLANT
Radiation
AND
LABORATORY
Exposure
Report
TABLE 2_1. 100-AREAS RADIATION EXPOSURE ii
AND GOALS, REM
i
DEPAI_TMENT
,
REACTOR PROJ. MTG RESR. MrG. QUALITY HEALTH PROTECTION WORKS ENGINEERING(RWE) POWER/POWER TECH REACTOR TECH PROJECT BUS SERV * CONSTRUCTION OTHER TOTAL
1987 A_TUAL
1988 _
1988 ACTUAL
1989 GOAL 35.0 0.3 0.5 1.5 7.5 27.0 0.35 2.5 0.15 0.1 65.0
42.5
62.1
5.0 21.4 0.4 1.6 0.1 0.6 55.8 1.5
8.6 27.0 0.4 2.5 0.15 0.7 113.0 2.0
32.48 0.12 0.40 0.91 3.78 20.23 0.36 1.58 0.12 0.48 61.42 ._
128.9
216.45
125.06
142.5
• Previously referred to as SSD.
TABLE 2-2. 100-AREAS TRITIUM CONTRIBUTION RADIATION EXPOSURE, REM 1987 TOTAL DOSE
1987 TRITIUM DO_E
128.9
27.3 i
,.
1988 TOTALDOSE 125.1 ii li
TO
1988 TRITIUM DOSE 19.8
I
III iiII
I
2.
I
100 AREAS
21
I
] I
TABLE 2-3. 100.AREAS
TRITIUM EXPOSURE,
DEPARTM_
I
MREM
1987
REACTOR PROJ. MTG. RESR. MTG. QUALITY HEALTH PROTECTION WORKS ENGINEERING POWER/POWER TECH REACTOR TECH PROJECT BUS SERV * OTHER CONSTRUCTION
1988
13,480
1,230 4,470 0 215 5 150 80 7.625
9,290 15 I0 25 755 3,210 40 150 20 55 190 6.030
27,255
19_790
(RWE)
,
TOTAL
m
• Previously referred to as SSD. i
TABLE 2-4. P,K,C and L-AREAS TRITIUM EXPOSURE,
MREM
ii
PEPARTMENT
P-AREA 1987 1938
K-AREA 1987 1988
C-AREA 1987 1988
REACTOR HP RWE POWER/POWER TECH RT PROJECT BUS SERV ** CONSTRUCTION OTHER
5,825 3,320 450 175 1,655 1,315 0 0 65 35 0 0 i00 25 2,410 1,575 15 _._
4,980 4,320 470 440 1,700 1,210 0 40 55 55 0 0 35 30 2,485 3,325 30 50
635 90 460 0 95 5 15 950 miq
10,520 6,540
9,755 9,470
2,260
TOTAL t _m,
i
L-AREA 1987 _988
750* 2,040 5 220 175 655 0 0 50 0 20 '0 0 0 205 1,780 ._fl 25 1,205
ii
* Includes 5L _,_remfor RX PROJ. MTG., RX RESR. MTG, RX QUALITY. ** Previous_ _eferred to as SSD.
'11_t_'
lr ....
;r,
'
940 135 510 0 10 0 0 925 55
4,720 2,575 li i
I
I
I
I
2. i i
I
I
i li IIHIIIII III III
100 AREAS
I
23
III
TABLE 2-7. REACTOR OPERATOR
I
EXPOSURE
AVERAGE NO. OF _ 1979 1980 1981" 1982" 1983" 1984" 1985" 1986" 1987" 1988"
238 244 286 288 289 322 337 328 272 307
TOTAL REM
AVERAGE EXPOSURE RE_
77.1 80.4 76.5 75.4 74.1 73.5 72.8 61.4 33.4 26.1
0.32 0.33 0.27 0.26 0.26 0.23 0.22 0.19 0.12 0.09
* Average calculated by new method. See Chapter 9 for details.
90
1979
1980
1981
1002
1988 1984 YEAR
1985
1986
198"/
FIG. 2-1. REACTOR OPERATOR AVERAGE EXPOSURE
1988
SAVANNAH _24
RIVER
1988
,,,
,
PLANT
Radiation
AND
LABORATORY
Exposure
,,
.....
RePort
,
INSPECTOR
EXPOSURE
.,,,,
TABLE 2-8. 100.AREAS
HEALTH
..i,==,
PROTECTION
i,
,,
YEAR
AVERAGE NO. OF PER_0NNEL
TOTAL REM
AVERAGE EXPOSURE REM/YEA_
1979 1980 1981" 1982" 1983" 1984" 1985" 1986" 1987" 1988"
22 21 24 24 28 33 31 36 31 28
11 12 12 9 9 8 9 9 5 4
0.50 0.55 0.50 0.38 0.31 0.25 0.28 0.26 0.15 0.13
* Averagecalculated by new method.SeeChapter9 fordetails. l
ii
130
1979
1_0
1981
1982
1988
1984
1985
19@8
1_
YEAR FIG. 2-2. REACTOR AREA HEALTH PROTECTION INSPECTOR AVERAGE RADIATION EXPOSURE
1988
i
i
.
2.
II
II
li
i
100 AREAS
25
i
i
TABLE 2-9. 100-AREAS
•
H,,
MECHANIC
I
EXPOSURE
**
YEAR
AVERAGE NO. OF PERSONNEI_
TOTAL REM
AVERAGE EXPOSURE I:_EM/YEAR
1979 1980 1981" 1982' 1983" 1984" 1985" 1986" 1987" 1988"
345 425 189 174 223 239 376 306 296 237
86 89 35 36 37 32 35 29 19 18
0.25 0.21 0.18 0.21 0.17 0.14 0.09 0.09 0.07 0.08
:H
• Average calculated by new method. See Chapter 9 for details. • * Includes RWE.E&I, RWE-MAINT, RWE-T&T, and RWE-MISC
FIG. 2-3. REACTOR AREA MECHANIC AVERAGE RADIATION EXPOSURE
m
i
I
SAVANNAH RrVER PLANT 26
II
ii
iiiii
TABLE
1988 Radiation Exposure Report
i
2-10.100-AREAS RADIATION
EXPOSURE
INDICE S BINGHAM PUMP SEAL REPLACEMENT HEAT EXCHANGER REPLACEMENT HEAT EXCHANGER INHIBITOR GASKET REPLACEMENT HP INSPECTOR/REACTOR OUTAGE DAY HP INSPECTOR/REACTOR OPERATING DAY REMOVE DAMAGED UNIVERSAL SLEEVE HOUSING (USH) FROM REACTOR o INSTALL GAS PORT, VACUUM COVERS AND RAISE ACTUATOR (+6 HOURS AFTER SHUTDOWN) o TEST EMERGENCY COOLING SYSTEM (ECS) o REPLACE O-RINGS ON TOTAL REACTOR SHIELD PLUGS (+5 HOURS AFTER SHUTDOWN) o INSPECT AND REPACK ROTOVALVES o REPLACE LEAI_NG CRT PUMP o THROTTLE ROTOVALVES (FIVE HOURS AFTER SHUTDOWN) o DECONTAMINATE SCRAP CASK o CHANGE GASKETS ON HEAT EXCHANGER INHIBITOR LINES o PERFORM ROUTINE TANK TOP INSPECTION o REPLACE NOSE PLUG o INSPECT PUMP NOZZLES o REPLACE UNDERWATER D & E RAIL P K C o DRAIN AND BLANK TWELVE HEAT EXCHANGERS o VACUUM DRY TWELVE HEAT EXCHANGERS. o DRAIN SHIELD SYSTEM o DRAIN PURIFICATION AND DISTILLATION SYSTEMS o DRAIN 3RD SAFETY SYSTEM o INSTALLATION OF MODERATOR RECOVERY SYSTEM IN 100-L o INSTALLED FOURTH EMERGENCY COOLING WATER SYSTEM IN 100-L o INSTALL RAMS HORN ON FOUR HEAT EXCHANGERS o 3RD SAFETY SYSTEM REPAIR o REPAIR OXALIC ACID FLUSH LINES o CHA_NGEOUT AND REPAIR OF ECW VALVES 58, 48, AND 28 o BINGHAM PUMP SUCTION LINES AND ELBOW INSPECTIONS o , _JCESS LINE INSPECTION o THERMAL COUPLE REPLACEMENT o SYSTEM 2&5 SUCTION LINE REMOVAL o FORTH Ei,_ERGENCY COOLING WATER SYSTEM SEISMIC BRACING o SYSTEM 2&3 EXPANSION JOINT NOZZLE INSPECTION o NUMBER 6 HEAT EXCHANGER EXPANSION JOINT INSPECTION o PROCESS AREA FAI1NT_ING • Developed in 1988 0 o o o o o
t
i
AND LABORATORY ....
i._:
vL-,
J-._
I
i
INDICES D_OSE (r_m) 0.750 2.500 0.150 0.022 0.006 4.200 0.015 0.485 0.290 1.000 0.370 0.210 0.055 0.050 0.150 0.800 3.900 0.ii0 0.690 0.095 3.800 1.700 0.400 0.200 0.200 7.9 6.7 1.1 2.7 3.4 3.5 1.3 4.0 * 0.5 * 3.6 * 0.8 * 1.0 * 1.8 * 1.7 *
i
O O I
200-F AREA
i
I
itr
li
Radiation
li
t t
'
t,
t
I t
i
lt
_A
L
J
Exposure
The 1988 total whole body radiation exposure was 394.6 rem compared to a goal of 597.0 rem and a 1987 total radiation exposure of 416.5 rem. The maximum individual radiation exposure for Operations and Construction was 1590 mrem and 2040 mrem respectively. Radiation exposures for F-Area personnel continued Lodecline in 1988. The average annual radiation exposure for F-Area operators excluding FB-Line '_ personnel was 450 mrem during 1988 compared to an average of 530 mrem in 1987. Operators in FB-Line received an average radiation exposure of 900 mrem compared to
1 ""
F AREA
1,000 mrem in 1987. This value does not include New Special Recovery operators. Health Protection inspectors assigned to F-Area, excluding those assigned to Naval Fuels, received an average radiation exposure of 370 mrem during 1988 compared to an average of 420 mrem in 1987. Mechanics, which include SWE and WMWE E & I, Maintenance, and T & T personnel received a 1.988 average radiation exposure of 170 mrem compared to a 1987 average of 260 mrem. The major factors which contributed to the 1988 annual ance in F-Area included shutdown work in the Canyon decontamination efforts in the Hot Crane Maintenance reduced fan and equipment replacement/repair work in 221-F
radiation exposure performand FB-Line facilities, improved Area and Sample Aisles, and Outside Facilities.
Canyon
Radiation
Exposure',
Canyon Separations personnel received a 1_988 radiation goal of 48.2 rem and a 1987 exposure of 36.3 rem.
exposure
o¢ 38.4 rem versus
The average radiation exposure for local roll personnel assigned to the Canyon from 92 mrem for SWE-E&I personnel to 378 mrem fbr HP inspectors.
ran[_ed
a
SAVANNAh Rn a'P 'AND LAS0RXTOaq'' 28
I
Jobs Contributing
i i
1988 Radiation I
i
I
Exposure
Report
II
i iii
I
ii
I
to Significant Radiation Expos r_eA Job
Radiation Exposure, rem
o Repair of Hot Canyon Crane and Associated Equipment o Hot Canyon Sample Aisle Work o Routine Surveillance and Repair Work in the HGVC o Warm Canyon Pumps and Six-Pack Repairs o Centrifuge Decon and Equipment Repair in Hot Shop and Swimming Pool o Decontamination of Section 12 HGVC after removal of the fire-eye o Warm Canyon housekeeping and cell cover decontamination work
12.8 6.2 2.4 2.7 1.5 1.3 0.3
Radiation Exposure Reductions: Following is a list of effective ALARA programs, activities, and actions that were implemented or continued in 1988: o
Used robotics and extended tools to remove the Fire-eye junction box in section 12 of the HGVC.
o
Used lead shielding in the Hot Crane Maintenance
o
Continued the use of test badges to characterize the radiation exposure received during certain jobs to help identify high exposure jobs and develop exposure indices.
o
Continued emphasis on decontamination prior to rebuilding.
o
Used a freon decontamination unit in Section 12 of the HGVC to reduce exposure rates from 100 rad/2.5 R/hr to 12rad/2 R_r.
o
Used a freon decontamination unit in the Hot Crane Maintenance Area to reduce exposure rates. The total estimated exposure for the Hot Crane Maintenance Area decreased from 19.1 rem irl 1987 to 12.8 rem in 1988.
o
Continued emphasis on comprehensive personnel exposure.
Area to reduce exposure.
efforts on canyon pumps and motors
preplan meetings for all work involving
i
I
I iii
P
I I
I IIIIII
I
3. I
i
i
I
I1,
iiiiii
I
I
i
ii i
200-F AREA I
I
Hl
29
lP I
I iiiiiii
ii
I
[I
III
Ii
I
FB-Line Radiation
Exposure:.
Separations personnel assigned to FB-Line received a 1988 exposure of 129.1 rem compared to a goal of 220,0 rem and a 1987 exposure of 161.3 rem. The difference between the 1988 actual exposure and the 1988 exposure goal was the continuation of a comprehensive radiation control program, extended shutdown time for construction upgrades, and good operating performance for the newly installed C&D precipitators resulting in reduced maintenance work. The average radiation exposure for local roll personnel assigned to FB-Line ranged from 295 mrem for FB-Line WE to 795 mrem for FB-Line/New Special Recovery operators. The maximum exposure received by an FB-Line operator was 1590 rem. This is the lowest FB-Line maximum exposure in Plant history. Jobs Contributing
to Sie_ificant Radiation Exposure:
There were no jobs that accounted for a significant exposure.
portion of the FB-Line total
RadJ_.£i_onExposure Reductions: Following is a list of effective ALARA programs, mented or continued in 1988:
activities, and actions that were imple-
o
Good operating performance of the new C & D precipitators installed in 1987 continued to reduce exposure significantly for pr6cipitator operators• The general area exposure rate in the older A & B Precipitator Operating Rooms was 18 mrem/hr. The general area exposure rate in the C & D Precipitator Operating Rooms is 5uCffL while working in the Purification area of the 105-P Building between 1/24 and 1129/88. The maximum exposure received was 21.6uCi/Lby a RWE E&I mechanic,No specific sourceofthetritium couldbedetermined.
476
8/26/88
'V TRITIUM EXPOSURE. 105-K:FiveConstruction personnelrectoed tritium exposuresgreaterthan5 uCi/Lwhileworkingon a core drilling jobinthe.20levelheatexchangerbay.The maximum first yeareffective doseequivalent forallindividuals was 101mrem resulting inoneconfirmedassimilation fromtheincident. Contami. natedwaterusedtocooland flushthecoredrill was identified asthe sourceofthetritium.
477
3/10/88
FB-LINE SKIN AND NASAL CONTAMINATION INCIDENT: An FB-Line operator received skin and nasal contamination when a cabinet glovefailed intheDissolver Cabinetduringroutinework. Bioassayresults indicated thatthefirst yeareffective doseequivalent from this uptake is 65 mrem and thus is not a confirmed assimilation.
I I
I
.
9. tilt
tt
Number
APPENDIX
t
TABLE 9-1. 1988 Special
11
79 li
Hazards
Date
Investigations
ttRttii
I
lit i
(Continued):
Title and Description
478
3/18/88
300-M AREA TECHNICAL STANDARD VIOLATION: Two cans of enrich_,d uranium scrap material were improperly stored in the 321-M _asting Area. One can was placed less than 18 cm's from the next closest can of enriched uranium scrap material and thus was in violation of the 300-M Area technical Standard Limits.
479
5/23/88
HIGH EXPOSURE IN 241-F TANK FARM: Two Miller Dunn Electric Company employees received exposure exceeding the monthly guide of 600 mrem during the installation of lightning rod grounding cables on the H&V enclosures for tanks 25-25 and 44-47.
480
6/14/88
IMPROPER CONTROL OF REGULATED TOOLS BY P,AREA SUBCONTRACTORS: Vendor hand tools, which had entered a
_
_
i
radiation zone, were transported off-site without authorization. The toolswereusedby thevendortoinstall a new airconditioner in a P-Reactor radiation zone.The toolsweresurveyedforcontaminationbya ReactorOperatorpriortothevendortransporting them off-site. A follow-up surveyofthetoolsand vendorvehicle by HealthProtection revealed no contamination. 481
7/8/88
G0_TAMINATXON RELEASE TO FOUR MILE C_ The 2818H retention basin was was pumped to Four Mile Creek at the same time the basin was receiving contaminated cooling water from the Separations segregated coolin_ water system. About 21 millicuriesofCs-137fromthisincident has beendetected infourMile Creek.
482
7/18/88
CONTAMINATION OF H-AREA ROADWAYS: Roadways from 221-H truckwell to Gate 10 of the burial ground were contaminated when beta-gamma activity was released from a jumper transfer box during its shipment from 221-H. Eleven employees' shoes, five personnel vehicles, and two government vehicies were contaminated as a result of the release. There were no assimilations from thi_ "ncident.
483
9/9;d8
GLO_cE BREAK. PLUTONIUM EXPERIMENTAL FACILITY. _ FourSRL employeeswereexposedtoairborneradioactive contami_,_tion following a gloveruptureand _-_ 1-elease ofPu-238 intothemaintenanceareaofPEF. Bioasr ,_ults indicated that themaximum first yeareffective doseeq' forthese individuals was 50 mrem, theremaining_._:,__'ebelow10 mrem. Ti'_ere were,therefore, no confirmedassimilations asr result
i
2
.
.
tSL
484 = _: _
: -'
]0/26/88 TO 11/5/88
ItcJ.JtJtD
J.J.JL4,,JL_it_JL&_,
_AC_.[ RELE._E: Particulate emissions were released from the 772-F 75 foot stack as a result of the opening of a diversion valveduringprocessventilation tests.Fourteenemployeesshoesand oneprivate veb, icJe,.ere contaminatedase.result oftherelease. Allcontaminatic, was confined toa 200 foot,, adius of the stack. An estimate of the total amount of plutonium detected intheenvironmentwas 0.001mCi. .._i,,
SAVANNAH 80
Dosimetry
i
i
1988
i
RIVER
PLANT
Radiation i
i
A2qD LABORATORY
Exposure
Report
'
'_,:,
L.4 ll_I_ ....
-
,,
Codes
The Dosimetry Codes in this section reflect a systematic organization of SRP, SRL and Construction Departments and Subcontractors which are reported in a monthly Health Protection Dosimetry Exposure Report $6090.
TABLE 9-2. 86090 _ REACTORS (PMT) REACT REACT- 100 REACT-102 REACT-103 REACT- 104 REACT- 105 REACT-106 RT RWE RWE-161 RWE- 161 RWE. 163 RWE- 164 RWE-165 RWE-166 RPM RRM HW SEPARATIONS (PMT) SEP SEP-200 F B-LINE-201 F B.LINE-850 F B-LINE-851 F B-LINE-852 F B-LINE-853 F B-LINE-861 SEP-202 SEP-203 SEP-204 SEP-205 SEP-208 SEP-209 ST
ORGANIZATION,
1988
FUNCTION/LOCATION
100 102 103 104 105 106 503
SUPPORT
161 162 163 164 165 166 170 175 400
AREA E&I AREA MAINT MAG E&I MAG MAINTENANC E TR & T MISC REACTOR PROJ MGNT REACTOR RESOURCE MGNT
200 201 850 851 852 853 861 202 203 204 205 208 209 504
F-CANYONS (22 l-F) B B-LINE PRODUCTION F B-LINE PROJECT LIAISON F B-LINE NEW SPECIAL RECOVERY F B-LINE TECHNICAL F B-LINE ENGINEERING SERVICES F B-LINE WORKS ENGINEERING F OUTSIDE H CANYONS (221-H) MISC F 234-(PUFF) 244-H3H (ROBF) H B-LINE SEP TECH
DAY RELIEF COMPONENT HANDLING SHIFT OPERATION MISC
_JH m
_
lm•
i,.,lll
i
I
9.
TABLE 9-2. 86090 GROUP
: .
iii
APPENDIX
81
ORGANIZATION,
_
SWE
:
I
SWE-261 261 SWE-261 261 SWE-263 263 SWE-264 264 SWE-265 265 SWE.266 266 SWE.267 267 SWE-268 268 SWE-269 269 SWE-270 270 SWE-271 271 SWE-272 272 S_,_+._-273 273 SWE-274 _' 274 S_rE-275 275 SWE-276 276 SWE-277 277 SWE-278 278 SEPPJ 280 FPF 320 .SEPSQ 871 WA_TE MANAGEMENT & NF (PMT) WM WO WM WO-212 212 WM WO-214 214 WMWT WM WT-210 210 WM WT-211 211 WMPROJ 610 WMPETF 611 WMWE WM WE-E&I 661 WM WE -MAINT 662 WM-WE-TR & T 663 WM WE-MISC 664 DWPFP 7I0 DWPFr 715 DWPFWE DWPFWE'E&I 761 DWPFWE-MAINT 762 DWPFWE.TR & T 763 DWPF_'E-MISC 764 DWPFSF 215 DWPFMD 216
1988 (Continued)
FUNCTION/LOCATION SEP WORKS ENG LAUNDRY E&I LAUNDRY MAINT. CANYON PROCESS E&I CANYON MAINT B-LINE E&I B-LINE MAINT A-LINE E&I (211) A-LINE MAINT (211) PUFF E&I (GEN, 235-F, POWER) PUFF MAINT (GEN, 235-F) LAB E&I LAB MAINT POWER MAINT 717-F MAINT TR & T MISC. & ADMIN, SAFEGUARDS E&I CANYON SUPPORT E&I FUEL PROD FACILITY SEPARATIONS QUALITY
WM WO (F) WM WO (H) WM WT (F) WM WT (H)
DWPF PRODUCTION DWPF TECHNICAL
SAN FRANSISCG MARYLAND l
=
82,
SAVANNAH
RIVER
PLANT
AND
LABORATORY
1988 Radiation ExPOsure RePOrt
,,
TABLE 9-2. $6090 _
,
_
NAV FUEL PROD & WE NFP-MISC 220 NFP-WETCHEM 221 NFP-FINISH 222 NF WE-MISC 230 NF WE-E&I 231 NF-WE-MAINT 232 NAVEL FUEL TECH NFT-MISC 225 NFT-LAB 226 NFT-TECH 227 WMPQ 872 RAW MATERIAL & TRITIUM (PMT) RAW MT RAW MT-300 300 RAW MT-301 301 RAW MT-302 302 RAW MT-303 303 RAW MT-304 304 RAW' MT-305 305 RAW MT-306 306 RAW MT-307 307 RAW MT ENG & TECH RME&T-MISC 314 RMML 309 RMT 315 RAW MT WE-E&I 361 RAW MR' WE-MAINT 362 R_W MT WE-TR & T 363 TRITIUM TR-MISC 419 TRIT 420 TRITIUM 'rECH & ENG TR T&E-MISC 414 TRTECH 415 TR WE-E&I 461 TR WE-MAINT 462 TR WE-TR & T 463 REPLACEMENT TRIT FAC RTF 425 RM&TQ 873 LR PLANNING & BC LRP&BC 507 SAFEGUARDS & SECURITY SG&SEC 508 EMPLOYEE RELATIONS i
ORGANIZATION,
1988 (Continued)
FUNCTION{L_)_ATION
WASTE MNGT & NF QUALITY
MISC (320-M) PROD (313-M) PROD CAST (32 l-M) PROD EXTRUSION (32 I-M) INSP/CONTR (32 l-M) INSP/CONTR (313-M) ENVIRONMENTAL MISC
MET LAB RAW MT TECH
RAW MT & TRITIUM QUALITY
'
I
I I i I
I I
I I
I
iii
........
_1
iii
9. APPENDIX I
I
i
_
ill
83 III
TABLE 9-2. S6090 ORGANIZATION, GROUP
•
_:
_
PERSNL 801 MED 802 SAFETY & FIRE 800 CONF 803 PUBAFF 804 BUSINESS SERVICES A & BA 900 SSD 700 ASQ 874 INFORMATION SYSTEMS CSD 82O CMPPJ 821 CTM 825 ENG & CENT SERV INVENG 620 CS WE CS WE-601 601 CS WE-605 605 CS WE-606 606 CS WE-607 607 CS WE-608 608 CS WE-609 609 DIGITAL CONT & SYSTEMS DCS 615 PROJ 604 POWER 603 POWTEC 502 E&CSQ 876 TECHNICAL OPERATIONS (PMT) LABS LABS-501 501 LABS-570 570 LABS-571 571 LABS-572 572 LABS-573 573 IABS-574 574 LABS-575 575 HP HP-500 500 HP-520 520 HP-521 521 HP-522 522 HP-523 523 HP-524 524 HP-525 525 HP-526 526 ENV&EG 515
IIRII
1988 (Continued)
FUNCTION/LOCATION PERSONNEL MEDICAL SAFETY
ACCOUNTING & BA SITE SERVICE DIV. ADMINISTRATION QUALITY
INVESTMENT CS CS CS CS CS CS
I
ENGINEERING
WE-E&I/MAINT POOL WE-T&T POOL WE-MISC WE-ENG & TRAINING WE-DIGITAL SYSTEMS WE-COMPUTER/RADIO
PROJECTS
ENG & CENT SERV QUALITY MISC SEP. CONTROL PRODUCT ANALYSIS NON DESTRUCTIVE ASSAY NOT DESIGNATED NOT DESIGNATED NOT DESIGNATED MISC CANYON B-LINE A.LINE (211) PUFF (299-H) LABS WM NAVAL FUELS
II
i
-i
SAVANNAH
84
ii iii
i iiq
iii
RIVER
1988
ilrlii
Radiation i
PLANT
AND
Exposure
L_ORATORY Report
...... i
/ j
.,
TAI_!.:,_ _i2.$6090 ORGANIZATION, _
, I
NEPA TECHQ SITE QUALITY SQ MANAGEMENT
_
1988 (Continued)
FTjNCTION/LQCATIQN 830 875
TECHNICAL
902 905
STAFF
CONSTRUCTION SRL TECH-921 TECH-950 TECH-951 TECH-952 TECH-953 TECH-954 TECH-955 TECH-956 TECH-957 TECH-958 TECH-959 TECH-960 TECH-961 TECH-962
040
CONSTRUCTION
921 950 951 052 953 954 955 956 957 958 959 960 961 962
TECH-963 TECH-964 TECH-965 TECH-966 TECH-967 TECH-968 TECH-969 TECH-970 TECH-971 TECH-972 TECH-973 TECH-974 TECH-975 TECH-976 TECH-977 OTHERS DOE SREL FORESTRY SOU BELL WILMINGTON
963 964 965 966 967 968 969 970 971 972 973 974 975 976 977
MISC STAFF (TSTAFF) BUDGET AND PLANNING (T-B&L) SCIENTIFIC COMPUTATIONS (T COMP) LS- ENGINEERING (T LABS) LS- DEVELOPMENI' (T LABS) LS- MAINTENANCE (T LABS) LS- SHIELDED CELLS (T LABS) LS BUILDING SERVICES (T LABS) TNX (T TNXO) PERSONNELSAFETY (T PERS) OCCUPATIONAL HP (T LABS) QUALITY (T QUAL) DEF. WASTE PROC. TECH (T DWPT) (TDWFT) INTERIM WASTE TECH (T IWT) WASTE TECH COORDINATION (TWTC) REACTOR SAFETY RESEARCH (TRSR) NUC. ENG. (T NUCE) NON REACT. SAFETY EVAL. (T NRSE) REACT. SAFETY EVAL. (T RES) ACTINIDE TECH (T ACTT) I-I_'I)ROGEN TECHNOLGGY (T HT) NAVAL FUEL TECHNOLOGY (T NFT) ANALYTICAL DEVE,LOPMENT (T ANLD) ENVIRONMENTAL TECHNOLOGY (T ENVS) EE (T EED) ENVIRONMENTAL SCIENCE (T ENVS) MATERIAL.S TECHNOLOGY (TMT) REACT. QUAL. ADMIN.&PLAN.(T RQAP)
DIVERSCO WSI
056 057
050 051 052 055 053
QUALITY
li I
I
-n
I
IIII
I
IIN
li
9. lBl
iln|l
ill
II II
I
85 I
TABLE 9-2. $6090
BECHTEL C&R AIKEN TECH INS WESTINGHOUSE ESCORTS-CONST TEMPS INDUST PHASES AT&T NUS SCDEHEC US EL DNV DEC UNITED JONES
I
APPENDIX
i
GROUP_
lUiNII I
ORGANIZATION,
I
1988-G (Continued)
HPD (_QDE FUNCTION/L0(_ATIOI_ 058 O59 060 061 062 063 O64 065 066 067 O68 090 091 092 093 094
i
i
,
i'
ii
ii
ii
-
SAVANNAH i
86
i
ii
t
RIVER
1988 Radiation i
iiii
PLANT ,
i
Exposure
--iii
i
ilu
iii
iii
AND LABoRAToI_Y Report
i
i
ii
tilt
t
t
iiIlliRO
S
PAGE REMOVED FOR PUBLIC RELEASE
.....
,,,,,
,,|,,
illll
inl
I
I
I I
-
I
iiiii
lull
9. APPENDIX --
'
mill
ul
i
lul
NI
87 I
IIn
I
PAGE REMOVED FORPUBLIC RELEASE
I
I
....
Ilia
II
-
I
_-
II
'SAV_AH
88
__
tt
Historical
RIVER
Hit
Summary
1988
of StlP
i|
PLANT
Radiation and
I IIII
AND
Exposure ii
SRL
i
Radiation
IIII
I
-_
LABORATORY Report i
i
t
tit|
t
tR
Exposures
TABLE 9-4, HISTORICAL SUMMARY EXPOSURE DISTRIBUTION OF ANNUAL SRP AND SRL W HOLE BODY RADIATION DOSE EQUIVALENTS MONITORED EMPLOYEES IN EACH DOSE RANGE YEAt_ 1952 1953 1954 1,955 1956 1957 1958
_
1 r_-2 1130 4097 7848 8357 7332 8185 7640
rem
3 2 142 242 403 365
2 r_m-3 rem . : 23 52 112 44
3_rem-4 rem .,,>4rem 4 1 3 -
. 1(1)
TOTAL MONITORED EMPLOYEES 1130 4100 7850 8526 7628 8703 8049
(1) One employee with whole body dose equivalent of 10.5 rem from a tritium assimilation.
TABLE 9-5. HISTORICAL SUMMARY - SRP AND SRL WHOLE BODY RADIATION DOSE EQUIVALENTS
1959 1960 1961 1962 1963 1964 1965 1966 1967 1968 1969 1970 1971 1972 1973 1974 1975 1976 1977 1978
=
_
TOTAL _
SRP MONITORED EMPLOYI_ES
1407 2794.5 1939.5 2092.3 2088.1 2680.3 2084.2 1848.6 2316.1 2057.6 2021.3 1863.2 1988,6 1361.5 1293.3 1203.7 1031.2 1052.1 1055.2 1041
4992 4909 5113 5548 5558 4858 4457 4466 4422 4228 4070 4506 4109 3888 4682 4692 5122 5276 5743 6659
AVERAGE _ 281.9 569.3 379.3 377.1 375.7 551,7 467.6 413.9 523.8 486.7 496.6 413.5 484°0 350,2 276,2 256,5 201.3 199,4 183,7 156
SRL TOTAL MONITORED (rem) _ 280 262.7 178.6 172.7 164.8 256.6 284.8 279.0 355.0 361.9 768.3 526.6 412.2 349.3 194.4 163,3 129.4 117.0 110.8 91
764 761 706 684 661 640 520 566 620 647 635 718 747 849 799 745 742 755 782 835
AVERAGE (torero) 366,5 345.2 253,0 252.5 249,3 400,9 547.7 492.9 572,6 559.4 1209.9 733,4 551.8 411,4 243,3 219,2 1.74,4 155.0 140,0 109
* Priorto1973thenumber of SRP monitoredemployeeswas equaltothenumber of employeesmonitoredinDecember,For 1973and after, thenumber ofSRP monitored employees represents a cumulative total. Employees monitored for any period during f.he year are added to the total,
,
I
ii
i
I II
I
9. --
Pi
I
I
I
I
......
II ii
I
i illll
APPENDIX
i
i
I
89 I
I
I
--
I
TABLE 9-6. HISTORICAL SUMMARY SRP AND SRL WHOLE BODY RADIATION DOSE EQUIVALENTS *
_AR 1959 1960 1961 1962 :1963 1964 1965 1966 1967 1968 1969 1970 1971 1972 1973 1974 1975 1976 19.77 1978 1979 1980 1981 1982 1983 1984 1985 1986 1987
GAMMA _
NEUTRONS _
1635.3 2943.2 1974.2 2113.5 2143.7 2761.4 2242.6 2013.2 2582.6 2289.1 2526.7 2173.0 2] _n,8 144,5.9 1291.9 1162.2 968.4 961.9 951.7 958.1 9'?7.0 975,9 965.8 938.4 940.5 861.5 876.3 838.2 730.0
0,7 8.0 0.9 1.8 8.1 30,6 30.5 46.1 54.3 81.6 195.0 154.4 170.0 155.3 95.0 108.2 87.1 106.1 105.1 88.8 1.12.4 157.6 165.8 126.6 114.2 127.7 194.4 252.5 186.9
i
TRITIUM 3_
AVERAGE MONITORED EMPLOYEE ANNUAL DOSE (mrem)
TOTAL MONITORED _). EMPLOYEE8
51 106 143,0 149,7 101.0 144.9 95.9 68,3 34.3 48.8 67.9 62,4 100.0 114.6 100.8 96.6 105.1 101.1 109.2 94.7 83.1 76.6 93.2 71.4 53.9 79.0 55.5 30.5 34.2
1687 3057 2118 2265 2253 2937 2369 2128 2671 2420 2790 2390 2401 1711 1488 1367 1161 1169 1166 1132. 1164 1204 1200 1142 1107 .1.057 1109 1091 921
5756 5670 5819 6232 6219 5498 4977 5032 5042 4875 4705 5224 4856 4737 5481 5437 5864 6031 6525 6475 7035 7424 8635 8812 9878 10368 11924 12764 12585
IN
293.1 539.2 364.0 363,4 362,2 534,2 476.0 422.8 529.8 496,3 592.9 457.5 494.4 361.2 271.4 250.9 197.9 193.8 178.7 176.3 166.7 163.0 141.8 129.0 112.2 103.0 94.4 87.8 75.6 IIll
I
I
• Prior to 1973 the number of SlIP monitored employees was equal to the number of employees monitored in December. For 1.972 and after, the number of SRI' monitored employees rl._presents a cumulative total. Employees monitored for any period during the year are added to the total. • * Tritium exposures prior to 1986 are calculated using a quality factor of 1.7 and a total body water content of 42 kg. I
[
II
II
I
I Illl
I
I
II"
I
...........
SAVANNAH
90
RIVER PLANT
AND
1988 Radiation,Exposure
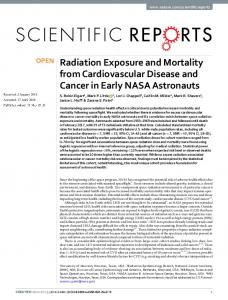
TABLE 9-7. CONSTRUCTION
Report
WHOLE BODY RADIATION
AVERAGE NO, OF PERSONNEL 1978 1979 1980 1981 1982' 1983' 1984' 1985' 1986' 1987" 1988'
LABORATORY ..................
1789 2184 2754 3566 3868 3546 3919
EXI#OSURE
**
AVERAGE EXPOSURE T OTALREM 184 231 296 285 307 239 269
. . . . 103 105 107 80 79 68 69
* Averagecalculated by new method.SeeChapter9 fordetails. ** Data foryearspriorto1982notformattedinthecomputerdatabase.
I
80'
I
40'
69
0 1982
1983
1984
1986 YEAR
1986
19fit
1968
FIG. 9-2.SRP CONSTRUCTION PERSONNEL AVERAGE WHOLE BODY RADIATION EXPOSURE
mL