Initiation trigger may be, received pilot signal strength, carrier to interference ratio, Bit error rate, Energy per bit toFi.1Cluacofgrtn noise power density. Pilot signal ...
Effects of Soft Handover Margin under various Radio propagation parameters in CDMA Cellular Networks N.P.Singh & Brahmjit Singh Electronics and Communication Engineering Department National Institute of Technology, Kurukshetra - 136119
[niraj_p_sgrediffmail.com, brahmjit_pppgyahoo.com]
Abstract- CDMA based cellular networks support soft handover, which makes smooth transition and enhanced communication quality. It is designer's challenge to optimize handover parameters under varied propagation environmental
measurable quantity and directly related to the communication link between user equipment (UE) and BS. In the present work, we have used received pilot signal strength as the initiation trigger. s s the initiation igg r. A reen ivedsign at UE isr in nacture there firequent iclusion /drop of BS(s) i the active setiS termed as active set updaterate andthishas been considered asthe metric for performance evaluation of the soft handover algorithm. Proper design of soft handover is one of the main challenges in 3G networks, since it has a great impact on the system performance and capacity. However tuning and optimizing soft handover parameters have been very difficult to achieve. In this paper, we report the effect of radio propagation parameters and soft handover margin on the active set update rate, Path loss exponent, and standard deviation of shadow fading and correlation coefficient of shadow fades have been utilized as the characteristic parameters of the radio propagation environment. The rest of the paper is organized as follows. Section II describes the system model used for computer simulation; soft handover initiation trigger follows cellular layout and radio gg y propagation assumptions for active set update rate generation in section III. Numerical results are obtained, plotted and discussed in section IV. Finally conclusions are drawn in section V.
conditions. In this paper, we have investigated the effect of soft handover margin and characteristic parameters of the radio
propagation environment on the soft handover performance. We have shown handover performance depends upon characteristic parameters-Path loss exponent, Standard deviation, Correlation coefficient of the shadow fading, window size and soft handover margin. Simulation results have shown that dependence of handover performance on radio propagation characteristic parameters can be reduced by choosing the optimum value of soft handover margin.
I.
INTRODUCTION Soft handover is a technology used in CDMA mobile networks in order to improve the perceived quality of service (QOS) [1]. During the soft handover process, mobile terminals near cell boundaries communicate with more than one base station (BS) simultaneously compared to conventional hard handover, soft handover provides a an* ' smoother transition communication quality and enhanced [1 ].
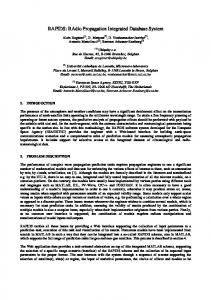
Previous works on the performance of uplink in WCDMA with soft handover in UMTS systems [2] show that SHO reduces interferences, and therefore SIR increases. This gain is known as SHO gain and can be used to offer high quality II. TUE SYSTEM MODEL service and high capacity. In literature, soft handover parameters has been treated for We consider a cellular network as shown in fig. 1. A mobile performance evaluation of the algorithms using both station moves from the cell served by base station (BS 1) analytical method and simulation methods[3,7].A model has towards another with BS2 with constant speed along a been proposed in [8] for computation of outage probability, straight line. D is the distance between the two base stations. macro diversity gain and signaling load. Both of the base stations are assumed to be located in the center of the respective cell and operating at the equal In soft handover evaluation, two issues can be analyzed: the Active set and soft handover Margin (MSH).The active set transmitting power. is the group of base station whom one user equipment is connected. The soft handover margin (MSH) is the maximum allowed difference, measured in dB, between the received power from the best server base station and the UE received power from a candidate base station to be included B51 FB52 in the active set of the user equipment .The initiation trigger utilized for soft handover algorithm determines \ inclusion/drop of a particular BS in/from the active set./\ Initiation trigger may be, received pilot signal strength, carrier to interference ratio, Bit error rate, Energy per bit toFi.1Cluacofgrtn noise power density. Pilot signal strength is easilyFi.1Cluacofgrtn
978-1 -4244-1 878-7/07/$25.OO 2007 IEEE
1
sample taken at the end of (k-n)Th interval. N is the number of samples in the averaging window.
Received signal strength (RSS) at UE consists of three components. (i) Path loss attenuation with respect to distance. Shadow fading. (ii) (iii) Fast fading. Path loss is the deterministic component of RSS, Which can be evaluated by propagation path loss models [3, 4]. Shadowing is caused due to the obstruction of the line of sight path between transmitter and receiver by buildings, hills, trees and foliage. Multipath fading also called fast fading is due to multipath reflection of a transmitted wave by objects such as houses, buildings other man made structures, or natural objects such as forests surrounding the UE It is neglected for handover initiation trigger due to its short correlation distance relative to that of shadow fading. Assuming that the receiver can effectively combat fast fading, the radio channel is modeled as the product of 17thpower of distance, indicating the path loss, and a lognormal component representing shadowing losses [9]. For a UE at a distance r from its serving BS, the propagation attenuation is proportional to
r(r,4 g) = rl1 1 O;l°
NW
4(k) =
4x 1
(3)
a = 40
log(r)
+
30 log(f) + 49 +
(4)
(k
-
1)
+
a
-2)W (0,1)
(6)
SOFT HANDOVER
ALGORITI\M
In the present work we have investigated the effect of soft handover margin and radio propagation characteristic parameters on the active set update rate. Initially when MS is very near to BS, the active set consists of only one BS but as distance from BS1 increases and when soft handover
(1)
03h, ) log(r) - log(h,)
p
III.
region starts then active set size changes with distance. Active set size is updated when the averaged RSS from the candidate BS exceeds that from the currently serving BS in the following way. (7) Savi(r) < Sav2(r) + SH1M where Savl(r) and Sav2(r) are the averaged signal strengths from B51 and hnover an.B52 respectively and SHM\ is the soft handover margm.
and pedestrian outdoor (non-line of sight) environments. -
In the case of rectangular window W.,= 1 for
where W (0, 1) represents truncated normal random variable.
(2) The following path loss models may be used in the vehicular 40(1
n=O
WI
Shadow fading in the present work is modeled as follows
1 0 log a (r, g) = 1 0q7 log r + g
+21log(f)+ 80 + g
Z E
all n. In this work we have shown the effect of window size for given system parameters and the effect of soft handover margin on propagation parameters is analyzed for that typical setting of averaging window size.
Where 1/ is the path loss exponent. Where; (in dB) follows a Gaussian distribution representing attenuation due to shadowing, With zero mean and a standard deviation of C, Which is independent of the distance, it ranges from 5 to 12 with a typical value of 8-1OdB for macrocell. Alternatively, the losses in dB are
a =
N-1
IV.
RESULTSANDDISCUSSION
In this paper, active set update rate has been evaluated as the function of different system parameters and characteristics
where r and hb represent BS to UE separation in Kilometers and BS antenna height in meters respectively. 'f is the carrier frequency equal to 2000MHz for UMTS standard. The autocorrelation function between two adjacent shadow fading samples is described by a negative exponential function as given in [10]. The measurements are averaged using a rectangular averaging window to alleviate the effect of shadow fading according to formula [1 1]. A 1 N-i (5) Si(k= NZ S1(k-n)Wn i=1,2
parameters of radio propagation environment. Numerical results for this performance metric are obtained via computer simulation for the system parameters shown in Table 1. Simulation is performed in Matlab 7.0. For determination of active set update rate for each system parameter setting, 5000 runs of the simulation programs are performed. Table 1 System parameters for system simulation.
D=2000m
A where Si is the averaged signal strength and S1 before averaging process. W11 is the weight assigned to the same
2
hb=15m
Distance between two adjacent base stations BSantennaheight
f= 2000MHz d~ im
Carrier frequency Sampling distance
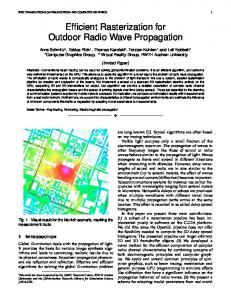
Fig 2 shows the variation of active set update rate with optimum performance Environmental conditions may be window size for different values of soft handover margin. different at different places and therefore soft handover As window size increases active set update rate decreases margin and other design parameters should be adaptive in exponentially. More averaging decreases the active set response to the changing conditions of the radio propagation update rate and hence decreases load on the network. But environment. increase of window size will increase the delay which is not desirable. With increased soft handover margin active set 20 update rate decreases. So for proper performance, handover 1 - -1 - SHM=2dB A -G--SHM-4dB design should be optimum. From the plot we find that 16 - T-SHM=8dB initially active set update rate decreases very rapidly but I M =lOd B H ~~~~~~~~~~~~~~~S I- -L I 14 -\ I after N= 25 this decrease is very slow. Further increase of SHM-12d. I I ISHM=12dB I window size does not cause remarkable reduction in active 1 _ _ SHM=16dB IX set update rate but increases the delay in soft handover L- a X X XI process. Therefore, we have taken N=25 as the optimum a 1 8 ------t window size. The plot also shows that increase in soft handover margin decreases the active set update rate. 6 ---4- - Fig-3 depicts the effect of on active set update rate. It -------I-4__ decreases gradually with the soft handover margin. When 2 T -_--IV soft handover margin is very small, active set update rate is e0 10 20 30 40 50 60 70 80 90 100 very high. High update rate increases signaling and Number of samples in averaging window switching load on the network. So, it is necessary to reduce the active set update rate by increasing soft handover margin Fig. 2 Effect of window size and soft handover margin on active set update but very high soft handover margin will increase soft rate for given 17 =3.5, C=8dB, p/=0.95. handover region and hence will increase interference and load on the network. Soft handover margin should neither be very high nor very low. 84 8.2 -| Fig 4 shows the variation of active set update rate with pathcr 8 loss exponent for different soft handover margin. Active set update rate decreases as path loss exponent is increased. 2 7.8 --- 4 This plot also shows the decrease in active set update rate a) with increase of soft handover margin. The reason for this is I 7 - - that with greater value of path loss exponent, adjacent @ 7.4 values of RSS will differ more sample 7.2 Fig 5 shows the variation of active set update rate with 7 I I standard deviation of shadow fading. As standard deviation 6.8 _ increases active set update rate increases. It is because _ _ the standard deviation more will be the random 6.6 higher L_ L_ _ __\ 2 4 6 8 10 12 14 16 whc leads to enhanced active set variation in the RSS, which margin hando\lr update rate. Soft handover margin also controls this variation. By changing soft handover margin, this variation Fig. 3 Effect of soft handover margin on active set update rate for given can be optimized. Depending upon environment, active set 7 =3.5, C =8dB, p =0.95,N= 20. update rate can be made constant by adaptively varying soft handover margin and other design parameters. I I I SHM=4dB Finally, fig-6 depicts the variation of active set update rate with respect to correlation coefficient of shadow fading for - SHM=6dB _ ---1I I SHM=8dB different values of soft handover margin. Increase of soft \ handover margin and correlation coefficient decreases the -SHM=12dB -,8 -active set update rate. X K-oSHM=16dB 6 From the above discussion, it is clear that radio propagation X environment and soft handover margin have decisive effect . on the active set update rate in soft handover. Active set-I 4 update rate is the indication of signaling and switching load a on the network, so it is essential to reduce the active set2---T' -update rate. Numerical results show that a given set ofI I lI handover design parameters may not yield optimum results in the entire cellular network. So for optimizing load on the2 2. 3 35 4 45 5 network soft handover margin and handover design Pah ioss exponent -
-
-
-
parameters should be adaptive. For different environmental
Fig.4 Effect of path loss exponent and soft handover margin on active set
update rate for given CT 8dB, p= 0.95, N=20.
conditions soft handover margin should be different for
3
optimum performance. For optimizing load on the network soft handover margin and handover design parameters should be adaptive. Results obtained in this paper may be useful for designing optimum soft handover algorithm in varied propagation environmental conditions. The work may be extended by considering other performance metric of soft handover algorithm including outage probability and soft handover region.
SHM=2 x SHM=4dB
10 _
0- SHM=6dB
9_
CD
A> -. SHM=8dB -4-----t-SHM=1OdB _ _
SHM=l2dBI
O0- SHM=16dB I _
7_ 0_
IIS
/
CD
6 ----i- --- - - - -4t ,e-
5