Progress In Electromagnetics Research B, Vol. 25, 211–224, 2010
RAIN ATTENUATION MODELING IN THE 10–100 GHz FREQUENCY USING DROP SIZE DISTRIBUTIONS FOR DIFFERENT CLIMATIC ZONES IN TROPICAL INDIA S. Das and A. Maitra Institute of Radio Physics and Electronics University of Calcutta Kolkata, India A. K. Shukla Space Applications Centre, Indian Space Research Organization Ahmedabad, India Abstract—Rain drop size distributions (DSD) are measured with disdrometers at five different climatic locations in the Indian tropical region. The distribution of drop size is assumed to be lognormal to model the rain attenuation in the frequency range of 10–100 GHz. The rain attenuation is estimated assuming single scattering of spherical rain drops. Different attenuation characteristics are observed for different regions due to the dependency of DSD on climatic conditions. A comparison shows that significant differences between ITU-R model and DSD derived values occur at high frequency and at high rain rates for different regions. At frequencies below 30 GHz, the ITU-R model matches well with the DSD generated values up to 30 mm/h rain rate but differ above that. The results will be helpful in understanding the pattern of rain attenuation variation and designing the systems at EHF bands in the tropical region. 1. INTRODUCTION Rain attenuation is a major limiting factor above 10 GHz frequency bands to be used in radio communications. It is also a relevant issue for space-borne radars for cloud and precipitation characterization. Although, other forms of hydrometeors (snow, hail etc) also affect the performance of the system, the attenuation due to rain is most Received 27 July 2010, Accepted 2 September 2010, Scheduled 9 September 2010 Corresponding author: A. Maitra (
[email protected]).
212
Das, Maitra, and Shukla
severe [1, 2]. Rain attenuation modeling is usually done in terms of drop size distribution (DSD) [1–3]. But, the variability of DSD for different climatic regions is a major concern, especially for the tropical region [4], which has a huge diversity in climatic conditions. A few attempts have been made to characterize the rain attenuation over this region [4–8]. In the absence of measured attenuation data, DSD measurements can provide useful information on the variation of the rain attenuation [4, 9, 10]. Rain DSD varies with rain rate as well with the location. Thus the same rain rate can correspond to different DSDs. Raindrop size distributions depend on several factors such as rainfall intensity, circulation system, type of precipitation, wind share, cloud type, etc. It is thus very difficult to formulate a single DSD model to describe the actual raindrop size distribution for all location and rain type. However, it is essential to have a DSD model so that we can model the attenuation. For attenuation calculation, DSD is normally modeled with distributions like exponential, gamma [11, 12] and lognormal [13]. The suitability of these DSD models has been studied by many researchers extensively. However, it is found that the 3-parameters models like lognormal or modified gamma are better suited than the exponential model. Further, the lognormal distribution is more suited for the lower end of drop spectrum due to its steeper gradient than the gamma distribution. From the various studies over tropical region, it is found that three-parameter lognormal model is suitable for this region [4, 13]. Therefore, in the present study, lognormal model is considered to be the representative distribution for DSD. Currently, Indian space Research Organization (ISRO), as a part of earth-space propagation experiment over India region conducting ground based measurements at five different geographical locations, namely, Ahmedabad, Shillong, Trivandrum, Kharagpur and Hassan. These locations fall in different climatic zones of India with different rain characteristics. The rain DSD is one of such parameters being measured. In the absence of actual earth-space propagation measurements, the attenuation modeling using DSD is attempted. This study will be helpful for understanding the rain attenuation characteristics over the Indian tropical region. 2. DATA COLLECTION 2.1. Site Selection In Table 1, the details of the experimental sites are given. The site selection has been done keeping in mind the variability of climatic conditions as stated in Section 1.
Progress In Electromagnetics Research B, Vol. 25, 2010
213
Table 1. Site locations and characteristics. Annual Total Rain (mm)
No. of Rainy days
Lat o N
Long. o E
2415.3
128.1
25 o34’
803.4
35.8
Trivandrum (TVM)
1827.7
Kharagpur (KGP) Hassan (HAS)
Station Name Shillong (SHL) Ahmedabad (AHM)
Measurement Period
Climatic Condition
91 53’
3 Years
Hilly, SW & NE monsoon
23o 04’
72o 38’
3 Years
99.7
08o 29’
76 57’
o
3 Years
1641.4
82.2
22o 32’
88 20’
o
2 Years
912.8
65.0
13 00’
o
2 Years
Plane, SW monsoon Coastal, Plane, SW & NE monsoon Coastal Plane, SW & NE monsoon Plane, SW monsoon
o
o
76 09’
2.2. DSD Measurement An impact type disdrometer manufactured by Disdromet (RD-80) is installed at each of the locations. The disdrometer has a sensitive styrofoam cone connected with a transducer. When a drop strikes the cone, an electric signal is generated whose amplitude is proportional to the momentum of the drop. Using the Gunn-Kinzer relation [14], the drop diameter is estimated from the terminal velocity. It is assumed that the momentum is entirely due to the terminal fall velocity of the drops. It is also assumed that the drops are spherical in shape and no wind motion is present. It is to be noted that the bigger drops are not spherical in shape and thus introduce error in the estimation of rain rate and rain attenuation from the drop size distribution. The discrepancy will be greater at high rain rates as bigger rain drops are abundant in that case. However, it was found that the deviation of rain rate calculated in this way and measured by a collocated raingauge may not be very severe [15]. The sensitivity of disdrometer surface is very important for proper measurement. The surface is cleaned regularly and replaced once in a year. The known sources of error like acoustic noises are kept minimized by proper installation of the instrument at the roof top of a building. Another source of error in disdrometer measurement is the insensitivity for a time period after a bigger drop strikes. This ‘dead time’ leads to underestimation of the smaller drops that fall within this period. But, the effects of these smaller drops are less on rain attenuation and are within 5% error limit [16]. It has much less effect
214
Das, Maitra, and Shukla
on the DSD spectrum except at very low rain rates. So, for the present study, the dead time correction has not been considered. The data collected for years 2005–2007 have been used for the present analysis. An integration time of 30 seconds is used for DSD measurement. As a precautionary measure, the measurement instances which have less than 10 drops recorded have been excluded from the analysis. Cumulative data of all the available years have been used to model the attenuation. This may be helpful to minimize the uncertainties in the measurements. 3. ANALYSIS 3.1. DSD Modeling From the previous studies over tropical regions, it has been observed that DSD follows the lognormal distribution as mentioned in Section 1. Therefore, in the present work, the lognormal model is considered to describe DSD characteristics. The lognormal distribution function is given as follows [13] · ¸ NT −0.5(ln(D) − µ)2 √ exp N (D) = (1) σ2 σD 2π where, N (D) is the number density (in m−3 mm−1 ), NT is total number of drops, D is drop diameter (in mm), σ is the standard deviation and µ is the mean of ln(D). NT , σ and µ are rain rate dependent variables. Various methods are suggested to obtain these parameters [13, 17]. In our approach, we use method of moment technique [4] to estimate these parameters as they are linearly related to the moments of measured DSD. It has been reported that 3rd, 4th and 6th moments are more suitable for estimation of model parameters [13] and are used here accordingly. The mathematical relationships of the distribution parameters with these moments are given as follows: · ¸ 1 NT = exp (24L3 − 27L4 + 6L6 ) (2) 3 1 µ = (−10L3 + 13.5L4 − 3.5L6 ) (3) 3 1 σ 2 = (2L3 − 3L4 + L6 ) (4) 3 Here L3 , L4 , and L6 are the natural logarithms of 3rd, 4th and 6th moments respectively.
Progress In Electromagnetics Research B, Vol. 25, 2010
215
After calculating the DSD parameters for the whole observation period they are modeled in following form NT = aRb µ = c + d ln(R) σ = e + f ln(R)
(5) (6) (7)
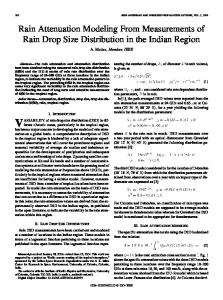
Here, a, b, c, d, e and f are parameters of the model and evaluated by the least squares method. These parameters have some dependency on the rain climatology, as reported in the literature [13, 17]. In estimation of these parameters, all types of rain have been included at a particular location. An example of lognormal model for the measured DSD between 25–26 mm/h rain fall for different region is shown in Fig. 1.
(a)
(b)
(c)
(d)
(e)
Figure 1. Measured and fitted lognormal model at 25–26 mm/h rain rate for (a) AHM, (b) TVM, (c) KGP, (d) SHL and (e) HAS. The error bar indicates the ± one standard deviation from the mean drop size concentrations.
216
Das, Maitra, and Shukla
The error bars in the Fig. 1 shows the deviation of measured values of drop concentration from its mean value by ± one standard deviation. 3.2. Rain Attenuation Modeling In this study, Mie scattering by spherical rain drops is used to calculate the rain attenuation using data from different locations in tropical Indian region. Since the emphasis of the study is to understand the rain attenuation characteristics over different climatic conditions in the tropical region, the single scattering by spherical rain drops has been considered. The polarization independent specific attenuation (A) due to rain drops is given by the following relation [19] Z∞ −3 A (dB/km) = 4.343 × 10 Qt (D)N (D)dD (8) 0
where, Qt is the total extinction cross section in mm2 and is given by, ∞ λ2 X Qt = (2n + 1)Re[an + bn ] (9) 2π n=1
where, an and bn are the Mie scattering coefficients, which are complex functions of drop diameter, wavelength and complex refractive index of water respectively, and Re denotes the real part [2]. In our approach, Liebe model [20] of complex refractive index of water, which is a function of temperature, has been used to obtain the Mie coefficients. The temperature of rainy medium is considered 20◦ C in ITU-R model which is suitable for temperate region. In the present case, the medium temperature is taken to be 30◦ C which is appropriate for the tropical Indian region. The higher rain rates consist of bigger rain drops which are not strictly spherical. The attenuation will be greater for horizontal polarization than the vertical polarization as the drops are spheroidal and elongated in the horizontal direction. The polarization dependent estimation of rain attenuation can be performed using point matching technique or T-matrix approach assuming realistic rain drop size distribution [21, 22]. We used the spherical rain drop model with Mie scattering in our study as the disdrometer measures rain drops and rain rates assuming spherical drop shape. 4. RESULTS The experimental data of DSD modeled with lognormal function yield in five different DSD models for five zones. In Table 2, the modeled
Progress In Electromagnetics Research B, Vol. 25, 2010
217
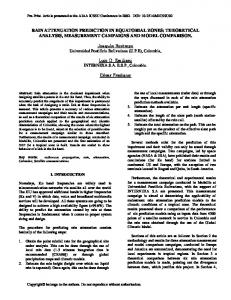
lognormal DSD parameters are given for these locations. Since these models are estimated without any rain classification, they essentially represent the average rain characteristics. In Figs. 2(a)–2(d), modeled drop size distribution for different locations with rain rate 10, 25, 50 and 100 mm/h, respectively, have been shown. The drop distributions become broader with increase in rain rate indicating significant presence of bigger drops at higher Table 2. Modeled lognormal DSD parameters. Location
NT
AHM
149.3799R0.3467
TVM
0.3178
176.7605R
µ
σ2
−0.1380 + 0.1569 ln(R)
0.0625 + 0.0079 ln(R)
0.1934 + 0.1684 ln(R)
0.0692 + 0.005 ln(R)
SHL
170.3792R0.26
0.1925 + 0.1831 ln(R)
0.0738 + 0.0059 ln(R)
KGP
140.8542R0.2994
0.1417 + 0.1716 ln(R)
0.0744 + 0.0064 ln(R)
HAS
225.9998R0.3041
0.2557 + 0.1615 ln(R)
0.0683 + 0.0097 ln(R)
(a)
(b)
(c)
(d)
Figure 2. Comparison of modeled drop size distribution among different locations for (a) 10 mm/h, (b) 25 mm/h, (c) 50 mm/h and (d) 100 mm/h.
218
Das, Maitra, and Shukla
rain rates. It can be also seen that the DSD of different regions are similar in nature, but not exactly same. The variation of DSD results in variation in rain attenuation and it has significant effect at higher rain rates when bigger drops are more abundant. In Figs. 3(a)–3(d), modeled specific attenuations for these regions along with ITU-R model [23] have been shown for the frequency range 10–100 GHz for rain rates 10, 25, 50 and 100 mm/h, respectively. It is to be noted that the ITU-R model is based on the Laws-Parsons DSD, which may not be appropriate for the tropical region [4]. It can be seen from the Fig. 3 that the rain attenuation increases with frequency up to around 100 GHz and decreases at higher frequencies. It is observed that the specific attenuation for each site is more or less matching with ITU-R predicted value in the frequency range 10–50 GHz. However, the discrepancy starts increasing with increasing frequency and rain rate. Among the different locations, HAS shows the maximum specific attenuation and KGP shows the minimum specific attenuation values
(a)
(b)
(c)
(d)
Figure 3. Specific attenuation for different locations with frequency at rain rate (a) 10 mm/h, (b) 25 mm/h, (c) 50 mm/h and (d) 100 mm/h.
Progress In Electromagnetics Research B, Vol. 25, 2010
219
at all the frequencies. It is also observed from Fig. 3 that the ITU-R model is underestimating for HAS, AHM and TVM while overestimating for KGP and SHL at lower rain rates (10, 25 and 50 mm/h) in frequency range 40–80 GHz. At higher rain rate (100 mm/h), the ITU-R model is overestimating for almost all sites over the entire frequency range. This deviation is most severe for SHL and KGP and minimum for HAS. The difference between the ITU-R model and local DSD generated attenuation values increases with increase in rain rates indicating a mismatch between the observed DSD and Laws-Person model of DSD. It is well anticipated since the ITU-R model is developed mainly using the data from the temperate region [1, 2], where rain characteristics are different from that of tropical region. It is also to be noted that the differences in attenuation values at different locations are quite significant at frequencies greater than 40 GHz. The differences between these locations are minimum for 10 mm/h and maximum for 100 mm/h indicating that the rain attenuation becomes more sensitive to variation of DSD at higher rain rates. It can be observed that KGP and SHL show similar attenuation characteristics whereas AHM and TVM show some similarity. The rain attenuation at HAS is always higher than that at other locations. The reason may be due to the different topography and atmospheric conditions in different sites which leads to the different drop formation. The tropical rainfall is often characterized by heavy rainfall during the monsoon period. As the high rain rates are normally due to the convective rain and the local climate is mainly responsible for convection process, the different locations are expected to show
(a)
(b)
Figure 4. Specific Attenuation value calculated using model for different locations at (a) 20.2 GHz and (b) 30.5 GHz.
220
Das, Maitra, and Shukla
different attenuation characteristics at higher rain rates. The results indicate a strong impact of local climate on drop formation process as well as the relationship with meso-scale weather. Although the sites are all in tropical region, they still show marked differences. It can thus be appropriate to measure and model DSD separately for each zone. To get an idea about the location dependency of rain attenuation, the values of specific attenuation at different rain rates have been calculated. In Fig. 4, the variation of specific rain attenuation with rain rate from the lognormal model is given at frequencies 20.2 GHz and 30.5 GHz. These frequencies are possible choices for Ka band downlink and uplink for satellite communications. The model estimation shows that above 30 mm/h rain rate, rain attenuation is overestimated by Table 3. Coefficients for specific attenuation calculation. SHL
AHM
TVM
f (GHz)
k
α
k
α
k
α
10 20 30 40 50 60 70 80 90 100
0.01115 0.1329 0.3385 0.7221 1.093 1.319 1.423 1.464 1.477 1.476
1.199 0.9289 0.8492 0.7414 0.6717 0.6366 0.6209 0.6141 0.611 0.6095
0.0081 0.1204 0.2932 0.6262 0.9788 1.214 1.329 1.373 1.386 1.386
1.249 0.9557 0.8922 0.7934 0.7224 0.6838 0.666 0.6586 0.6555 0.654
0.0057 0.1106 0.2625 0.569 0.9404 1.227 1.385 1.453 1.476 1.479
1.316 0.9723 0.9169 0.8182 0.7361 0.6865 0.6615 0.6506 0.6462 0.6442
f (GHz)
k
α
k
α
k
α
10 20 30 40 50 60 70 80 90 100
0.0116 0.1304 0.3241 0.6719 1.003 1.203 1.296 1.332 1.342 1.341
1.193 0.9328 0.8577 0.7557 0.6888 0.6548 0.6394 0.6329 0.6299 0.6285
0.0060 0.1082 0.2691 0.5778 0.9622 1.29 1.502 1.614 1.661 1.676
1.289 0.9686 0.9036 0.8099 0.7313 0.6799 0.6508 0.6361 0.6292 0.6259
0.0117 0.0938 0.2347 0.4352 0.6536 0.8560 1.0284 1.1686 1.2801 1.3675
1.2371 1.0198 0.9311 0.8549 0.7978 0.7571 0.7280 0.7068 0.6910 0.6789
KGP
HAS
ITU-R
Progress In Electromagnetics Research B, Vol. 25, 2010
221
ITU-R model for all these sites at 20.2 GHz. It is also observed that the deviation is more at 20.2 GHz than at 30.5 GHz frequency and the discrepancy is more for higher rain rates. The variation of specific attenuation among the sites is within the range of 3 dB/km. It is useful to estimate the direct relationship between rain fall rate and the rain attenuation. Normally, a power-law relationship of the following form has been considered for such purpose. A = kRα
(10)
where k and α are constants. From the regression analysis of the modeled attenuation with the rain rate, these constants are determined for different locations and different frequencies. In Table 3, the values obtained for K and α are given. The measured rain rate exceedance plot has been given for these sites in Fig. 5. From the plot, in general, it can be seen that occurrences of rain are quite high over India compared to the temperate regions indicating the probable high rain outage for the communication systems operating at EHF band over India. The measured and ITUR model generated rain exceedances of 0.01% time of a year at different locations are shown in Table 4. It can be observed from the table that ITU-R model [24] generated exceedances are not good representatives of the measured exceedances and may not be a proper choice for estimation of probable rain attenuation in Indian region. This emphasizes the need of actual measurements of DSD at different locations in India for modeling of rain attenuation.
Figure 5. Rain rate exceedance probability for different locations.
Station
Measured
ITU-R
Name
(mm/h)
(mm/h)
SHL
76
84.83
AHM
79
54
TVM
67
93.33
KGP
86
84.67
HAS
57
75.94
Table 4. Rain rate exceedance of 0.01% probability level.
222
Das, Maitra, and Shukla
5. CONCLUSION The DSD modeling in terms of lognormal function has been carried out to estimate the rain attenuation at different places in Indian region in the frequency range of 10–100 GHz. Results show that there is a strong variability of specific rain attenuation at different locations at higher rain rates. DSD is found to depend strongly upon local climate of the different locations in the Indian region. It also comes out from the analysis that the ITU-R model overestimates rain attenuation at frequencies above 30 GHz at all rain rates over the Indian region. At smaller rain rates and in the frequency range 10–30 GHz, the ITU-R model performs well. It is found that for higher rain rates, specific attenuation values vary significantly at different locations and also differ from the ITU-R model. It is also observed that the specific rain attenuation is minimum for KGP and maximum for HAS. The results will be helpful in understanding rain attenuation variation and designing communication systems at EHF bands in the Indian regions. The study also indicates the need of actual measurement of DSD for different climatic zones. ACKNOWLEDGMENT Authors are thankful to scientists and engineers of SAC, ISRO for their effort in experimental setups and data collection. Authors are also thankful to Dr. K. S. DasGupta, Deputy Director, SAC and Mr. Deval Mehta, senior scientist, SAC for their valuable suggestions. The financial support provided to one of the authors (SD) by ISRO under the Space Science Promotion Scheme is thankfully acknowledged. REFERENCES 1. Crane, R. K., Electromagnetic Wave Propagation through Rain, 1st edition, University of Oklahoma, 1996. 2. Ippolito, L. J., Radio Wave Propagation in Satellite Communications, 1st edition, Van Nostrand Reinhold Company, New York, 1986. 3. Thurai, M., V. N. Bringi, and A. Rocha, “Specific attenuation and depolarisation in rain from 2-dimensional video disdrometer data,” IET Microwaves, Antennas & Propagation, Vol. 1, No. 2, 373–380, 2007. 4. Maitra, A., “Rain attenuation modeling from measurement of
Progress In Electromagnetics Research B, Vol. 25, 2010
5. 6.
7. 8.
9.
10.
11.
12.
13.
14.
223
drop size distribution in the Indian region,” IEEE Antennas and Wireless Propagation Letters, Vol. 3, 180–181, 2004. Green, H. E., “Propagation impairment on Ka-band SATCOM links in tropical and equatorial regions,” IEEE Antennas and Propagation Magazine, Vol. 46, No. 2, April 2004. Baldotra, A. K. and I. S. Hudiara, “Rain attenuation statistics over terrestrial microwave link at 19.4 GHz at Amritsar,” IEEE Transactions on Antennas and Propagation, Vol. 52, No. 6, 1505– 1508, June 2004 Mandeep, J. S. and J. E. Allnutt, “Rain attenuation predictions at ku-band in south east Asia countries,” Progress In Electromagnetics Research, Vol. 76, 65–74, 2007. Ojo, J. S., M. O. Ajewole, and S. K. Sarkar, “Rain rate and rain attenuation prediction for satellite communication in Ku and Ka bands over Nigeria,” Progress In Electromagnetics Research B, Vol. 5, 207–223, 2008. Marzuki, M., T. Kozu., T. Shimomai, W. L. Randeu, H. Hashiguchi, Y. Shibagaki, “Diurnal variation of rain attenuation obtained from measurement of raindrop size distribution in equatorial indonesia,” IEEE Transactions on Antennas and Propagation, Vol. 57, No. 4, 1191–1196, Part 2, Digital Object Identifier: 10.1109/TAP.2009.2015812, 2009. Asen, W. and T. Tjelta, “A novel method for predicting site dependent specific rain attenuation of millimeter radio waves,” IEEE Transactions on Antennas and Propagation, Vol. 51, No. 10, Part 2, 2987–2999, 2003. Kumar, L. S., Y. H. Lee, and J. T. Ong, “Truncated gamma drop size distribution models for rain attenuation in Singapore,” IEEE Transactions on Antennas and Propagation, Vol. 58, No. 4, 1325– 1335, Digital Object Identifier: 10.1109/TAP.2010.2042027, 2010. Li, L. W., P. S. Kooi, M. S. Leong, and T. S. Yeo, “A gamma distribution of raindrop sizes and its application to Singapore’s tropical environment,” Microwave and Optical Technology Letters, Vol. 7, No. 5, 253–257, 1994. Timothy, K. I., J. T. Ong, and E. B. L. Choo, “Rain drop size distribution using method of moments for terrestrial and satellite communication applications in Singapore,” IEEE Transaction on Antennas and Propagation, Vol. 50, No. 10, 1420–1424, 2002. Gunn, R. and G. D. Kinzer, “The terminal velocity of fall for water droplets in stagnant air,” Journal of Meteorology, Vol. 8, 249–253, 1949.
224
Das, Maitra, and Shukla
15. Maitra, A., S. Das, and A. K. Shukla, “Joint statistics of rain rate and event duration for a tropical location in India,” Indian Journal of Radio & Space Physics, Vol. 38, No. 6, 353–360, December 2009. 16. Tokay, A. and D. Short, “Evidence from tropical rain drop spectra of the origin of rain from stratiform versus convective,” J. Appl. Meteor., Vol. 35, 355–371, 1996. 17. Shan, Y. Y., J. T. Ong, Y. H. Lee, and T. T. Nguyen, “Lognormal model for Singapore raindrop size distribution,” Fifth International Conference on Information, Communications and Signal Processing, Bangkok, 2005. 18. Maitra, A., “Three-parameter raindrop size distribution modelling at a tropical location,” Electronics Letters, Vol. 36, No. 10, 906– 907, May 2000. 19. Yeo, T. S, P. S. Kooi, M. S. Leong, and L. W. Li, “Tropical raindrop size distribution for the prediction of rain attenuation of microwaves in the 10–40 GHz band,” IEEE Transaction on Antennas and Propagation, Vol. 49, No. 1, 80–82, January 2001. 20. Liebe, H. J., G. A. Hufford, and T. Manabe, “A model for the complex permittivity of water at frequencies below 1 THz,” Internat. J. Infrared and mm Waves, Vol. 12, 659–675, 1991. 21. Bahrami, M. and J. Rashed-Mohassel, “An exact solution of coherent wave propagation in rain medium with realistic raindrop shapes,” Progress In Electromagnetics Research, Vol. 79, 107–118, 2008. 22. Setijadi, E., A. Matsushima, N. Tanaka, and G. Hendrantoro, “Effect of temperature and multiple scattering on rain attenuation of electromagnetic waves by a simple spherical model,” Progress In Electromagnetics Research, Vol. 99, 339–354, 2009. 23. International Telecommunication Union, “Specific attenuation model for rain for use in prediction methods,” Recommendation ITU-R, P.838-3, Geneva 2005. 24. International Telecommunication Union, “Characteristics of precipitation for propagation modeling,” Recommendation ITUR, P.837-5, Geneva 2007.