AbstractâCell size statistics for the rainfall types in Durban,. South Africa have ... rain rate threshold (say 3 mm/h) to move from an arbitrary rain gauge location A ...
Rain Cell Size Statistics from Rain Gauge Data for Site Diversity Planning and Attenuation Prediction P. O. Akuon and T. J. O. Afullo, Senior Member, SAIEE School of Electrical, Electronic and Computer Engineering, University of KwaZulu-Natal, Durban, 4041, South Africa. {210550793, afullot}@ukzn.ac.za. Abstract—Cell size statistics for the rainfall types in Durban, South Africa have been derived from a five-year, one-hour integration time series rain gauge network data. The data have been converted to their equivalent one-minute integration time values and processed to determine the cell sizes for different rain rate above threshold values between 3 mm/h and 20 mm/h. The results are then compared to the cell size statistics from oneminute integration time data from disdrometer measurements taken for two years. By the use of the terrestrial link attenuation data obtained for Durban, the advection velocity for the stratiform rain has been derived as 6 m/s. The equivalent rain cell diameter model which is an input requirement in the proposed rain attenuation prediction equation and site diversity separation distance has been derived. Index terms— rain cell size, rain gauge data, site diversity, advection velocity, equivalent rain cell diameter.
I. INTRODUCTION Many radar data analyses have been used before by many authors to determine rain cell size distributions for various locations in the world for example, Goldhirsh, Begum et al. and Pawlina [1]-[3]. Rain gauge data have been used as well to derive the rain cell sizes by the use of “Synthetic Storm Technique” by Drufuca et al., Pawlina and Fontan et al. [3][5]. From the rain rate time series data, the durations for which a specific rain rate is exceeded are determined for all the rain events in the data range. These durations are then converted into their respective distances by assuming a given velocity of advection for the rain event. However, it has been noted that the less intensive rain forms are slower than the convective ones and a lower value for advection velocity is required for these stratiform rain structures [3]. For example, in Italy, Pawlina found that when lower values of the advection velocity were assigned to the stratiform rain forms, then the rain cell size distribution from rain gauge network data matched those derived from radar data [3]. We have used the same approach in this work to determine the rain cell sizes for Durban and surrounding areas by the use of comparative analysis for results obtained from one-minute and one-hour integration time data. II. METHODOLOGY A. Rain Gauge Data Analysis Rain gauge data for five years were obtained from the South African Weather Services data bank. These are presented with one-hour integration time and the recommended one-minute integration time equivalents are thus required as stipulated by
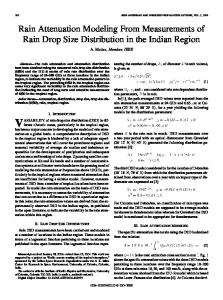
ITU-R [6]. It is therefore necessary to convert the data into their one-minute integration time equivalents by the use of appropriate conversion factor. Disdrometer data were collected for a period of two years from January 2009 to December 2010 and these are presented with one-minute integration time. The equipment is set up at the Centre of Excellence, Howard College, in the University of KwaZuluNatal, Durban. The cumulative distributions for the five-year rain gauge data and the two-year data from the disdrometer have been processed statistically as shown in Fig. 1. From the curves, the power law conversion factor given in (1) is derived as: = 6.3313 . (1) where is the rain rate for one-minute integration time and is the rain rate value from a rain gauge with onehour integration time. B. Rain Cell Size Determination In the rain rate time series analysis, a point rain rate collected in a rain gauge is considered to be as a result of a moving rain cell. We assume that the average time taken for a rain rate threshold (say 3 mm/h) to move from an arbitrary rain gauge location A to another location B is equal to the accumulated time for the total rain gauge tips. The number of tips is directly proportional to the rain rate and the height for each tip. The distance covered by the moving cell is directly proportional to the velocity of advection of the given rain rate with time as the gradient. To derive the relationship for the cell size and rain rate, the distance, D (km) covered by each rain rate in the rain event is thus directly proportional to the velocity of advection, V (m/s), the rain gauge total number of tips, n and height of each tip, h, but inversely proportional to the rain rate, R. This is expressed in (2a) as [5]: =
. .
[km]
(2a)
Since the rain rate is a function of the height of each tip, we rewrite the (2a) as given in (2b): =
[km]
(2b)
where and are climate-dependent parameters to be determined. The rain rate data were divided into two categories: stratiform (R