Semiconductors, Vol. 37, No. 8, 2003, pp. 940–943. Translated from Fizika i Tekhnika Poluprovodnikov, Vol. 37, No. 8, 2003, pp. 964–967. Original Russian Text Copyright © 2003 by Bessolov, Zhilyaev, Konenkova, Fedirko, Zahn.
LOW-DIMENSIONAL SYSTEMS
Raman and Infrared Spectroscopy of GaN Nanocrystals Grown by Chloride-Hydride Vapor-Phase Epitaxy on Oxidized Silicon V. N. Bessolov*, Yu. V. Zhilyaev*, E. V. Konenkova*, V. A. Fedirko**, and D. R. T. Zahn*** * Ioffe Physicotechnical Institute, Russian Academy of Sciences, Politekhnicheskaya ul. 26, St. Petersburg, 194021 Russia ** State Technological University Stankin, Moscow, 101472 Russia *** Institut für Physik, TU Chemnitz, D-09107 Chemnitz, Germany e-mail:
[email protected] Submitted January 27, 2003; accepted for publication January 28, 2003
Abstract—Raman and infrared spectroscopy were applied to study nanocrystalline GaN films grown by chloride–hydride vapor-phase epitaxy on SiO2/Si(111) substrates at T = 520°C. It was ascertained that GaN nanocrystals are formed on the oxidized silicon surface at a rate of 10–2 nm/s. It was shown that the peaks in the Raman spectra E2(high) = 566 cm–1 and A1(LO) = 730 cm–1 correspond to the elastically strained GaN wurtzite structure. It was detected that a peak related to E1(TO) = 558 cm–1 arises in the infrared spectra, which shows that elastic stresses in the nanocrystals are insignificant. © 2003 MAIK “Nauka/Interperiodica”.
Gallium nitride epitaxial films play an important role in the development of short-wavelength devices. The absence of a perfect substrate material is the main hindrance limiting progress in the production of highefficiency devices based on GaN. Various single crystals (Al2O3, SiC, GaAs, Si) are being actively employed as substrates for the heteroepitaxial growth of GaN. Notwithstanding the large misfit between the thermal expansion coefficients and lattice parameters of the epi1 taxial GaN layer with wurtzite structure and the Si substrate, it is especially attractive to employ the latter in the development of devices due to the integration of GaN into silicon microelectronics. Recently, much attention has been paid to the technology of producing GaN nanocrystals, as it holds much promise prospective for nanoelectronic devices. Gallium nitride nanocrystals [1, 2] and nanowires [3] have been synthesized by a variety of physical or chemical methods; however, there are no papers devoted to GaN nanostructures on silicon substrates. Epitaxial GaN layers on silicon substrates are grown by various methods: high-vacuum chemical vapor deposition [4], metal–organic chemical vapor deposition (MOCVD) [5], and hydride vapor-phase epitaxy (HVPE) [6]. In low-temperature chloride vapor-phase epitaxy, the formation of a GaN layer on an oxidized silicon substrate begins with the formation of nanocrystalline islands [7]. The optical and electronic properties of GaN layers grown both on Si substrates [8] and GaN nanocrystals have been successfully studied in detail using Raman [3, 9] and infrared (IR) [10] spectroscopy.
1
This paper is devoted to the study of the properties of GaN nanocrystals grown by chloride–hydride vaporphase epitaxy on oxidized silicon substrates. Heteroepitaxy of GaN was carried out on preliminarily oxidized silicon substrates 50 mm in diameter rotating in a hydrogen flow at a frequency of 1 Hz. The ratio of hydrogen and ammonia flows was 2 : 1; the epitaxy temperature T = 520°C. After the heteroepitaxy, the pattern of GaN nucleation was studied using atomic-force microscopy (AFM) at room temperature in air. The Raman spectra were measured in the Z(X, Y)Z geometry, where the Z axis is directed along the wurtz- 1 ite C axis. As is known, a perfect GaN crystal is characterized by a hexagonal wurtzite structure (space sym- 1 4 metry group C 6v At the Γ point, optical phonons are described by the irreducible representation Γopt = A1(Z) + 2B + E1(X, Y) + 2E2, where X, Y, and Z are the polarization directions. The A1(Z), E1(X, Y), and E2 modes correspond to Raman active phonons, whereas the B modes are silent. The Raman measurements were carried out at room temperature using a Dilor XY monochromator with a multichannel detector. An Ar laser (λ = 514.5 nm) was used as the excitation source. The laser-spot size was 1 µm; the spectral resolution was about 2 cm–1. The incident-beam power was about 20 mW. Infrared spectroscopy measurements were carried out using a Bruker IFS66 instrument. Heteroepitaxial growth on a preliminarily oxidized silicon substrate at low temperatures begins with three-
1063-7826/03/3708-0940$24.00 © 2003 MAIK “Nauka/Interperiodica”
RAMAN AND INFRARED SPECTROSCOPY (a)
941
(b)
300 K
300 K
Intensity, arb. units
E2 A1(LO)
500
600
700 800 Raman shift, cm–1
600
500
(c)
700
800 900 Raman shift, cm–1
(d) nm 500
150
400
100
300 200
50 Y
100
Y 0
X
SCALE X: 1000 nm Y: 1000 nm Z: 100 nm 1000
SCALE X: 1000 nm Y: 1000 nm Z: 100 nm 800
(e)
0
X
(f)
800 600 N
600 400 400 200
200
0
0 0
50
100
150 h, nm
0
100
200
300
400
500
600 h, nm
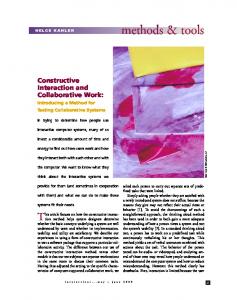
Fig. 1. (a, b) Raman scattering spectra of GaN nanocrystals, (c, d) the GaN/SiO2 surface profile, and (e, f) the size distribution of GaN nuclei at the growth times of (a, c, e) 100 and (b, d, f) 200 min. The scales (c, d) are 1000 (x), 1000 (y), and 100 (z) nm; T = 300 K.
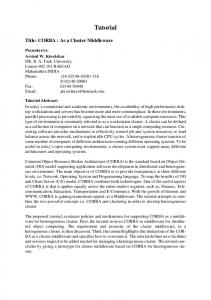
dimensional nucleation of a GaN island; the height h of an island at the instant of its appearance is comparable to its base radius R [7]. The size distribution of GaN nuclei on the substrate surface varies: the average size h linearly increases from 15 to 400 nm as the growth time increases from 10 to 200 min (see Figs. 1c–1f). GaN nanocrystals with h = 50, 200, and 400 nm were studied. Infrared spectroscopy showed that the spectra of nanocrystals with h ≈ 200 and 400 nm are similar and consist of peaks at 1100 and 480 cm–1, SEMICONDUCTORS
Vol. 37
No. 8
2003
which we relate to Si, and a peak at 558 cm–1, due to the E1(TO) mode (Fig. 2). The latter peak is absent in the spectrum of the nanocrystal with h ≈ 50 nm. Raman spectroscopy was applied to reveal the properties of GaN nanocrystals, depending on their sizes, as well as in the course of high-vacuum deposition of silver atoms on the GaN surface. For GaN nanocrystals with h ≈ 400 nm, peaks at 566 and 730 cm–1 were observed, which were due to the E2 (high) and A1(TO) modes, respectively, as was a peak at 516 cm–1, which
BESSOLOV et al.
942 Absorbance 5
5
4 Absorbance
4 3 2
0
2
Si
1 0
1
Si
3
c b a 600 800 1000 1200 1400 Wavenumber, cm–1
E1(TO) 400
c b
a
1000 2000 3000 4000 5000 6000 7000 Wavenumber, cm–1
Fig. 2. Infrared absorption spectra of GaN/SiO2/Si nanocrystals with h = (a) 50, (b) 200, and (c) 400 nm.
Intensity, arb. units (a)
300 A1(LO) 200 100 Si
300 400 500 600 700 800 Raman shift, cm–1
0
0 10.88 6.08 3.41 1.81 1.28 , nm 0.88 ess 0.61 ickn 0.35 th 0.08 Ag Intensity, arb. units Si A1(LO) 700
(b)
500 300
0
100 6.08 4.48 3.41 1.81 m 1.28 , n 0.88 ness 0.61 ck 0.35 thi 0.08 Ag
300 400 500 600 700 800 Raman shift, cm–1 Fig. 3. Raman scattering spectra for various thicknesses of Ag layers deposited on two GaN nanocrystals with h = (a) 50 and (b) 400 nm.
we attribute to Si (Fig. 1b). The spectra of nanocrystals with h ≈ 50 and 200 nm contained only the peak at 516 cm–1 (Fig. 1a). After all of the nanocrystals under study were placed in vacuum and annealed, the Raman spectra initially exhibited only one peak at 516 cm–1 (Fig. 3). However, in the course of Ag deposition on the surface, a peak at ~737 cm–1 arose, which we attribute to the A1(LO) mode. After Ag deposition on nanocrystals with h ≈ 200 and 400 nm, one more peak at 716 cm–1 was detected. As Ag atoms were being deposited on the surface, the intensity of the peak at 516 cm–1 decreased, whereas the intensities of the peaks at 737 and 716 cm–1 initially increased as the Ag-coating thickness grew up to 3 nm, and then decreased. As is known, at the initial stage of the formation of GaN films, nanocrystalline nuclei arise on the SiO2/Si substrate; these are subject to both elastic and plastic strain with the generation of misfit dislocations. The optical properties of such films may be affected, along with the state of the nanocrystal itself, by the medium between nanocrystals (pores, defects, dislocations) and by the existence of amorphous clusters. Therefore, analysis of Raman and IR spectra is difficult. The AFM measurements show that new nuclei arise on the SiO2 surface and their size linearly increases at a rate of ~10–2 cm/s with the time of film growth increasing (Figs. 1e, 1f). Such a low growth rate of islands is caused by the low epitaxy temperature (520°C) and the high barrier for GaN nucleation on a silicon oxide layer. The IR absorption spectra for GaN nuclei with h ≈ 50 nm show (Fig. 2) only the peaks at 480 and 1100 cm–1, which are related to Si [10] (Fig. 2a). In the case of GaN nuclei with h ≈ 200 and 400 nm, the peak at 558 cm–1 arises, which is due to the E1(TO) mode [10] (Figs. 2b, 2c). A similar peak at 566 cm–1 was observed in the IR spectra of GaN layers 0.8 µm thick grown by MOCVD on an Si(001) substrate [10]. The fact that the E1(TO) peak observed by us is shifted to shorter waves can be explained by weaker elastic stress in nanocrystals 400 nm in size in comparison with the stress in the layers 0.8 µm thick. This is due to the fact that nucleation of nanocrystals occurs on the amorphous layer of silicon oxide, rather than on Si as in [10]. We should note that, according to the theoretical estimates [10], the peak due to the E1(TO) mode in the spectrum of bulk gallium nitride is at 557 cm–1. Thus, the oxide layer not only prevents the silicon–ammonia interactions with formation of Si3N4, but also reduces the elastic strain in the nanocrystals, caused by the lattice mismatch between Si and GaN. The Raman spectra of such nanocrystals confirm the IR-spectroscopy data. If the size of GaN nanocrystals is h ≈ 50 and 200 nm, the Raman spectra exhibit only the peak at 516 cm–1 related to Si. If h ≈ 400 nm, one more peak at 566 cm–1 arises, which is due to the A1(LO) mode. A similar peak at 566.2 cm–1 was observed in [8], SEMICONDUCTORS
Vol. 37
No. 8
2003
RAMAN AND INFRARED SPECTROSCOPY
where GaN layers 2 µm thick grown by MOCVD on an Si(111) substrate were studied; this peak was attributed to the elastic stress in the layer. Thus, Raman spectroscopy of GaN nanocrystals with h ≈ 400 nm grown by HVPE on SiO2/Si(111) and GaN layers 2 µm thick grown by MOCVD on Si(111) shows similar results, which indicates approximately equal elastic stress. Raman spectroscopy of GaN nanocrystals with h = 400 nm placed in high vacuum and annealed at T = 600°C shows the disappearance of the peak at 566 cm–1; however, deposition of silver atoms gives rise to the peak at 737 cm–1 in all nanocrystals under study, which is also due to the A1(LO) mode [11] (Fig. 3). As the thickness of the deposited silver layer increased to 3– 4 nm, the intensity of the peak at 737 cm–1 increased, whereas the intensity of the peak at 516 cm–1 decreased. In the course of deposition of silver, one more peak appeared at 716 cm–1 in the Raman spectra of nanocrystals with h ≈ 400 nm; this peak was not identified. Thus, Raman and IR spectroscopy methods showed that the GaN nanocrystals grown on oxidized silicon exhibit single-crystal properties inherent to the strained 1 wurtzite structure. The low (~10–2 cm/s) rate of nanocrystal growth allows one to control the size of nanocrystals and opens up new opportunities for HVPE as applied to gallium nitride nanoelectronics. ACKNOWLEDGMENTS This study was supported in part by the Russian Foundation for Basic Research, project no. 03-0332503, and the federal program of the Ministry of
SPELL: 1. wurtzite
SEMICONDUCTORS
Vol. 37
No. 8
2003
943
Industry, Science, and Technology of the Russian Federation (state contract 40.012.1.1.1153). E. V. Konenkova acknowledges the support of the Saxon Ministry of Science and Culture (Germany). REFERENCES 1. P. Millet, A. Colka, J. S. Williams, and G. J. H. Vantenaar, Appl. Phys. Lett. 63, 2505 (1993). 2. M. Benaissa, M. Jose-Yacaman, J. M. Hernander, et al., Phys. Rev. B 54, 17 763 (1996). 3. G. S. Cheng, L. D. Zhang, Y. Zhou, et al., Appl. Phys. Lett. 75, 2455 (1999). 4. M. H. Kim, Y.-C. Bang, N. M. Park, et al., Appl. Phys. Lett. 78, 2858 (2001). 5. A. Munkholm, C. Thompson, M. V. Raman Murty, et al., Appl. Phys. Lett. 77, 1626 (2000). 6. Yu. V. Melnik, K. V. Vassilevski, I. P. Nikitina, et al., MRS Internet J. Nitride Semicond. Res. 2, 39 (1997). 7. V. N. Bessolov, Yu. V. Zhilyaev, E. V. Konenkova, et al., Pis’ma Zh. Tekh. Fiz. 27 (23), 60 (2001) [Tech. Phys. Lett. 27, 1010 (2001)]. 8. M. Benyonul, M. Kuball, B. Benumont, and P. Gibart, Appl. Phys. Lett. 80, 2275 (2002). 9. Y. G. Cao, X. L. Chen, Y. C. Lan, et al., J. Mater. Res. 15, 267 (2000). 10. X. Zhang, Y. T. Hou, Z. C. Feng, and J. L. Chen, J. Appl. Phys. 89, 6165 (2001). 11. S. Tripathy, S. J. Chua, P. Chen, and Z. L. Miao, J. Appl. Phys. 92, 3503 (2002).
Translated by A. Kazantsev