arXiv:cond-mat/0104042v2 [cond-mat.supr-con] 4 Apr 2001 ... Geophysical Laboratory and Center for High Pressure Research, Carnegie Institution of ...
Raman spectrum and lattice parameters of MgB2 as a function of pressure Alexander F. Goncharov, Viktor V. Struzhkin, Eugene Gregoryanz, Jingzhu Hu, Russell J. Hemley, Ho-kwang Mao,
arXiv:cond-mat/0104042v2 [cond-mat.supr-con] 4 Apr 2001
Geophysical Laboratory and Center for High Pressure Research, Carnegie Institution of Washington, 5251 Broad Branch Road NW, Washington D.C. 20015 U.S.A
G. Lapertot∗ , S. L. Bud’ko, P. C. Canfield Ames Laboratory and Department of Physics and Astronomy, Iowa State University, Ames, IA 50010 We report Raman spectra and synchrotron x-ray diffraction measurements of lattice parameters of polycrystalline MgB2 under hydrostatic pressure conditions up to 15 GPa. An anomalously broadened Raman band at 620 cm−1 is observed that exhibits a large linear pressure shift of its frequency. The large mode damping and Gr¨ uneisen parameter indicate a highly anharmonic nature of the mode, broadly consistent with theoretical predictions for the E2g in-plane boron stretching mode. The results obtained may provide additional constraints on the electron-phonon coupling in the system.
The newly discovered [1] high-temperature superconductor MgB2 has attracted considerable interest from theoretical and experimental points of view. Theory indicates that MgB2 can be treated as phonon mediated superconductor with very strong coupling [2–5]. Calculations show that the strongest coupling is realized for the near-zone center in-plane optical phonon (E2g symmetry) related to vibrations of the B atoms [3–5]. According to recent calculations, this phonon is very anharmonic because of its strong coupling to the partially occupied planar B σ bands near the Fermi surface [5]. The frequency of this phonon ranges from 460 to 660 cm−1 according to different computation techniques [2–6]. The phonon density of states for MgB2 has been determined by neutron inelastic scattering [5,7,8], but the E2g mode could not be detected separately. Raman experiment [9] indicated a presence of a broad mode at 72 meV (580 cm−1 ) in agreement with calculations for the E2g mode. Transport, magnetic susceptibility, and specific heat measurements show a large isotope effect consistent with phonon mediated superconductivity [10]. Pressure is an important variable, that can be used to tune physical properties and compare the results with theoretical predictions. Pressure effects on superconductivity studied to 1.84 GPa [11] and 0.5 GPa [12] show a decrease of Tc with the rate of 1.6 K/GPa and 1.11 K/GPa, respectively (see also Ref. [13]). Compressibility data have been obtained by neutron diffraction (to 0.62 GPa) [14] and synchrotron x-ray diffraction (to 6.15 GPa [15] and 8 GPa [16]). Based on theoretical calculations of the electronic density of states at the Fermi level, which show a very moderate decrease with pressure, the dominant contribution to the decrease of Tc under pressure has been proposed to be due to an increase in phonon frequency [17]. In this Letter we present Raman measurements of the phonon mode including the first measured under pres-
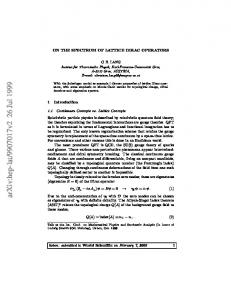
sure. We find that the E2g band is unusually broaden and shows a large positive pressure shift of the frequency. We also present x-ray diffraction data, which allow us to determine lattice parameters on the sample from the same batch in purely hydrostatic conditions to 12 GPa. As a result, we determined the E2g mode Gr¨ uneisen parameter, which is much larger than in case of ”normal” materials. We ascribe this to large anharmonic effects predicted by theory. The increase in phonon frequency measured in this work explains the reported TC drop with pressure. Samples of Mg10 B2 were similar to those used in Refs. [10,18]. They are essentially in a powdered form consisting of aggregates of 30-50 µm linear dimensions, which is ideal for high-pressure experiments. Our experiments have been done with various types of diamond anvil cells. In Raman experiments a long piston-cylinder cell was used and Ne served as a pressure transmitting medium [19]. Synthetic ultrapure diamonds were used as anvils to reduce background fluorescence. Raman scattering was excited in a 145◦ geometry (see Ref. [20]) to reduce further background from diamond Raman and that originating from spuriously reflected elastic light. The spectra were recorded with a single-stage spectrograph equipped with a CCD detector and holographic notch filters (150-5000 cm−1 ), although occasional measurements were also done with a conventional triple spectrometer to cover the lower frequency range. X-ray diffraction was measured with a two-side open diamond cell in an energy-dispersive configuration at X17C beamline of the National Synchrotron Light Source with 2θ=10◦ [21]. In the x-ray experiment we used helium as a pressure transmitting medium, which is purely hydrostatic to 12 GPa. Pressure was determined by the standard ruby fluorescence technique. All measurements were performed at room temperature. Figure 1 presents the Raman spectra at different pres1
the system is approaching (or departing from) a structural instability (e.g. Ref. [27]). The proposed assignment of the Raman peak observed to the first-order phonon scattering is not the only possible. Alternatively, if the first order scattering is inherently weak, the observed Raman peak can in principle be second order (e.g., due to overtones and combinations of the zone boundary acoustical phonons). However, this interpretation does not seem plausible because no higher frequency peak corresponding to combinations of acoustic and optical or two optical modes is observed. Also, the observed excitation may not necessarily be of phonon nature, but in principle could be a magnetic excitation [28] (e.g. two-magnon peak, which is strongly dependent on interatomic distances with γ=3.5 [29]). However, we believe that the data available strongly suggest the firstorder phonon interpretation because of the agreement with the calculated frequency [5,9] and the linewidth [9]. Theoretical calculations [5] suggest a scenario with the E2g phonon strongly coupled to electronic excitations. Our data show a very broad, strongly pressure dependent excitation, which is consistent with this idea. Conventional anharmonicity (not coupled to electronic degrees of freedom) is expected to exhibit some variation with pressure (see e.g. Ref. [30]), which is not the case. Within this picture, our data favor the coupling of the E2g phonon to the electronic subsystem. Finally, we address the observed strong pressure dependence of Tc [11–13]. Assuming a pressure independent density of electronic states N(0), the averaged electronion matrix element I and the Coulomb pseudopotential µ∗ , one can get dTc /dP=-1.5 K/GPa with physically reasonable values of µ∗ =0.005-0.1 and electron-phonon coupling constant λ=0.65-1 [2–5,17]. Thus, the pressure dependence of Tc can be easily explained by an increase in phonon frequency as proposed in Refs. [17]. In conclusion, we observed a strongly broadened Raman band of MgB2 that shows anomalously large pressure dependence of its frequency. This band and its pressure dependence can be interpreted as the E2g zone center phonon, which is strongly anharmonic because of coupling to electronic excitations. We acknowledge financial support of CIW, NSLS, NSF and Keck Foundation. Work at Ames laboratory was supported by the Director for Energy Research, Office of Basic Energy Sciences, U.S. Department of Energy.
sures. The broad band observed is a Raman excitation as shown by changing the excitation wavelength and by anti-Stokes measurements. It has also been checked that the signal originates from MgB2 because identical spectra were recorded by separate micro Raman measurements from individual micron-size grains (shown in Fig. 1 as the 0 GPa spectrum). Also, the Raman spectra contain a wide unstructured background component (presumably of electronic origin as in the cuprate HTSC materials [22]), which increases intensity at lower frequencies. Pressure leads to an increase in the frequency of the broad band without any appreciable change of its shape. The spectra can be fitted reasonably well with a combination of a linear background and a Gaussian peak. The frequency determined by this procedure is plotted as a function of pressure in Fig. 2. The pressure dependence is linear within the accuracy of the experiment. No essential pressure dependence of the mode damping was found (inset in Fig. 2). Factor-group analysis predicts for MgB2 (space group P 6/mmm, Z=1) B1g +E2g + A2u +E2u zone center optical modes, of which only E2g is Raman active. Thus, it is natural to assign the band observed at 620 cm−1 at ambient conditions to the E2g mode (see also Ref. [9]). The experimental frequency agrees well with theoretical calculations [5,9]. The anomalously large linewidth (FWHM=300 cm−1 ) can be ascribed to large electronphonon coupling [9], which will be described below. The experimental pressure dependencies of lattice parameters determined by x-ray diffraction are shown in Fig. 3. Our data are in good agreement with Refs. [14,16], while the results of Ref. [15] show systematically larger lattice parameters and yet comparable compressibility. We calculated the bulk modulus K0 assuming ”normal” behavior and K′0 =4, which is typical for covalent and metallic bonding [23](our data do not allow us to fit data with two parameters K0 and K′0 ). The result is 155(10) GPa in good agreement with Refs. [14,16,17]. Similar calculations for in-plane and out of plane compressibilities give βa =0.0016(2) GPa−1 and βc =0.0030(2) GPa−1 . Thus, the mode G¨runeisen parameter γ=K0 dlnν/dP determined from our data equals 2.9±0.3. In the case of anisotropic crystals it would be more appropriate to scale the frequency shift of in-plane mode with the variation of interatomic bond distance or lattice parameter a [24]. The corresponding component of the Gr¨ uneisen parameter (γ=dlnν/3dlna) is 3.9±0.4. These values are substantially larger than those expected for the phonon in a compound with covalent bonding [25], which should be dominant for this mode, where typically, γ does not exceed 2. For example, for graphite γ=1.06 [24] and for iron (with metallic bonding partially present in our case) γ=1.7 [20]. Larger γ’s are normally related to increased anharmonicity of the particular normal vibration [26]. It can also be a consequence of a soft mode behavior when
∗
2
On leave from Comissariat a l’Energie Atomique, DRFCM-SPSMS, 38054, Grenoble, France [1] J. Nagamatsu, N. Nakagawa, T. Muranaka, Y. Zenitani, and J. Akimitsu, Nature 410, 63 (2001).
[2] J. Kortus, I. I. Mazin, K. D. Belashchenko, V. P. Antropov, and L. L. Boyer (cond-mat/0101446). [3] J. M. An, W. E. Pickett, (cond-mat/0102391). [4] Y. Kong, O. V. Dolgov, O. Jepsen, and O. K. Andersen (cond-mat/0102499). [5] T. Yildirim et al., (cond-mat/0103469). [6] G. Satta et al., (cond-mat/0102358). [7] B. Osborn, E. A. Goremychkin, A. I. Kolesnikov, and D. J. Hinks (cond-mat/0103064). [8] T. J. Sato, K. Shibata, Y. Takano (cond-mat/0102468). %9 [9] K.-P. Bohen, R. Heid, and B. Renker (condmat/0102468). [10] S. L. Bud’ko et al., Phys. Rev. Lett. 86, 1877 (2001). [11] B. Lorenz, R. L. Meng and C. W. Chu (condmat/0102264). [12] T. Tomita et al., (cond-mat/0103538). [13] M. Monteverde et al., Science, in press. [14] J. D. Jorgensen, D. G. Hinks, and S. Short (condmat/0103069). [15] K. Prassides et al., (cond-mat/0102507). [16] T. Vogt et al., (cond-mat/0102480). [17] I. Loa and K. Syassen, (cond-mat/0102462), Solid State Commun., in press. [18] D. K. Finnemore et al., Phys. Rev. Lett. 86. 2420 (2001). [19] Neon freezes at 4.6 GPa at room temperature and remains a good pressure transmitting medium to substantially higher pressures [R. J. Hemley et al., Phys. Rev. B 39, 11820 (1989)]. [20] S. Merkel, A. F. Goncharov, H. K. Mao, P. Gillet, and R. J. Hemley. Science 288, 1626 (2000). [21] J. Z. Hu, H. K. Mao, Q. Z. Guo anf R. J. Hemley. In: Science and Technology of High Pressure, edited by M. H. Manghnani, W. J. Nellis, and M. F. Nicol (Universities Press, Hyderabad, India, Honolulu, Hawaii, 1999), Vol. 2, p. 1039. [22] G. Blumberg, M. Kang, M. V. Klein, K. Kadowaki, C. Kendziora. Science 278, 1427 (1997). [23] See, O. L. Anderson, J. Phys. Chem. Sol. 27, 547 (1966); T. S. Duffy and Y. Wang. In: Ultrahigh Pressure Mineralogy, edited by R. J. Hemley, Mineralogical Society of America, 1998, Washington D.C., Reviews in Mineralogy 37, p. 425. [24] M. Hanfland, H. Beister, K. Syassen, Phys. Rev. B 39, 12598 (1989). [25] W. Sherman, J. Phys. C: Solid St. Phys. 13, 4601 (1980); ibid 15, 9 (1982). [26] R. Zallen, Phys. Rev. B 9, 4485 (1974). [27] H. Olijnyk, Phys. Rev. Lett. 68, 2232 (1992); H. Olijnyk and A. P. Jephcoat, Phys. Rev. B 56, 10751 (1997). [28] N. Furukawa, (cond-mat/0103184). [29] M. J. Massey, U. Baier, R. Merlin, W. H. Weber, Phys. Rev. B 41, 7822 (1990). [30] A. Jayaraman, D. L. Wood, and R. G. Maines, Sr., Phys. Rev. B 35, 8316 (1987).
Raman Intensity (arb. units)
14.7 GPa
7.2 GPa
0 GPa
200
400
600
800
1000
-1
Raman Shift (cm )
FIG. 1. Raman spectra of MgB2 at elevated pressures. Spectra are shifted vertically for clarity. Points are experimental data and solid lines represent the phenomenological fits (see text) to the spectra in the appropriate spectral range. The excitation wavelength is 514.5 nm.
3
−∆a/a0, % 0
1
2
3
800
a
3.08
3.06
3.04 700 -1
FWHM (cm )
Raman Shift (cm-1)
750
650
0
2
4
0
2
4
6
8
10
12
6
8
10
12
320
3.52 300
3.50 5
10
3.48
15
c
0
0
5
10
15
3.46
Pressure (GPa)
3.44 3.42
Pressure (GPa)
FIG. 2. Raman frequency as a function of pressure and relative compression of the latice parameter a axis (upper scale). Points are experimental data of the frequencies determined from the phenomenological fits of the spectra. The solid line is a linear fit. Inset shows the pressure dependence of the damping obtained by the same fitting procedure.
FIG. 3. Experimental pressure dependences of the lattice parameters. Filled circles with solid line (Murnagan fit) are our data; thick solid lines are from Ref. [14]; dashed lines are from Ref. [15]; open circles and dotted lines are from Ref. [16].
4