A random variable is associated with a probability distribution over these real ...
Only finitely many possible values for the random variable: X ∈ {a1, a2, …, an}.
Good Review Materials http://www.imageprocessingbook.com/DIP2E/dip2e_downloads/review_material_downloads.htm
Random Variables and Random Vectors
• (Gonzales & Woods review materials) • Chapt. 1: Linear Algebra Review • Chapt. 2: Probability, Random Variables, Random Vectors
Tim Marks, Cognitive Science Department
Tim Marks, Cognitive Science Department
Random variables
Discrete random variables
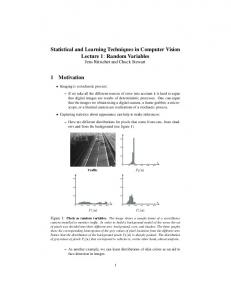
• Samples from a random variable are real numbers
• Discrete random variables have a pmf (probability mass function), P P(X = a) = P(a) • Example: Coin flip 1
– A random variable is associated with a probability distribution over these real values – Two types of random variables • Discrete – Only finitely many possible values for the random variable: X ∈ {a1, a2, …, an} – (Could also have a countable infinity of possible values) » e.g., the random variable could take any positive integer value – Each possible value has a finite probability of occurring.
X = 0 if heads X = 1 if tails – What is the pmf of this random variable?
• Continuous – Infinitely many possible values for the random variable – E.g., X ∈ {Real numbers}
P (a )
0.5
0 0
Tim Marks, Cognitive Science Department
Continuous random variables
• Discrete random variables have a pmf (probability mass function), P 1 P(X = a) = P(a) P (a ) • Example: Die roll
• Continuous random variables have a pdf (probability density function), p • Example: Uniform distribution p(x)
p(1.3) = ?
0 0 1
2
3
4
5
6
a
p(2.4) = ?
What is the probability that X = 1.3 exactly: P(X = 1.3) = ?
0.5
0.5
Tim Marks, Cognitive Science Department
a
Tim Marks, Cognitive Science Department
Discrete random variables
X ∈ {1, 2, 3, 4, 5, 6} – What is the pmf of this random variable?
1
1
2
x
Probability corresponds to area under the pdf. 1.5 P(1 < X < 1.5) = ∫? p(x) dx = 0.25
Tim Marks, Cognitive Science Department
1
–1
Continuous random variables
Random variables
• What is the total area under any pdf ?
• How much change do you have on you?
∞
– Asking a person (chosen at random) that question can be thought of as sampling from a random variable.
∫ p( x)dx = 1?
−∞
• Example continuous random variable: Human heights p(h)
p(h)
• Is the random variable “Amount of change people carry” discrete or continuous?
p(h)
h
h
h
Tim Marks, Cognitive Science Department
Tim Marks, Cognitive Science Department
Random variables: Mean & Variance
An important type of random variable
• These formulas can be used to find the mean and variance of a random variable when its true probability distribution is known. Definition Mean µ
µ = E(X)
Variance
E ((X − µ) 2 )
Var(X)
Discrete r.v.
Continuous r.v.
µ = ∑ ai P (ai )
µ=
2
i
∫ x p(x) dx
−∞
i
∑ (a − µ)
∞
∞
P(ai )
∫ (x − µ)
2
p(x) dx
−∞
i
Tim Marks, Cognitive Science Department
Tim Marks, Cognitive Science Department
The Gaussian distribution p(x) =
1 2π σ
e
Estimating the Mean & Variance −
( x − µ )2 2σ
2
X ~ N(µ, σ 2)
Tim Marks, Cognitive Science Department
– After sampling from a random variable n times, these formulas can be used to estimate the mean and variance of the random variable. • Samples x1, x2, x3, …, xn Estimated mean:
m=
1 n ∑ xi n i=1
Estimated variance:
σ2 =
1 n ∑ (x i − m)2 n i=1
σ2 =
1 ∑ (x i − m)2 ← unbiased estimate n −1 i=1
← maximum likelihood estimate
n
Tim Marks, Cognitive Science Department
–2
Finding mean, variance in Matlab
Example continuous random variable
– Samples x = [x1 x 2 x 3 L x n ] – Mean >> m = (1/n)*sum(x)
• People’s heights (made up)
– Variance 1 σ = [x1 − m n 2
Method 1: Method 2:
x1 − m x − m x 2 − m L x n − m] 2 M x n − m
>> v = (1/n)*(x-m)*(x-m)’ >> z = x-m >> v = (1/n)*z*z’
– Gaussian µ = 67 , σ2 = 20 • What if you went to a planet where heights Gaussian µ = 75 , σ2 = 5 – How would they be different from us?
Tim Marks, Cognitive Science Department
Tim Marks, Cognitive Science Department
Example continuous random variable • Time people woke up this morning – Gaussian µ = 9 , σ2 = 1
Random vectors – An n-dimensional random vector consists of n random variables that are all associated with the same events. – Example 2-D random vector: X V = Y
where X is random variable of human heights Y is random variable of wake-up times
– Sample n times from V. v1 v 2 L v n x1 x 2 L x n y1 y 2 L y n Tim Marks, Cognitive Science Department
Random Vectors • What will the graph of V look like?
67 m = 10
Tim Marks, Cognitive Science Department
x (heights)
Mean of a random vector • Estimating the mean of a random vector
Mean – Mean of X is 67 – Mean of Y is 10
y (wake-up times)
Tim Marks, Cognitive Science Department
– n samples from V
• What is mean of V ?
Let’s collect some samples and graph them:
m=
v1 v 2 L v n x1 x 2 L x n y1 y 2 L y n
n n 1 1 x m x v i = ∑ i = ∑ n i=1 n i=1 y i m y
– To estimate mean of V in Matlab >> (1/n)*sum(v,2) Tim Marks, Cognitive Science Department
–3
Random vector – Example 2-D random vector: X V = Y
where X is random variable of human heights Y is random variable of human weights v1 v 2 L v n x1 x 2 L x n y1 y 2 L y n
• Sample n times from V
– What will graph look like?
Covariance of two random variables • Height and wake-up time are uncorrelated, but height and weight are correlated. • Covariance Cov(X, Y) = 0 for X = height, Y = wake-up times Cov(X, Y) > 0 for X = height, Y = weight – Definition: Cov(X,Y ) = E ((X − µx )(Y − µy )) If Cov(X, Y) < 0 for two random variables X, Y , what would a scatterplot of samples from X, Y look like?
Tim Marks, Cognitive Science Department
Tim Marks, Cognitive Science Department
Estimating covariance from samples • Sample n times: Cov(X,Y ) = Cov(X,Y ) =
x1 y1
Estimating covariance in Matlab – Samples
x2 L xn y2 L yn
– Means mx ← m_x my ← m_y
x = [x1 x 2 x 3 L x n ] y = [y1 y 2 y 3 L y n ]
1 n ∑ (x i − mx )(y i − my ) n i=1
← maximum likelihood estimate
1 n ∑ (x i − mx )(y i − my ) n −1 i=1
← unbiased estimate
– Covariance 1 Cov(X,Y ) = [x1 − m x n
x 2 − mx
y1 − m y y 2 − my L x n − mx ] M y n − my
• Cov(X, X) = ?Var(X)
Method 1: >> v = (1/n)*(x-m_x)*(y-m_y)’
• How are Cov(X, Y) and Cov(Y, X) related?
Method 2: >> w = x-m_x >> z = y-m_y >> v = (1/n)*w*z’
Cov(X, Y) = Cov(Y, X) Tim Marks, Cognitive Science Department
Covariance matrix of a D-dimensional random vector
(
X − µX = E [X − µX Y − µY
Example covariance matrix • People’s heights (made up)
• In 2 dimensions X V = Y T Cov(V) = E (V − µ )(V − µ )
Tim Marks, Cognitive Science Department
X ~ N(67, 20)
) Var(X ) Cov(X,Y ) Y − µY ] = Var(Y) Cov(X,Y )
• In D dimensions T Cov(V) = E ((V − µ )(V − µ ) ) • When is a covariance matrix symmetric? A. always, B. sometimes, or C. never Tim Marks, Cognitive Science Department
• Time people woke up this morning Y ~ N(9, 1)
• What is the covariance matrix of
X V = Y
?
20 0 0 1
Tim Marks, Cognitive Science Department
–4
Estimating the covariance matrix from samples (including Matlab code) – Sample n times and find mean of samples v1 v 2 L v n
x V = 1 y1
x2 L xn y2 L yn
1 Cov(V ) = n
x1 − m x y1 − m y
• 1-dimensional Gaussian is completely determined by its mean, µ, and variance, σ 2 :
mx m= my
– Find the covariance matrix
x1 − mx x 2 − mx L x n − mx x 2 − mx y 2 − my L y n − my M x n − mx
>> m = (1/n)*sum(v,2) >> z = v - repmat(m,1,n) >> v = (1/n)*z*z’ Tim Marks, Cognitive Science Department
Gaussian distribution in D dimensions
X ~ N(µ, σ 2) y1 − m y y 2 − my M y n − my
p(x) =
1 2π σ
e
−
(x− µ )2 2σ
2
• D-dimensional Gaussian is completely determined by its mean, µ, and covariance matrix, Σ : X ~ N(µ, Σ)
p(x) =
1 (2π )
D/2
Σ
1/ 2
e
− 12 (x−µ )T Σ −1 (x−µ )
–What happens when D = 1 in the Gaussian formula? Tim Marks, Cognitive Science Department
–5