Chapter 2. Random Variables: Fundamentals of Probability Theory and Statistics.
A fundamental concept for any statistical treatment is that of the random ...
Chapter 2
Random Variables: Fundamentals of Probability Theory and Statistics
A fundamental concept for any statistical treatment is that of the random variable. Thus this concept and various other closely related ideas are presented at the beginning of this book. Section 2.1 will introduce event spaces, probabilities, probability distributions, and density distributions within the framework of the Kolmogorov axioms. The concept of random variables will then be introduced, initially in a simplified form. In Sect. 2.2 these concepts will be extended to multidimensional probability densities and conditional probabilities. This will allow us to define independent random variables and to discuss the Bayes’ theorem. Section 2.3 will deal with characteristic quantities of a probability density, namely, the expectation value, variance, and quantiles. Entropy is also a quantity characterising a probability density, and because of its significance a whole section, Sect. 2.4, is devoted to entropy. In particular, relative entropy, i.e., the entropy of one density relative to another, will be introduced and the maximum entropy principle will be discussed. In Sect. 2.5, the reader will meet the calculus of random variables; the central limit theorem in a first simple version is proven, stressing the importance of the normal random variable; various other important random variables are also presented here. Because many questions in statistical mechanics can be reduced to the formulation of limit theorems for properly normalized sums of random variables with dependencies given by a model, the subsequent sections present further discussion of the concept of a limit distribution. Section 2.6 introduces renormalization transformations and the class of stable distributions as fixed points of such transformations. Domains of attraction are discussed and the distributions in such domains are characterized by their expansion in terms of eigenfunctions, which themselves are obtained by a stability analysis. Finally, Sect. 2.7 addresses the large deviation property for a sequence of random variables YN ; N D 2; : : : and it is shown how the characteristic features of the density of YN can then be revealed. It can already be seen that the shape of the density of YN may, as a function of an external parameter, become bimodal so that in the thermodynamic limit N ! 1 not only one but two equilibrium states exist. Thus the phenomenon of different phases and of a phase transition can already be demonstrated on this level. J. Honerkamp, Statistical Physics, Graduate Texts in Physics 38, DOI 10.1007/978-3-642-28684-1 2, © Springer-Verlag Berlin Heidelberg 2012
5
6
2 Random Variables: Fundamentals of Probability Theory and Statistics
2.1 Probability and Random Variables During the course of history many people devoted much thought to the subject of probability (Schneider 1986). For a long time people sought in vain to define precisely what is meant by probability. In 1933 the Russian mathematician A. N. Kolmogorov formulated a complete system of axioms for a mathematical definition of probability. Today this system is the basis of probability theory and mathematical statistics. We speak of the probability of events. This means that a number is assigned to each event and this number should represent the probability of this event. Let us consider throwing a die as an example. In this case each possible event is an outcome showing a certain number of points, and one would assign the number 1/6 to each event. This expresses the fact that each event is equally likely, as expected for a fair die, and that the sum of the probabilities is normalized to 1. The Kolmogorov system of axioms now specifies the structure of the set of events and formulates the rules for the assignment of real numbers (probabilities) to these events.
2.1.1 The Space of Events We consider a basic set ˝, whose elements consist of all possible outcomes of an experiment, irrespective of whether this experiment can actually be performed or is only imaginable. A single performance of this experiment is called a realization. It yields an element ! in ˝. We now want to identify events as certain subsets of ˝. One may think of events as the sets f!g, which contain one single element !, and as such represent elementary events. However, one may also think of other sets which contain several possible outcomes, because the probability that the outcome of a realization belongs to a certain set of outcomes might also be interesting. A more detailed mathematical analysis reveals that in general not all subsets of ˝ can be considered as events to which one can assign a probability. Only for certain subsets, which can be made members of a so-called Borel space, can one always consistently introduce a probability. Here, a Borel space is a set B of subsets of ˝, for which: • ˝2B • If A 2 B then AN 2 B, where AN is the complement of A • If A; B 2 B then A [ B 2 B and, more generally, the union of countably many (i.e., possibly infinitely many) sets in B also belongs to B.
2.1 Probability and Random Variables
7
For sets of a Borel space the axioms imply immediately that ; 2 B. Furthermore, N for A; B 2 B we also have A \ B 2 B, since A \ B D AN [ B. Of course, a Borel space should be defined in such a way that all possible outcomes of an experiment are really contained in this space. Remarks. • We should distinguish between experimental outcomes and events. Each experimental outcome ! is an event f!g, but not every event is an experimental outcome, because an event which does not correspond to an elementary event contains many outcomes. We want to assign a consistent probability not only to experimental outcomes, but to all events. • Frequently, a set of events fA1 ; : : : ; AN g is given such that Ai \ Aj D ; for i ¤ j , and A1 [ � � � [ AN D ˝:
(2.1)
Such a set is called complete and disjoint. Examples. • When we throw a die the outcomes are the elementary events fi g; i D 1; : : : ; 6. Further examples of events are f1; 2g (points smaller than 3) or f1; 3; 5g (points are odd). Hence, not only the probability for the elementary outcome f1g may be of interest, but also the probability that the points are odd. We have f1g [ � � � [ f6g D ˝ � f1; : : : ; 6g: (2.2) • The Borel space may contain all intervals fx1 � x � x2 g on the real axis. It then also contains all points and all open intervals, as well as the event fx � �g for � 2 R. Subsets not belonging to this Borel space can only be defined by complicated mathematical constructions (see e.g. Dudley 1989). We do not want to pursue this any further, because such sets are not relevant in physical considerations.
2.1.2 Introduction of Probability Having dealt with the space of events we can now introduce the notion of probability. To each event A in the space of events B we assign a real number P.A/, the probability of A. This assignment has to satisfy the following properties: • P.A/ � 0 for all A 2 B, • P.˝/ D 1, • Let Ai ; i D 1; : : : be countably many (i.e. possibly infinitely many) disjoint sets in B with Ai \ Aj D ; for i ¤ j , then
8
2 Random Variables: Fundamentals of Probability Theory and Statistics
P.[Ai / D
X
P.Ai /:
(2.3)
i
These three conditions are certainly necessary for P.A/ to be a probability. It was the achievement of Kolmogorov to show that these three requirements allow a complete and consistent definition of such an assignment for all events. Note that we have introduced probability without saying what it means, i.e., how to measure it. We have merely introduced an assignment which has all properties one would expect of the notion of probability. In Part II we will deal with the measurement of probabilities and of quantities which are calculated from probabilities. Remarks. N D P.˝/ D 1 we find P.A/ � 1. • From P.A/ C P.A/ • It can be shown: P.A1 / � P.A2 /, if A1 � A2 . • More general, the following can be shown: P.A1 [ A2 / D P.A1 / C P.A2 / � P.A1 \ A2 /:
(2.4)
Examples. For the throw of a die, for example, we take P.fi g/ D 1=6 for i D 1; : : : ; 6. Hence we have, e.g., P.f1; 3g/ D 1=3, P.f1; 3; 5g/ D 1=2, P.f2; 4; 5; 6g/ D 2=3, P.f1; 3g/ < P.f1; 3; 5g/. Next we will consider the Borel space containing the intervals and points on the real axis. We introduce the probabilities of all events by defining the probabilities P.fx � �g/ for the sets fx � �g for all �. The function P.fx � �g/ will be denoted by P .�/ and is called the probability distribution. This function satisfies: � ! C1 W
P .�/ ! P.˝/ D 1;
(2.5a)
� ! �1 W
P .�/ ! P.;/ D 0:
(2.5b)
When P .�/ is differentiable we also consider %.�/ D from which we get
Z P .�/ D
dP .�/ ; d�
(2.6)
�
%.x/ dx:
(2.7)
�1
Using %.x/ we may now calculate the probability for any interval fx1 � x � x2 g and represent it as Z P.fx1 � x � x2 g/ D
x2
%.x/ dx: x1
(2.8)
2.1 Probability and Random Variables
9
In particular, we have Z
C1
%.x/ dx D 1;
(2.9)
�1
and also P.fxg/ D 0:
(2.10)
If dx is small enough, %.x/ dx is the probability of the event .x; x Cdx/. In other words it is the probability of obtaining a value x 0 2 .x; x C dx/ as the result of a realization (i.e., the performance of an experiment). The function %.x/ is referred to as the density function or density distribution. In physics and certain other fields the name ‘distribution function’ is also frequently used. In the mathematical literature, however, the latter name is reserved for the function P .�/.
2.1.3 Random Variables A discrete random variable is a collection of possible elementary events together with their probabilities. A ‘realization’ of a random variable yields one of the elementary outcomes and it does so with the probability which has been assigned to this elementary event. When we throw a die the random variable ‘number of spots’ is realized. The possible realizations are the numbers 1–6, each with probability 1/6. Hence, to characterize a random variable one has to list the possible elementary events (realizations) together with their probabilities. Each realization will yield an outcome which in general is different from the previous one. Where these outcomes are numbers, they are also called random numbers. If the possible realizations (outcomes) do not form a discrete set but a continuum in R, the collection cannot contain the probabilities of all elementary events, but instead the distribution function P .�/ or the density %.x/. If we denote the possible outcomes (realizations) by x, the random variable will be denoted by X , the corresponding distribution function by PX .�/, and the density by %X .x/. Hence, the random variable X is defined by the set of its possible realizations together with the probability density %X .x/ or the probability distribution PX .�/. We have P.fxjx � �g/ D PX .�/ and
(2.11)
dPX .x/ : (2.12) dx One may also consider functions Y D f .X / of random variables. Y is the random variable with the realizations y D f .x/ given the realization x of X , and the %X .x/ D
10
2 Random Variables: Fundamentals of Probability Theory and Statistics
distribution function is PY .�/ D P.fxjf .x/ � �g/:
(2.13)
In Sect. 2.5 we will see how to perform calculations with random variables. In the mathematical literature (see e.g. Kolmogoroff 1933; Feller 1957) the concept of a random variable is often introduced in a more general way. One usually proceeds from a general basic set ˝. The events of the Borel space B should be measurable, but they do not have to be intervals of the real axis. The random variables are then defined as mappings X.!/ of the outcomes ! onto the real axis, and the sets fxjx � �g are replaced by the sets A� D f!jX.!/ � �g; � 2 R, to which a probability is assigned. For this to be consistent, one has to require A� 2 B; � 2 R. Having physical applications in mind, we have defined the basic set ˝ to be the real axis and, consequently, were able to choose the mapping as the identity. In this way, the concept of a random variable is very simple. However, the generalization of this concept is straightforward. Some important random variables are the following: (a) Let the set of the possible realizations of X be the real numbers in the interval .a; b/ with uniform probability. Then %X .x/ D
1 : b�a
(2.14)
Almost every computer provides a more or less reliable random number generator which claims to yield uniformly and independently distributed random numbers on the interval .0; 1/. (b) The Gaussian or normal distribution: The set of possible realizations of X are all real numbers. The density is � � .x � �/2 %X .x/ D p exp � : 2� 2 2�� 1
(2.15)
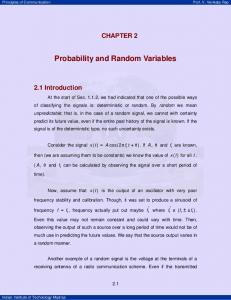
Here %X .x/ represents a normal curve with a maximum at x D � and a width characterized by �. For larger values of � the curve gets broader, but also flatter (see Fig. 2.1). %X .x/ is the density function of the Gaussian distribution, which is also called the normal distribution N.�; � 2 /. For � D 0 and � D 1 one also speaks of the standard normal distribution. Normal random variables (i.e., random variables with a normal distribution) will play an important role in subsequent discussions and we will frequently return to them. (c) The binomial distribution (also called the Bernoulli distribution): Let K be the discrete random variable with possible realizations k D 0; 1; : : : ; n and the (discrete) probability density
2.1 Probability and Random Variables
11
0.8 σ = 0.5 0.6
σ=1
ρX(x) 0.4
σ = 1.5 0.2
0 −3
−2
−1
0 x
1
2
3
Fig. 2.1 Density function of the Gaussian distribution for various values of �
! n k B.n; pI k/ D p .1 � p/n�k ; k
k D 0; 1; : : : ; n:
(2.16)
Such a probability for a realization k occurs (naturally) in the following way: Let X be a random variable with the only two possible outcomes x1 (with probability p) and x2 (with probability .1 � p/ ). Now consider an n-fold realization of X . K then represents the multiplicity of the occurrence of x1 . An example of this latter case is the following: Consider two adjoining boxes of volumes V1 and V2 . Through a hole in a dividing wall particles of a gas can be exchanged. A particle will be in the volume V1 with probability p D V1 =.V1 CV2 / and in V2 with probability 1�p D V2 =.V1 C V2 /. For a total of n particles we will find k particles in volume V1 with probability ! n � V1 �k � V2 �n�k B.n; pI k/ D k V1 C V2 V1 C V2 ! n � V1 �k � V2 �n D : V1 C V2 k V2
(2.17)
(2.18)
Of course, we should expect that B.n; pI k/ has a maximum at k D np D n V1 =.V1 C V2 /. This will be confirmed later (see Fig. 2.2, left). (d) The Poisson distribution: Let K be the discrete random variable with possible realizations k D 0; 1; : : : and the discrete density
12
2 Random Variables: Fundamentals of Probability Theory and Statistics 0.25
0.2
ρ(λ;k)
B(n,p;k) 0.2
0.15
λ=6
n = 40, p = 0.5 0.15
0.1
0.1
0.05 0
0.05
0
10
20 k
30
0
40
0
5
10
15
k
Fig. 2.2 Densities of the binomial distribution (left ) and the Poisson distribution (right )
%.�I k/ D
�k �� e ; kŠ
k D 0; 1; : : : :
(2.19)
The density %.�I k/ results from B.n; pI k/ in the limit p ! 0; n ! 1 and p n D � D const. K is equal to the number of events occurring within a time interval .0; T /, if the probability for the occurrence of one event within the time interval dt is just p D � dt=T . To see this, we divide the time interval .0; T / into n equal segments of length dt D T =n. Then pD
� � T D ; T n n
(2.20)
and the probability that in k of these n segments one event occurs is then just given by B.n; pI k/ of (2.16). For n ! 1 one takes dt ! 0 and p ! 0 such that p n D � remains constant. The density function is shown in Fig. 2.2(right). It will turn out in Sect. 2.3 that � is the average number of events in the time interval .0; T /. Radioactive decay provides a physical example of the Poisson distribution. We consider a radioactive element with a radiation activity of ˛ Becquerel, i.e., on average ˛ decays occur within 1 s. Then we have �=T D ˛ s�1 . The probability that no decay occurs within a time interval of T seconds is %.� D ˛T I k D 0/ D e�˛T ;
(2.21)
and the probability of just one decay within the time interval T is %.� D ˛T I k D 1/ D ˛T e�˛T :
(2.22)
2.2 Multivariate Random Variables and Conditional Probabilities
13
2.2 Multivariate Random Variables and Conditional Probabilities 2.2.1 Multidimensional Random Variables In analogy to the definition of random variables one can introduce d -dimensional random vectors X D .X1 ; : : : ; Xn / as n component random variables. In this case the basic space of possible outcomes is Rn , and events are, among other things, domains in Rn as cartesian products of events belonging to the Borel spaces of the components. The probability density is now a function %.x1 ; : : : ; xn / on Rn . The probability that a realization of X1 yields a value in the interval .x1 ; x1 C dx1 ), and, similarly, that realizations of X2 ; : : : ; Xn yield values in the corresponding intervals is %.x1 ; : : : ; xn /dx1 : : : dxn . Two examples will help to clarify this: In a classical description, the momentum p of a particle with mass m in a gas may be considered as a (three-dimensional) random variable. For the density distribution one obtains (see (2.29)) � � p2 1 ; %.p/ D exp �ˇ A 2m
where
ˇD
1 : kB T
(2.23)
Here T represents the temperature, kB is Boltzmann’s constant, and A is a normalization constant. The density %.p/ in (2.23) is thus given by a three dimensional Gaussian distribution. The general n-dimensional (or ‘multivariate’) Gaussian distribution reads � � 1 .2�/�n=2 �1 .x � �/ (2.24) exp � .A / .x � �/ %.�; AI x/ D i ij j : .det A/1=2 2 Here we have used the summation convention, i.e. one has to sum over all indices appearing twice. The vector � and the matrix A are parameters of this distribution. As our second example of a multivariate distribution we consider a gas of N classical particles characterized by the momenta and positions of all particles: .p; q/ D .p 1 ; : : : ; p N ; q 1 ; : : : ; q N /:
(2.25)
We will describe this state at each instant by a 6N -dimensional random vector. When the volume and the temperature of the gas are specified, one obtains for the probability density in statistical mechanics (see (3.49)) %.p; q/ D
1 �ˇH.p;q/ e ; A
ˇD
1 ; kB T
(2.26)
14
2 Random Variables: Fundamentals of Probability Theory and Statistics
where again T denotes the temperature, kB Boltzmann’s constant, and A a normalization constant. Furthermore, H.p; q/ is the Hamiltonian function for the particles in the volume V . This density is also called the Boltzmann distribution.
2.2.2 Marginal Densities When one integrates over some of the variables of a multidimensional probability density, one obtains a probability density describing the probability for the remaining variables, irrespective of the values for those variables which have been integrated over. Let, for instance, Z
0
% .x1 / D
dx2 : : : dxn %.x1 ; x2 ; : : : ; xn /;
(2.27)
then %0 .x1 / dx1 is the probability of finding X1 in the interval Œx1 ; x1 C dx1 �, irrespective of the outcome for the variables X2 ; : : : ; Xn . This may be illustrated for the case of the Boltzmann distribution (2.26). With the Hamiltonian function H D
N X p2i C V .q 1 ; : : : ; q N /; 2m i D1
(2.28)
one obtains, after taking the integral over p2 ; : : : ; pN ; q 1 ; : : : ; q N , the probability density (2.23) for a single particle, in this case in the form � � 1 p 21 % .p1 / D 0 exp �ˇ : A 2m 0
(2.29)
2.2.3 Conditional Probabilities and Bayes’ Theorem With the Boltzmann distribution (2.26) we have already met a distribution where certain given parameters need to be included explicitly, for instance, the temperature T and the volume V . The number of particles N may also be counted among these given parameters. In probability theory one writes A j B for an event A under the condition that B is given. So the probability P.A/ is then more precisely denoted by P.A j B/, i.e., the probability of A when B is given. P.A j B/ is called the conditional probability. This notion extends to the probability densities. The Boltzmann distribution can therefore be written as %.p; q j T; V; N /;
(2.30)
2.2 Multivariate Random Variables and Conditional Probabilities
15
or in words, the probability density for the positions and momenta at given temperature, volume, and number of particles. In the same way, %.px j py ; pz / is the probability density for the x-component of the momentum of a particle under the condition that the y- and z-components are given. One may form P.A; B/ D P.A j B/P.B/;
(2.31)
which is the joint probability for the occurrence of A and B. If B is an event in the same Borel space as A, then the joint probability P.A; B/ is equivalent to P.A\B/. One may also define the conditional probability by P.A j B/ D
P.A; B/ : P.B/
(2.32)
If the denominator P.B/ vanishes, it is also not meaningful to consider the conditional probability P.A j B/. Similarly, conditional densities might also be introduced by using the multivariate probability densities, e.g., %.px j py ; pz / D
%.px ; py ; pz / : %.py ; pz /
(2.33)
Example: Consider a fair die and B D f2; 4; 6g, A D f2g. (Here A and B belong to the same Borel space.) Then P.A j B/ D
P.A \ B/ P.A/ 1=6 1 D D D : P.B/ P.B/ 1=2 3
(2.34)
The probability for the event f2g, given the number of points is even, is 1=3. Obviously also P.B j A/ D 1. We note that if N [
Bi D ˝
(2.35)
i D1
is a disjoint, complete partition of ˝ (such that Bi \ Bj D ; and the union of all Bi is equal to the total set ˝), then obviously P.A/ D P.A; ˝/ D
N X i D1
P.A; Bi / D
N X i D1
P.A j Bi /P.Bi /:
(2.36)
16
2 Random Variables: Fundamentals of Probability Theory and Statistics
This should be compared with the formula Z %X1 .x1 / D
Z dx2 %X1 ;X2 .x1 ; x2 / D
dx2 %.x1 j x2 / %X2 .x2 /:
(2.37)
In the remainder of this section we describe two useful statements about conditional probabilities. Independence of Random Variables Let A1 and A2 be two events (in the same, or possibly in different Borel spaces). A1 is said to be independent of A2 if the probability for the occurrence of A1 is independent of A2 , i.e., P.A1 j A2 / D P.A1 /:
(2.38)
In particular we have then also: P.A1 ; A2 / D P.A1 /P.A2 /:
(2.39)
If A1 is independent of A2 , then A2 is also independent of A1 : Statistical (in)dependence is always mutual. Similarly, the joint density of two independent random variables may be written as %X1 ;X2 .x1 ; x2 / D %X1 .x1 / %X2 .x2 /:
(2.40)
P.A; B/ D P.A j B/P.B/ D P.B j A/P.A/
(2.41)
Bayes’ Theorem From
it follows that P.B j A/ D
P.A j B/P.B/ : P.A/
(2.42)
Hence P.B j A/ can be determined from P.A j B/, if the a priori probabilities P.A/ and P.B/ are known. This statement was first formulated by the English Presbyterian and mathematician Thomas Bayes (1702–1761) in an essay that was found after his death.
2.2 Multivariate Random Variables and Conditional Probabilities
17
Bayes’ theorem is a very useful relation for determining the a posteriori probabilities P.B j A/. It has enormous numbers of applications, of which we merely give two examples here. (a) A company which produces chips owns two factories: Factory A produces 60% of the chips, factory B 40%. So, if we choose at random one chip from the company, this chip originates from factory A with a probability of 60%. We further suppose that 35% of the chips coming from factory A are defective, but only 25% of those coming from factory B. Using Bayes’ theorem one can determine the probability that a given defective chip comes from factory A. Let d be the event ‘the chip is defective’, A the event N the event ‘the chip comes from ‘the chip comes from factory A’, and B.D A/ factory B’. From Bayes’ theorem we then have P.Ajd / D
P.d jA/ � P.A/ P.d jA/ � P.A/ D : P.d / P.d jA/ � P.A/ C P.d jB/ � P.B/
(2.43)
Inserting the numbers P.A/ D 0:60; P.d jA/ D 0:35; P.d jB/ D 0:25 yields a value of P.Ajd / D 0:68. In the same manner we can determine the probability of having a certain illness when the test for this illness showed positive. Luckily enough, this is not as large as one might first expect. Let A be the event ‘the illness is present’ and B the event N yield the ‘the test is positive’. The conditional probabilities P.BjA/ and P.BjA/ probabilities that a test has been positive for a sick patient and a healthy patient, N A/ N D 1�P.BjA/ N the specificity respectively. P.BjA/ is called the sensitivity, P.Bj of the test. The probability P.A/ that the illness is present at all is in general of the order of magnitude 0:01 � 0:001. From this a surprisingly small value for the probability of being ill may result even if the test has been positive. In numbers: If we set e.g. N D 0:01 one obtains P.BjA/ D 0:95 and P.BjA/ P.AjB/ � P.patient is ill j test is positive/ 1 D .1 � P.A// 1 C 0:0105 P.A/ 8 1 1 ˆ ˆ � 0:087 for P.A/ D < 1 C 10:5 1000 D 1 1 ˆ ˆ : � 0:490 for P.A/ D : 1 C 1:04 100
(2.44a) (2.44b)
(2.44c)
Hence, the results depend sensitively on the probability P.A/, i.e., on the overall N the probability that the test is positive for frequency of the illness and on P.B j A/, a healthy patient.
18
2 Random Variables: Fundamentals of Probability Theory and Statistics
(b) An amusing application of Bayes’ theorem is in solving the following problem, which we cite from von Randow (1992): You are taking part in a TV game show where you are requested to choose one of three closed doors. Behind one door a prize is waiting for you, a car, behind the other two doors are goats. You point at one door, say, number one. For the time being it remains closed. The showmaster knows which door conceals the car. With the words ‘I’ll show you something’ he opens one of the other doors, say, number three, and a bleating goat is looking at the audience. He asks: ‘Do you want to stick to number one or will you choose number two?’.
The correct answer is: It is more favorable to choose number 2, because the probability that the car is behind this door is 2/3, whereas it is only 1/3 for door number 1. Intuitively, most people guess that the probabilities for both remaining possibilities are equal and that the candidate has no reason to change his mind. In the above mentioned booklet one can read about the turmoil which was caused by this problem and its at first sight surprising solution after its publication in America and Germany. We define (von Randow 1992): A1: the event that the car is behind door number 1, and similarly A2 and A3. M1: the event that the showmaster opens door number 1 with a goat behind; similarly M 2 and M 3. As we have denoted the door the showmaster has opened as number 3 we are interested in P.A1 j M 3/
and
P.A2 j M 3/:
(2.45)
Are these probabilities equal or different? First argument (not using Bayes’ theorem): P.A1 j M 3/ is independent of M 3, because the showmaster acts according to the rule: Open one of the doors that the candidate has not chosen and behind which is a goat. So P.A1 j M 3/ D P.A1/ D 1=3;
(2.46)
from which follows P.A2 j M 3/ D 2=3. Second argument (using Bayes’ theorem): We have P.A2 j M 3/ D
P.M 3 j A2/P.A2/ : P.M 3/
(2.47)
2.3 Moments and Quantiles
19
Now P.A2/ D 1=3;
(2.48a)
P.M 3 j A2/ D 1;
(2.48b)
P.M 3 j A1/ D 1=2;
(2.48c)
P.M 3/ D P.M 3 j A1/P.A1/ C P.M 3 j A2/P.A2/ D 1=2 � 1=3 C 1 � 1=3 D 1=2;
(2.48d)
and therefore P.A2 j M 3/ D 2=3:
(2.49)
P.A1 j M 3/ D 1=3:
(2.50)
Similarly, one obtains: One can simulate the game on a computer and will find that after N runs in approximately 2N=3 cases the goat is behind door 2, so that a change of the chosen door is indeed favorable.
2.3 Moments and Quantiles 2.3.1 Moments Let X be a random vector in Rn with the distribution %.x/. The expectation value of a function H.X / of the random variable X is then defined as Z hH.X /i D
dn x H.x/ %.x/:
(2.51)
In the mathematical literature, the expectation value of H.X / is also written as E.H.X //. A particularly important moment is Z � � E.X/ � hX i D
dn x x %.x/;
(2.52)
which is the expectation value of the random variable itself. (Any possible outcome is multiplied by its probability, i.e., one forms x %.x/ dn x, and then the sum is taken over all possible outcomes). Some other important properties of moments and relations involving them are the following:
20
2 Random Variables: Fundamentals of Probability Theory and Statistics
• When H.x/ is a monomial of degree m, the expectation value is also called the mth moment of the distribution function. Hence, the mth moment for a scalar random variable is simply Z hX m i D
dx x m %.x/:
(2.53)
• An important combination of moments is the variance. For a scalar random variable it is given by: � �2 Var.X / D h X � hX i i D hX 2 i � hX i2 Z D dx .x � hX i/2 %.x/:
(2.54a) (2.54b)
Hence, the variance is the expectation value of the squared deviation of the random variable X from the expectation value hX i. Therefore, the pmore scattered the realizations of X are around hX i, the larger the variance is. Var.X / is also called the standard deviation. For the one-dimensional Gaussian distribution %.�; � 2 I x/ given in (2.15) one obtains hX i D �; (2.55) and
Z
1
Var.X / D
dx .x � �/2 %.�; � 2 I x/ D � 2 ;
(2.56)
�1
i.e., the parameter � 2 in (2.15) is identical to the variance of the normal distribution. The higher moments of the normal distribution are easily calculated: � h.X � �/k i D
0; if k is odd, 1 � 3 � : : : � .k � 1/ � � k ; if k is even.
(2.57)
• For a multivariate distribution we may define second moments with respect to different components, for example, Z hXi Xj i D
dn x xi xj %.x1 ; : : : ; xn /:
(2.58)
In analogy to the variance we now define a covariance matrix: Cov.Xi ; Xj / � �ij2 � h.X � �/i .X � �/j i Z D dn x .xi � �i / .xj � �j /%.x1 ; : : : ; xn /:
(2.59a) (2.59b)
2.3 Moments and Quantiles
21
For the multivariate normal distribution given in (2.24) we get hX i D �;
(2.60)
h.X � �/i .X � �/j i D Aij :
(2.61)
and
Hence, the matrix A in the expression of the multivariate normal distribution given in (2.24) is the covariance matrix for the normal distribution. • The correlation between two random variables Xi ; Xj is obtained from the covariance by normalization: �ij2 Cov.Xi ; Xj / : Cor.Xi ; Xj / D p D �i i �jj Var.Xi /Var.Xj /
(2.62)
When Xi and Xj are mutually independent, one obtains immediately Cor.Xi ; Xj / D Cov.Xi ; Xj / � 0:
(2.63)
On the other hand, if the correlation or the covariance of two random variables vanishes one can in general not conclude that they are statistically independent. Only when Xi and Yj are both normally distributed, is this conclusion correct, because in this case the covariance matrix, and hence also the matrix A in (2.24), is diagonal, and the total density function is the product of the density functions of the individual random variables. • An important expectation value for a probability density is Z G.k/ � he
ikX
iD
dx eikx %X .x/;
(2.64)
which is called the characteristic function. G.k/ is thus the Fourier transform of the density function. When all moments exist, G.k/ can be expanded in a power series and the coefficients contain the higher moments: G.k/ D
1 X .ik/n nD0
nŠ
hX n i:
(2.65)
The expansion of ln G.k/ with respect to k yields a power series, in which the so-called cumulants �n appear: ln G.k/ D
1 X .ik/n nD1
nŠ
�n ;
(2.66)
22
2 Random Variables: Fundamentals of Probability Theory and Statistics
with the cumulants �1 D � D hX i
(2.67a)
�2 D Var.X / D hX i � hX i 2
2
�3 D hX 3 i � 3hX 2 ihX i C 2hX i3;
(2.67b) (2.67c)
and so on for higher cumulants. It is now important to note that the Fourier transform of the Gaussian or normal distribution is � � 1 2 2 G.k/ D exp i�k � � k ; (2.68) 2 i.e., one obtains for the Gaussian distribution �1 D �
(2.69a)
�2 D � ;
(2.69b)
2
and thus for a normal distribution all higher cumulants vanish! • Individual moments, in particular the expectation value, need not be adequate characteristics of a distribution. For a distribution with two maxima, symmetric around x D 0, the expectation value is � D 0, although x D 0 may never or seldom be assumed. (see Fig. 2.3). Similarly, for a broad or skew distribution the expectation value, for instance, is not a conclusive quantity. • The moments may not always be finite. The Lorentz or Cauchy distribution (also called Breit–Wigner distribution), %.x/ D
1 � ; � .x � a/2 C � 2
�1 < x < 1
(2.70)
decays so slowly at infinity that all moments diverge. This may also be seen from the characteristic function, for which one obtains G.k/ D eika�jkj� :
(2.71)
This function has no power series expansion around k D 0. • For distributions other than probability distributions moments can also be used for a global characterization. For instance, for a distribution of charges %.r/ we know the electric dipole moment Z pD
d3 r r %.r/;
(2.72)
2.3 Moments and Quantiles
23
Fig. 2.3 A density with two maxima (also called a bimodal distribution). The expectation value is zero, but x D 0 is never assumed
0.6
ρ(x)
0.4
0.2
0 −4
−2
0 x
2
4
and for a distribution of mass m.r/ the moments of inertia Z
� � d3 r m.r/ �ri rj C ıij r 2 :
Iij D
(2.73)
• For discrete probability distributions the moments are defined in an analogous way. For instance, for the Poisson distribution p.�I k/, hKi D
1 X
k p.�I k/ D
kD1
and hK 2 i D
1 X kD1
1 X
k
�k �� e D� kŠ
(2.74)
k 2 p.�I k/ D �2 C �:
(2.75)
kD1
For a Poisson random variable the variance is therefore equal to the mean: Var.K/ D �:
(2.76)
For the binomial distribution one obtains hKi D n p; Var.K/ D n p .1 � p/:
(2.77a) (2.77b)
2.3.2 Quantiles The ˛-quantile for a probability distribution of a scalar random variable X is defined as the value x˛ for which
24
2 Random Variables: Fundamentals of Probability Theory and Statistics P (x)
(x)
0.9 0.5
median 0.9-quantile expectation value
Fig. 2.4 Median, expectation value and 0.9-quantile of a probability distribution P .x/, also shown for the density %.x/
0.4
0.3
ρ(x) 0.2
0.1
0
μ − 3σ
μ − 2σ
μ− σ
μ x
μ +σ
μ+2σ
μ +3σ
Fig. 2.5 The area of the shaded region is 0.6827 times the total area under the curve, which is 1. The probability that the random variable X assumes a value in the interval Œ� � �; � C � � is therefore 0.6827 or 68.27%
Z P .x˛ / D
x˛ �1
dx %X .x/ D ˛:
(2.78)
The probability of a realization yielding a value in the interval Œ�1; x˛ � is then ˛ or 100 ˛%, the probability for a value x > x˛ is equal to .1 � ˛/ or .1 � ˛/ 100%. The 1/2-quantile is also called the median (see Fig. 2.4). The quantiles of the standard normal distribution can be found in a table for the distribution function or a table for the quantiles themselves. For instance x0:5 D 0; x0:8413 D 1; x0:9772 D 2. In this case symmetry reasons imply that x1�˛ D �x˛ , i.e., we also have x0:1587 D �1, x0:0228 D �2. The interval .�1; 1/ contains 84:13% � 15:87% D 68:27%, the interval .�2; 2/ 95:45% of the values (see Fig. 2.5). For a general normal distribution N.�; � 2 / one finds the following values:
2.4 The Entropy
25
Interval
Percentage of values
.� � �; � C �/ .� � 2�; � C 2�/ .� � 3�; � C 3�/
68:27% 95:45% 99:73%:
(2.79)
2.4 The Entropy An important characteristic feature for a random variable is the entropy, which we will introduce in this section.
2.4.1 Entropy for a Discrete Set of Events Let fA1 ; : : : ; AN g be a complete, disjoint set of events, i.e., A1 [ A2 [ � � � [ AN D ˝:
(2.80)
Furthermore, let P be a probability defined for these events. We then define the entropy as N X � � P.Ai / ln P.Ai / : (2.81) S D �k i D1
Here k represents a factor which we set equal to 1 for the moment. In the framework of statistical mechanics k will be Boltzmann’s constant kB . We observe: • The entropy is defined for a complete, disjoint set of events of a random variable, irrespective of whether this partition of ˝ into events can be refined or not. If ˝ is the real axis, we might have, e.g., N D 2; A1 D .�1; 0/; A2 D Œ0; 1/. • Since 0 � P.Ai / � 1 we always have S � 0. • If P.Aj / D 1 for a certain j and P.Ai / D 0 otherwise, then S D 0. This means that if the event Aj occurs with certainty the entropy is zero. • If an event has occurred, then, as we will show in a moment, � log2 P.Aj / is a good measure of the number of questions to be asked in order to find out that it is just Aj which is realized. In this context, ‘question’ refers to questions which can be answered by ‘yes’ or ‘no’, i.e., the answer leads to a gain of information of 1 bit. Hence, on average the required number of yes-or-no questions is S0 D �
N X j D1
� � P.Aj / log2 P.Aj / D S C const:
(2.82)
26
2 Random Variables: Fundamentals of Probability Theory and Statistics
The entropy is thus a measure of the missing information needed to find out which result is realized. To show that � log2 P.Aj / is just equal to the number of required yes-or-no questions, we first divide ˝ into two disjoint domains ˝1 and ˝2 such that X
P.Ai / D
Ai 2˝1
X
P.Ai / D
Ai 2˝2
1 : 2
(2.83)
The first question is now: Is Aj in ˝1 ? Having the answer to this question we next consider the set containing Aj and multiply the probabilities for the events in this set by a factor of 2. The sum of the probabilities for this set is now again equal to 1, and we are in the same position as before with the set ˝: We divide it again and ask the corresponding yes-or-no question. This procedure ends after k steps, where k is the smallest integer such that 2k P.Aj / becomes equal to or larger than 1. Consequently, � log2 P.Aj / is a good measure of the number of yes-or-no questions needed. • If the probabilities of the events are equal, i.e., P.Ai / D
1 ; N
(2.84)
we have S D ln N:
(2.85)
Any other distribution of probabilities leads to a smaller S . This will be shown soon. The above observations suggest that the entropy may be considered as a lack of information when a probability density is given. On average it would require the answers to S yes-or-no questions to figure out which event has occurred. This lack is zero for a density which describes the situation where one event occurs with certainty. If all events are equally probable, this lack of information about which event will occur in a realization is maximal. A less subjective interpretation of entropy arises when we think of it as a measure for uncertainty. If the probability is the same for all events, the uncertainty is maximal.
2.4.2 Entropy for a Continuous Space of Events In a similar manner we define the entropy for a random variable X , where the space of events is a continuum, by Z S Œ%X � D �k
� %X .x/ : dx %X .x/ ln %0 �
(2.86)
2.4 The Entropy
27
When %X .x/ has a physical dimension, the denominator %0 in the argument of the logarithm cannot simply be set to 1. Since the physical dimension of %X .x/ is equal to the dimension of 1=dx, the physical dimension of %0 has to be the same, in order that the argument of the logarithm will be dimensionless. It is easy to see that a change of %0 by a factor ˛ leads to a change of the entropy by an additive term k ln ˛. Such a change of %0 only shifts the scale of S . Notice that we no longer have S � 0. We now calculate the entropy for a Gaussian random variable N.�; � 2 /. We obtain (for k D 1; %0 D 1): �
Z
1 .x � �/2 C ln.2�� 2 / 2� 2 2 � 1� D 1 C ln.2�� 2 / : 2
S D
dx
� %X .x/
(2.87) (2.88)
The entropy increases with the width � 2 of the probability density, i.e., with the spreading around the expectation value. In this case we again find that the broader the distribution, the larger our ignorance about which event will occur in a realization, and the larger the entropy. Again, entropy means a lack of information or uncertainty.
2.4.3 Relative Entropy The relative entropy of a density function p.x/ with respect to a second density function q.x/ is defined by �
Z S Œpjq� D �k
dx p.x/ ln
� p.x/ : q.x/
(2.89)
Obviously, p.x/ � q.x/ if and only if S Œpjq� D 0. However, while the entropy for a complete and disjoint set of events is positive semi-definite, the relative entropy of a density function p.x/ with respect to a given density function q.x/ is negative semi-definite, i.e., S Œpjq� � 0: (2.90) This is easy to see: We use the inequality ln z � z � 1 for z D
q.x/ , multiply by p.x/, integrate over x, and obtain p.x/
(2.91)
28
2 Random Variables: Fundamentals of Probability Theory and Statistics
Z �
�
p.x/ dx p.x/ ln q.x/
�
Z �
� � dx q.x/ � p.x/ :
(2.92)
Since both densities are normalized, the integrals on the right-hand side are equal, from which (2.90) follows.
2.4.4 Remarks The notion of entropy was first introduced into thermodynamics as an extensive quantity, conjugate to temperature. The revealing discovery of the connection between this quantity and the probability of microstates was one of the great achievements of L. Boltzmann, and the equation S D k ln W appears on his tombstone. The introduction of entropy as a measure of the uncertainty of a density originated from Shannon (1948). Kullback and Leibler (1951) were the first to define the relative entropy, for which reason it is sometimes called Kullback–Leibler entropy. The relation between thermodynamics and information theory has been discussed extensively by Jaynes (1982). Entropy and relative entropy may also be introduced as characteristic quantities for density functions which are not probability densities, for example, the mass density, charge density, etc. However, in these cases the densities are not necessarily normalized, and in order to obtain such a useful inequality as (2.90) one has to define the relative entropy by (see (2.92), setting k D 1) Z S Œpjq� D
� � dx p.x/ � q.x/ �
�
Z dx p.x/ ln
� p.x/ : q.x/
(2.93)
2.4.5 Applications Using the inequality (2.90) satisfied by the relative entropy it will now be easy to see that a constant density distribution always has maximum entropy (compare with the statement in connection with (2.85) about the probability distribution (2.84)). Notice, however, that such a constant density distribution is only possible if ˝, the set of possible outcomes, is a compact set, e.g., a finite interval. Let q.x/ � q0 be the constant density on ˝ and %.x/ be an arbitrary density. The entropy of this density can also be written as �
q0 S Œ%� D S Œ%jq0 � � k ln %0
� :
(2.94)
From S Œ%jq0 � � 0 and S Œ%jq0 � D 0 for % � q0 follows: S Œ%� is maximal for % � q0 .
2.4 The Entropy
29
As a second application we now consider two random variables X1 ; X2 , their densities %X1 .x/, %X2 .x/, and the joint density %X1 ;X2 .x1 ; x2 /. For the relative entropy S Œ%X1 ;X2 j %X1 %X2 �
Z %X1 ;X2 .x1 ; x2 / D � dx1 dx2 %X1 ;X2 .x1 ; x2 / ln %X1 .x1 /%X2 .x2 /
(2.95)
a short calculation yields S Œ%X1 ;X2 j %X1 %X2 � D S12 � S1 � S2 ;
(2.96)
where Si is the entropy for the density %Xi .x/; i D 1; 2 and S12 the entropy of the joint density %X1 ;X2 .x1 ; x2 /. As the relative entropy is always smaller than or equal to zero, one always has S12 � S1 C S2 : (2.97) Hence, the entropy of the joint density is always smaller than or equal to the sum of the entropies of the single densities. Equality holds if and only if %X1 ;X2 .x1 ; x2 / D %X1 .x1 /%X2 .x2 /;
(2.98)
i.e., if the two random variables are independent: the entropies of independent random variables add up. For independent random variables the total entropy is maximal. Any dependence between the random variables reduces the total entropy and lowers the uncertainty for the pair of random variables, i.e. any dependency corresponds to an information about the pair of random variables. The relative entropy S Œ%X1 ;X2 j %X1 %X2 � is also known as mutual information. In the remainder of this section we address the maximum entropy principle. We are looking for the density function %.x/ which has maximum entropy and satisfies the supplementary conditions Z hgi .X /i �
dx gi .x/ %.x/ D i ;
i D 1; : : : ; n:
(2.99)
Here gi .x/ are given functions and i are given real numbers. From the proposition about the relative entropy proven above, one finds that the density function with maximum entropy satisfying the supplementary conditions (2.99) has the form 1 (2.100) %.x/ D e��1 g1 .x/�:::��n gn .x/ : A Here A is a normalization factor and f�i g may be calculated from f i g. With the help of this maximum entropy principle we can determine density functions.
30
2 Random Variables: Fundamentals of Probability Theory and Statistics
Proof. For the density function (2.100) one obtains (with k D 1) S Œ%� D ln.A%0 / C
n X
�i i ;
(2.101)
i D1
where %0 represents the factor which might be necessary for dimensional reasons. Let '.x/ be a second density satisfying the supplementary conditions (2.99). Then, according to (2.90) S Œ'j%� � 0; (2.102) and therefore �
Z S Œ'� D �
dx '.x/ ln �
Z ��
dx '.x/ ln "
Z D
'.x/ %0 %.x/ %0
� (2.103) �
ln.A%0 / C
dx '.x/
(2.104) n X
# �i gi .x/
(2.105)
i D1 n X
D ln.A%0 / C
�i i � S Œ%� :
(2.106)
i D1
Hence, %.x/ given by (2.100) is the density with maximum entropy. Let us look at two examples. First we seek the density defined on Π0; 1 / which has maximum entropy and satisfies the supplementary condition hX i D :
(2.107)
We immediately find this density as %.x/ D
1 ��x e A
for x � 0:
(2.108)
1 ; �
(2.109)
The normalization factor A is given by Z
1
AD
dx e��x D
0
and � is determined by according to Z
1
D hX i D
dx x � e��x
0
D ��
@ @�
Z 0
1
dx e��x D
(2.110) 1 : �
(2.111)
2.4 The Entropy
31
Therefore %.x/ D
1 �x= e :
(2.112)
As a second example we seek the density %.q; p/, defined on the 6N dimensional phase space for N classical particles, which has maximum entropy and satisfies the supplementary condition hH.q; p/i D E;
(2.113)
where H.q; p/ is the Hamiltonian function for the N particles. One obtains %.q; p/ D
1 ��H.q;p/ ; e A
(2.114)
i.e., the Boltzmann distribution. We still have to determine A and �. The former follows from the normalization condition Z A D d3N p d3N q e��H.q;p/ : (2.115) In particular, we find 1 @A D hH.q; p/i: A @� � follows from the supplementary condition: �
E D hH.q; p/i D
1 A
Z
d3N p d3N q H.q; p/ e��H.q;p/ :
(2.116)
(2.117)
The right-hand side yields a function f .�; N; V /, which has to be equal to E. The resulting equation has to be solved for � to obtain � D �.E; N; V /. The meaning of � becomes more obvious when we consider the entropy. We have S Œ%� D ln.A%0 / C �E
(2.118)
@� @ @� @ S Œ%� D ln.A%0 / C E C � D �: @E @E @� @E
(2.119)
and therefore, using (2.116),
The quantity � indicates the sensitivity of the entropy to a change in energy. In Chap. 3 on statistical mechanics we will introduce the temperature as being proportional to the inverse of this quantity �, and we will consider a system of N particles in a volume V , for which the temperature, i.e. the parameter �, is held fixed by contact with a heat bath. In this system, which will be called the canonical system, we will obtain the Boltzmann distribution as the probability density for the positions and momenta of the particles. In the present context it results from the requirement of maximum entropy under the supplementary condition hH i D E.
32
2 Random Variables: Fundamentals of Probability Theory and Statistics
This has a twofold significance: First, that the energy is not fixed, but the system may exchange energy with the environment (i.e. the heat bath), and second, that hH i is independently given, which is equivalent to fixing the temperature in the canonical system. Both approaches to the Boltzmann distribution proceed from the same physical situation. If we were looking for a system with maximum entropy which satisfies the supplementary conditions hH i D E
and hH 2 i D C;
(2.120)
we would construct a system where both hH i and hH 2 i are independently given. In the canonical system, however, one can determine hH 2 i as a function of E; N; V or T; N; V .
2.5 Computations with Random Variables 2.5.1 Addition and Multiplication of Random Variables Random variables can be added if their realizations can be added; they can be multiplied if the product of their realizations is meaningful. We may consider functions or mappings of random variables. The question then arises of how to determine the probability density of the sum, the product, and of the mapping. Multiplication of a random variable with some constant. Let us first consider a random variable X with a density distribution %X .x/. We set Z D ˛ X;
(2.121)
Z
and find %Z .z/ D
dx ı.z � ˛x/ %X .x/ D
1 z %X . /: j˛j ˛
(2.122)
Obviously hZi D ˛hX i;
(2.123a)
Var.Z/ D ˛ 2 Var.X /;
(2.123b)
because Z
Z hZi D
dz z %Z .z/ D
Z dz z
dx ı.z � ˛x/ %X .x/
(2.124)
Z D˛
dx x %X .x/ D ˛hX i:
In the same way one can derive the relation for Var.Z/.
(2.125)
2.5 Computations with Random Variables
33
Function of a random variable. Now let us take the more general case Z D f .X /:
(2.126)
One obtains for the density function Z %Z .z/ D D
dx %X .x/ı.z � f .x// X i
1 %X .xi .z// ; jf 0 .xi .z//j
(2.127) (2.128)
where fxi .z/g are the solutions which result from solving the equation z D f .x/ for x. There may be several solutions, which we denote by xi .z/; i D 1; : : :. Apart from this complication, the transformation of the densities under a coordinate transformation x ! z.x/ may also be obtained from the identity Z
Z 1D
dx %X .x/ D
ˇ ˇ Z ˇ dx ˇ dz ˇˇ ˇˇ %X .x.z// D dz %Z .z/; dz
(2.129)
and we find, in agreement with (2.128), ˇ ˇ ˇ dx ˇ %Z .z/ D %X .x.z// ˇˇ ˇˇ : dz
(2.130)
A similar relation holds for several dimensions. Let X D .X1 ; X2 ; : : : ; Xn / be an n-tuple of random variables and Zi D Zi .X/;
i D 1; : : : ; n
(2.131)
a mapping X ! Z D .Z1 ; : : : ; Zn /. For the density function %Z .z/ one then finds ˇ ˇ ˇ @.x1 ; : : : ; xn / ˇ ˇ %X .x.z//: %Z .z/ D ˇˇ @.z1 ; : : : ; zn / ˇ
(2.132)
Examples. (a) Let Z D � ln X;
%X .x/ D 1
for
x 2 Œ 0; 1 �:
(2.133)
With dz=dx D �1=x, and hence jdx=dzj D jxj D e�z , one obtains %Z .z/ D e�z %X .x.z//: Thus, with %X .x/ D 1, Z is exponentially distributed.
(2.134)
34
2 Random Variables: Fundamentals of Probability Theory and Statistics
(b) Let .Z1 ; Z2 / D
p �2 ln X1 .cos 2�X2 ; sin 2�X2 /;
(2.135)
where X1 and X2 are independent and uniformly distributed in Œ0; 1�. Then ˇ ˇ ˇ @.x1 ; x2 / ˇ ˇ %X .x/ D p1 e�z21 =2 p1 e�z22 =2 : %Z .z/ � ˇˇ @.z1 ; z2 / ˇ 2� 2�
(2.136)
In this case .Z1 ; Z2 / are also independent, each with a standard normal distribution. Addition of random variables. Let X1 ; X2 be two random variables with probability density %.x1 ; x2 /. We set Z D X1 C X2 :
(2.137)
Then Z %Z .z/ D
dx1 dx2 ı.z � x1 � x2 / %.x1 ; x2 /
(2.138)
dx1 %.x1 ; z � x1 /:
(2.139)
Z D
Three distinct cases are of interest. If X1 and X2 are both normally distributed, then, according to (2.24), the joint density %.x1 ; x2 / is an exponential function with an exponent quadratic in x1 and x2 . For Z D X1 C X2 one may derive the density from (2.139). The integrand in (2.139), i.e., %.x1 ; z � x1 /, and also the result of the integration are therefore exponential functions with quadratic exponents. This implies that %Z .z/ is also of this form, and therefore Z is also a normally distributed random variable. Hence, the sum of two normal random variables is always (even if they are mutually dependent) another normal random variable. More generally, every linear superposition of normal random variables is again a normal random variable. Next, if X1 and X2 are independent with probability densities %X1 .x/ and %X2 .x/, respectively, we find Z %Z .z/ D
dx1 %X1 .x1 / %X2 .z � x1 /;
(2.140)
i.e., the density function for a sum of two independent random variables is the convolution of the individual density functions. For the characteristic function we obtain GZ .k/ D GX1 .k/GX2 .k/:
(2.141)
2.5 Computations with Random Variables
35
It is easy to show that for independent random variables X1 ; X2 hZi D hX1 i C hX2 i;
(2.142)
Var.Z/ D Var.X1 / C Var.X2 /:
(2.143)
The first relation follows from Z Z hZi D dz dx1 dx2 z ı.z � x1 � x2 / %1 .x1 / %2 .x2 /
(2.144)
Z D
dx1 dx2 .x1 C x2 / %1 .x1 / %2 .x2 /
(2.145)
D hX1 i C hX2 i:
(2.146)
The equation for Var.Z/ can be derived similarly. When all cumulants exist, we may use (2.141) for the characteristic function to prove the sum rules, because it is a direct consequence of � � 1 2 GX .k/ D exp ik�1 .X / � k �2 .X / � : : : 2
(2.147)
that the cumulants of a sum Z D X1 C X2 are the sums of the cumulants. As �1 .X / D hX i and �2 .X / D Var.X /, (2.142) and (2.143) follow. Finally, for two dependent random variables X1 ; X2 , (2.142) still holds, which is not necessarily true for (2.143). In this case Var.Z/ D Var.X1 / C 2Cov.X1 ; X2 / C Var.X2 /:
(2.148)
Multiplication of independent random variables. Let X1 ; X2 be two independent random variables with probability densities %X1 .x/ and %X2 .x/. We set Z D X1 X2 :
(2.149)
Then Z %Z .z/ D
dx1 dx2 ı.z � x1 x2 / %X1 .x1 /%X2 .x2 / Z
D
1 dx1 %X1 .x1 / %X jx1 j 2
�
z x1
(2.150)
� :
(2.151)
36
2 Random Variables: Fundamentals of Probability Theory and Statistics
2.5.2 Further Important Random Variables Having learnt how to calculate with random variables, we can now construct some important new random variables by combining some of those that we have already met. First, we consider n independent random variables X1 ; : : : ; Xn with standard normal distributions and set Z D X12 C � � � C Xn2 :
(2.152)
The density distribution of Z is given by Z %Z .z/ D with
dx1 : : : dxn ı.z � x12 � � � � � xn2 / %.x1 ; : : : ; xn /;
� � 1 %.x1 ; : : : ; xn / D .2�/�n=2 exp � .x12 C � � � C xn2 / : 2
We obtain %Z .z/ D
1 2n=2 .n=2/
zn=2�1 e �z=2 ;
(2.153)
(2.154)
(2.155)
p where .x/ is the gamma function ( .x C 1/ D x .x/; .1=2/ D �,
.N C 1/ D N Š for N D 0; 1; : : : ). This random variable Z occurs so frequently that it bears its own name: �2n with n degrees of freedom. One finds h�2n i D n; Var.�2n /
D 2n:
One is equally likely to encounter the random variable %�n .z/ D
(2.156a) (2.156b) p Z D �n with density
1 2 zn�1 e�z =2 : 2n=2�1 .n=2/
(2.157)
The three components vi of the velocities of molecules in a gas at temperature T are normally distributed with mean 0 and variance � 2 D kB T =m (cf. Sect. 2.2). Here, m denotes the mass of a molecule and kB Boltzmann’s constant. Therefore, n D 3 and vi D �Xi , where Xi is a random variableqwith a standard normal distribution. For the absolute value of the velocity v D the density �v� 1 D %.v/ D %�3 � �
s
v21 C v22 C v23 we obtain
� � 2m3 mv2 2 : v exp � �.kB T /3 2kB T
(2.158)
2.5 Computations with Random Variables
37
This is also called the Maxwell–Boltzmann distribution. Furthermore, we find Dm E 3 m kB T m ˝ ˛ v2 D � 2 �23 D � 3 D kB T: 2 2 2 m 2
(2.159)
Next, consider two �2 -distributed random variables Yk and Zq with k and q degrees of freedom, respectively. The ratio ZD
Yk =k Zq =q
(2.160)
is a so-called Fk;q -distributed random variable. For the density one obtains � � � �k=2
1=2.k C q/ k %Fk;q .z/ D q
.1=2 k/ .1=2 q/ z
k=2�1
� � k �.kCq/=2 1C z : q
(2.161)
Finally, let Y be a random variable with a standard normal distribution and Zq be a �2 -distributed random variable with q degrees of freedom. The ratio Y Tq D p Zq =q
(2.162)
defines a t-distributed random variable with q degrees of freedom. The density 1 .1=2 C q=2/ %Tq .z/ D p q .1=2/ .q=2/
� ��.qC1/=2 z2 1C q
(2.163)
is also called the density function of the Student t-distribution (after the pseudonym ‘Student’ assumed by the English statistician W. S. Gosset). Remark. Above we have introduced the probability densities of some frequently occurring random variables. In the computation of characteristic quantities, in particular the ˛-quantiles for general ˛, which are often required in practice, one encounters special functions like the incomplete beta function. Here we do not want to deal with such calculations, since quantities such as the ˛-quantiles can be found from any statistics software package. However, we do want to introduce the graphs of some densities in Fig. 2.6. As can be seen from the formulas, the densities of the �-, �2 -, and F -distributions tend to zero for z ! 0, when n exceeds 1 or 2, or when k exceeds the value 2. For z ! 1 these functions decrease exponentially or as a power law. For large values of q the density of the t-distribution strongly resembles the normal distribution.
38
2 Random Variables: Fundamentals of Probability Theory and Statistics 0.8
0.8
0.6
0.6
n=1
ρχ 0.4
ρχ2 0.4
n= 6
n =2 0.2
0.2 0
0
2
4
6
0
n =10 0
5
z
10
15
z
2
0.4
1.5
0.3
n=30
k=1,q=5 ρF
ρT 0.2
1
0
n=2
k=4,q=8
0.5
0
1
0.1
2 z
3
4
0 −4
−2
0 z
2
4
Fig. 2.6 Density functions of the �-distribution (upper left ), the �2 -distribution (upper right ), the F -distribution (lower left ) and the t -distribution (lower right )
2.5.3 Limit Theorems In this subsection we consider sums of N independent and identically distributed random variables and investigate the properties of the densities for such sums as N ! 1. The resulting propositions are called limit theorems. They play an important role for all complex systems which consist of many subsystems and where the characteristic quantities of the total system result from sums of the corresponding quantities of the subsystems. The central limit theorem. Let Xi ; i D 1; : : : ; N; be independent and identically distributed random variables. All cumulants shall exist and let hXi i D 0; Var.Xi / D � 2 ;
(2.164a) i D 1; : : : ; N:
(2.164b)
� 1 � ZN D p X1 C � � � C XN : N
(2.165)
We set
2.5 Computations with Random Variables
39
If follows that hZN i D 0; Var.ZN / D
(2.166a)
N 1 X Var.Xi / D � 2 ; N i D1
(2.166b)
furthermore, all higher moments and cumulants decrease at least as fast as N �1=2 for N ! 1. Thus for N ! 1 the random variable ZN is a Gaussian random variable with mean 0 and variance � 2 . Because of its far-reaching significance this statement is also called the ‘central limit theorem’. It has been proven for many different and more general conditions (see e.g. Gardiner 1985). So, according to the central limit theorem, we may describe the total influence resulting from a superposition of many stochastic influences by a Gaussian random variable. For this reason one often assumes that the measurement errors are realizations of Gaussian random variables. We will make frequent use of the central limit theorem. A first simple application is the following: Suppose the random number generator of a computer provides us with random numbers x which are uniformly distributed on the interval Œ0; 1�. Then %.x/ D 1 for x 2 Œ0; 1�, and hX i D
1 ; 2 Z 1
Var.X / D
(2.167a) x 2 dx � hX i2 D
0
Hence
1 1 1 � D : 3 4 12
1 p X 0 D .X � / 12� 2
(2.167b)
(2.168)
2 is a random number p with p vanishing mean value and variance � , uniformly 1 1 distributed in Œ� 2 12�; 2 12��. If we select N such numbers and set
1 ZN D p .X10 C : : : C XN0 /; N
(2.169)
then ZN is approximately a Gaussian random variable with variance � 2 and mean 0. For N D 12 this approximation is already quite good. The mean of random variables. Consider the independent random variables X; X1 ; : : : ; XN , all having the same probability density. All moments and all cumulants shall exist. We set ZN D
� 1� X1 C � � � C XN : N
(2.170)
40
2 Random Variables: Fundamentals of Probability Theory and Statistics
Then hZN i D Var.ZN / D
N 1 X hXi i D hX i; N i D1
(2.171a)
1 Var.X /; N
(2.171b)
and all higher moments and cumulants decrease like 1=N 2 or faster in the limit N ! 1. As an application, consider N independent realizations x1 ; : : : ; xN of the random variable X and form the expectation value zN D
� 1� x1 C � � � C xN : N
(2.172)
Each xi may also be thought of as a realization of Xi , where each random variable Xi is a ‘copy’ of X ; therefore zN is a realization of ZN . For N large enough the higher cumulants are negligible and thus ZN may be regarded as a Gaussian random variable with expectation value hX i and variance Var.X /=N . For larger values of N the realization zN of the mean value scatter less and less around hX i, and the distribution of ZN is better and better approximated by a Gaussian distribution. For N ! 1 the support of the density for the random variables ZN , i.e., the domain where the density is larger than any arbitrarily small ", shrinks to the value hX i. Thus, by forming the mean value of N realizations of a random variable X one obtains a good ‘estimator’ for hX i. This estimator gets better and better for larger values of N . This is the origin of the casual habit of using the expressions ‘mean value’ and ‘expectation value’ as synonyms, although the expectation value is a quantity which is derived from a probability density, while the mean value always refers to the mean value of realizations. In Part II we will make the concept of estimators more precise. Above we have considered two differently normalized sums of N independent and identically distributed random variables with finite variance. In the first case the limit distribution is again a normal distribution, in the second case it is concentrated around a point. These are two typical scenarios which occur frequently in statistical physics. There, however, we mostly deal with dependent random variables, and the dependence is described by the models of the interactions among the different subsystems. Sums of random variables will be further considered in the next two sections.
2.6 Stable Random Variables and Renormalization Transformations In Sect. 2.5.3 we identified the normal distribution as the limit of a large class of distributions. Now we will become acquainted with other classes of random variables that all have prominent distributions as limit distributions.
2.6 Stable Random Variables and Renormalization Transformations
41
2.6.1 Stable Random Variables We first introduce the notion of a stable distribution. Let X; X1 ; : : : ; XN be independent and identically distributed random variables with a density %.x/, and, furthermore, let SN D X1 C : : : C XN : (2.173) We define the density %.x/ as stable if there exist constants cN > 0 and dN for any N � 2 such that SN has the same density as cN X C dN . The density %.x/ is called strictly stable if this statement is true for dN D 0. For example, the normal distribution is stable: A sum of normal random variables is again normally distributed. But the Cauchy distribution, which we met in Sect. 2.3, with its density and generating function, 1 �2 ; � .x � �/2 C � 2 ˛ ˝ G.k/ D eikX D eik��jkj� ; %.x/ D
(2.174) � >0
(2.175)
is also stable. The sum of N Cauchy random variables is again a Cauchy random variable, because in this case the characteristic function of SN is GSN D eiN k��N jkj� ;
(2.176)
and therefore 1 .X1 C : : : C XN / (2.177) N is again Cauchy distributed with the same parameters. The densities of the normal distribution and the Cauchy distribution differ with respect to their behavior for large jxj. The moments of the Cauchy distribution do not exist. Thus the normal distribution and the Cauchy distribution are two important stable distributions, the first one with cN D N 1=2 , the second one with cN D N . One can now prove the following statement (Feller 1957; Samorodnitzky and Taqqu 1994): The constant cN can in general only be of the form Y D
cN D N 1=˛
with
0 < ˛ � 2:
(2.178)
The quantity ˛ is called the index or the characteristic exponent of the stable density. For the Cauchy distribution we find ˛ D 1; for the normal distribution ˛ D 2. A stable density with index ˛ D 1=2 is 8 < p 1 e�1=2x for x > 0; %.x/ D 2�x 3 : 0 for x < 0:
(2.179)
42
2 Random Variables: Fundamentals of Probability Theory and Statistics
For such random variables fXi g with ˛ D 1=2, Y D
1 .X1 C : : : C XN / N2
(2.180)
is again a random variable with the density given in (2.179). For a stable density %.x/ with exponent ˛ ¤ 1 one can always find a constant � such that %.x ��/ is strictly stable. For ˛ D 1 this shift of the density is unnecessary as the Cauchy distribution is strictly stable even for � ¤ 0. The generating function of strictly stable densities is G.k/ D e�jkj � ; ˛
(2.181)
with some scale parameter � > 0. Thus for ˛ < 2 one obtains for x ! 1 jxj1C˛ %.x/ ! const. ¤ 0:
(2.182)
The stable densities with characteristic exponents ˛ < 2 do not have a finite variance. More generally, stable densities may be characterized not by three but by four parameters: In addition to the index ˛, the scale parameter � , and the shift parameter �, one has the skewness ˇ, which we now meet for the first time. The skewness ˇ measures the deviation from symmetry. For ˇ D 0 we have %.�x/ D %.x/. As we want to deal here only with strictly stable densities, for which ˇ D 0 for all ˛ 2 .0; 2�, we give no further details concerning this parameter or its role in the characteristic function. Remark. A realization x of a random variable with a strictly stable density for an index ˛ and a scale parameter � D 1 can be constructed as follows (Samorodnitzky and Taqqu 1994): Take a realization r of a uniformly distributed random variable in the interval Œ��=2; �=2� and, independently, a realization v of an exponential random variable with mean 1. Then set sin .˛r/ xD .cos r/1=˛
�
cos ..1 � ˛/r/ v
�.1�˛/=˛ :
(2.183)
A series of such realizations is represented in Fig. 2.7 for various values of ˛. For decreasing ˛ the larger deviations become larger and more frequent. A realization x of a Cauchy random variable (˛ D 1) with scale parameter � and shift parameter � is more easily constructed: Take a realization r of a random variable uniformly distributed in Œ��=2; �=2� and set x D � tan r C �: Special constructions also exist for ˛ D 2�k ; k � 1.
(2.184)
2.6 Stable Random Variables and Renormalization Transformations
400
400
α=1
200
0
−200
−200
−400 0
200
400
600
800
−400
α = 1.99
5
α = 1.5
200
0
0
200
400
600
800
600
800
α=2
5
0
43
0
−5
−5 0
200
400
600
800
0
200
400
Fig. 2.7 A series of realizations of a random variable with a stable density for four different values of the index ˛
2.6.2 The Renormalization Transformation There is a further way to characterize stable distributions: Let X D fXi g1 i D�1 be a sequence of independent and identically distributed random variables with density %.x/. We consider the transformation Tn , n � 1, for which 1 Xi D .Tn X /i D ı n 0
.i C1/n�1
X
Xj :
(2.185)
j Di n
In this transformation the random variables are thus combined into blocks of length n. The random variables within each block are summed up and this sum is renormalized by a power ı of the length n of this block. This transformation is called a renormalization transformation. The familiy of transformations fTn ; n � 1g form a semi-group, i.e. Tmn D Tm Tn . This semi-group is also called renormalization group. A sequence X D fXi g1 i D�1 is a fixed point of this group of transformations 0 if the Xi resulting from Tn X have the same density %.x/ as the Xi . A sequence of independent strictly stable random variables with characteristic exponent ˛ is obviously a fixed point for fTn ; n � 1g with ı D 1=˛. Therefore, such stable densities appear as the limit of sequences of densities, which result from successive applications of the transformation Tn with n fixed (or a single transformation Tn with increasing n) to a given sequence of random variables with a given density. Under successive transformations all densities with finite variance, i.e., ˛ D 2, approach the normal distribution. This corresponds to the central limit theorem.
44
2 Random Variables: Fundamentals of Probability Theory and Statistics
Hence, stable densities have a domain of attraction of densities. For the transformation with index ˛ all densities with the asymptotic behavior (2.182) belong to the domain of attraction of the stable density with exponent ˛. Suppose we are given a density which belongs in the above sense to the domain of attraction of a stable density with index ˛. If the ‘wrong’ transformation is applied to this density, i.e., a transformation with index ˇ ¤ ˛, then the limit is either not a density or there is a drift towards a density which is concentrated around one point. There are also densities which do not belong to the domain of attraction of any stable density.
2.6.3 Stability Analysis We now want to examine the behavior of densities close to a fixed point. For n D 2 the renormalization transformations may also easily be formulated on the level of densities. For ı D 1=˛ one obtains Z .T2 %/.x/ D %X 0 .x/ D 21=˛
dy %.21=˛ x � y/%.y/:
(2.186)
The stable density representing the fixed point will be denoted by %� .x/. Let %.x/ D %� .x/ C .x/. For the deviation .x/ the transformation T2 leads to 0 D T2 .%� C / � T2 %� D DT2 C O. 2 / Z
with .DT2 /.x/ D 2 2
1=˛
dy %� .21=˛ x � y/ .y/:
(2.187)
(2.188)
Let n .x/ denote the eigenfunctions of DT2 and �n the corresponding eigenvalues. Then .DT2 n /.x/ D �n n .x/: (2.189) Obviously, %� .x/ itself is an eigenfuction with eigenvalue 2. We set 0 D %� .x/, �0 D 2. Let vn be the coefficients of an expansion of the deviation .x/ with respect to the eigenfunctions n , i.e. 1 X vn n .x/: (2.190) .x/ D nD1
Remark. For ˛ D 2, i.e., for the densities with finite variance, the eigenfunctions and eigenvalues are simply �x � 1 2 2 e�x =2� Hn n .x/ D p � 2��
p and �n D . 2/2�n :
(2.191)
2.6 Stable Random Variables and Renormalization Transformations
45
Here fHn g denote the Hermite polynomials. In particular, the first polynomials are H2 .x/ D x 2 � 1; H1 .x/ D x; 3 H3 .x/ D x � 3x; H4 .x/ D x 4 � 6x 2 C 3:
(2.192)
When a density %.x/ belonging to the domain of attraction of the normal distribution is approximated by the density of the normal distribution with the same variance and the same mean value, the difference can be represented as (cf. Papoulis 1984) 1 �x � X 1 1 2 2 2 2 .x/ � %.x/ � p ; vn Hn e�x =2� D p e�x =2� � 2�� 2�� nD3
(2.193)
and the coefficients fvn g are proportional to the moments f�n g of the density %.x/. One obtains, for example, v3 D
1 �3 ; 3Š� 3
1 .�4 � 3� 4 /: 4Š� 4
v4 D
(2.194)
For a more general distribution we also have v1 D
1 �1 ; �
v2 D
1 .�2 � � 2 /: 2Š� 2
(2.195)
In a linear approximation the deviation .x/ changes under a renormalization transformation according to 0 .x/ D .DT2 /.x/ D
X
vn 0 n .x/;
(2.196)
nD1
where v0n D �n vn ;
(2.197)
i.e. the coefficients fvn g are the characteristic parameters of the density %.x/, which in a linear approximation transform covariantly under a renormalization transformation. We will also call them scale parameters. For the density %.x/ to belong to the domain of attraction of the density %� .x/ under the renormalization transformation T2 , the eigenvalues �n obviously have to satisfy �n < 1, unless vn D 0. In physics, those parameters vn for which �n > 1 are called relevant parameters. If �n D 1 one speaks of marginal parameters, and if �n < 1 they are called irrelevant parameters. The subspace of the space of parameters fvn g for which all relevant parameters vanish is called a ‘critical surface’ in physics. So this space is identical to the domain of attraction of the stable density %� .x/.
46
2 Random Variables: Fundamentals of Probability Theory and Statistics
2.6.4 Scaling Behavior For a given renormalization transformation we now examine the transformation properties of a density which does not belong to the domain of attraction of the corresponding stable density, but which is close to this domain in the following sense: There shall exist an expansion of this density with respect to the eigenfunctions f n g, X %.x/ D %� .x/ C vn n .x/; (2.198) nD1
such that the relevant parameters, which we take to be v1 and v2 without loss of generality, are supposed to be small. If they were to vanish, %.x/ would belong to the domain of attraction. The generating function of the cumulants, �Z F Œ%.x/; t� D ln
� dx %.x/e ; itx
(2.199)
is now considered as a functional of %.x/ and a function of t. Let %0 .x/ D .T2 %/.x/, then Z �Z � 0 1=˛ F Œ% .x/; t� D ln dx 2 (2.200) dy %.21=˛ x � y/%.y/eitx
t D 2F %.x/; 1=˛ : 2
(2.201)
The functional F Œ%.x/; t� transforms covariantly under the renormalization transformation. As the densities may equivalently be characterized by their scale parameters fvn g and fv0n g, F can also be considered as a function F .v1 ; : : : ; t/ of these scale parameters and the variable t. Thus F .v01 ; v02 ; v03 ; : : : ; t/
� � t D 2F v1 ; v2 ; v3 ; : : : ; 1=˛ ; 2
(2.202)
or, taking v0n D �n vn ; � D 2; �n D �an ; �at D 21=˛ , F .�a1 v1 ; �a2 v2 ; �a3 v3 ; : : : ; �at t/ D �F .v1 ; v2 ; v3 ; : : : ; t/:
(2.203)
For densities close to the fixed point of the renormalization transformation the irrelevant scale parameters v3 ; : : : will be small. To a good approximation F can be considered as independent of these parameters and one obtains the scaling relation: F .�a1 v1 ; �a2 v2 ; �at t/ D �F .v1 ; v2 ; t/:
(2.204)
This behavior holds for all densities that are close to the domain of attraction of the corresponding stable density. In this sense it may be called universal.
2.7 The Large Deviation Property for Sums of Random Variables
47
From such a scaling law one can easily determine the behavior of F (and other derived quantities) close to the domain of attraction (the critical surface) of the stable density corresponding to the renormalization transformation. We will come back to this point in Sect. 4.7, where we will consider renormalization transformations in the context of random fields, in particular for spin systems. Remark. For those densities in the domain of attraction of the normal distribution, F can be explicitly represented by an expansion in cumulants: F Œ%.x/; t� D
1 X .it/n nD1
nŠ
�n :
(2.205)
The cumulants f�n g transform in the same way as the fvn g, i.e. �n0 D 21�n=2 �n , because the cumulants of a sum of random variables is the sum of the cumulants and the renormalization bypthe factor 2�1=2 produces a further factor 2�n=2 . Then also �n0 .�at t/n � 21�n=2 �n . 2t/n D 2�n t n , hence, in this case there exists an easier way to derive the scaling relations: F .�a1 �1 ; �a2 �2 ; �a3 �3 ; : : : ; �at t/ D �F .�1 ; �2 ; �3 ; : : : ; t/:
(2.206)
It is of the same form as (2.203) with fvn g now replaced by f�n g. Note, however, that the two sets of covariant parameters are easily transformed into each other.
2.7 The Large Deviation Property for Sums of Random Variables In Sect. 2.5 we have learnt the arithmetic of random variables and investigated the behavior of densities of N independent random variables for large values of N . We have formulated a first version of the central limit theorem. In Sect. 2.6 we studied special classes of random variables which can also be seen as limits of a sequence of properly normalized sum of N .N D 2; : : :/ random variables. A sum of random variables represents a prototype of a macrovariable for a statistical system. In systems having many degrees of freedom, quantities describing the total system are often represented by sums of quantities pertaining to the single components or degrees of freedom. The kinetic energy of the total system is composed of the kinetic energies of the single constituents; the magnetization of a spin system is the mean value of all magnetic moments. Every extensive quantity is a sum of corresponding quantities for the subsystems. In this section we will study the density of such sums for large N . We first introduce a special property for such a sequence which will turn out to be very relevant in statistical systems and, whenever this property is met, some strong statements can be made about the density of the macrovariable.
48
2 Random Variables: Fundamentals of Probability Theory and Statistics
In order to be able to introduce this property and to make the statements about the density we first introduce two new concepts. The free energy function. Let X be a random variable with density %.x/. Then ˝
f .t/ D ln e
tX
˛
Z D ln
tx
dx e %.x/
(2.207)
is called the free energy function. This name for f .t/ refers to the fact that in statistical mechanics this function is closely related to the free energy of thermodynamics. f .t/ is the generating function of the cumulants, if they exist. In Sect. 2.3, formula (2.66), we introduced f .ik/ D ln G.k/ as such a generating function. But f .t/ is real and it is easy to show that it is also a strictly convex function, i.e., the second derivative always obeys f 00 .t/ > 0, unless the density %.x/ is concentrated around a point. We give some examples: • For the normal distribution X N.�; � 2 / one finds 1 f .t/ D �t C � 2 t 2 : 2
(2.208)
• For the exponential distribution %.x/ D me�mx we have � f .t/ D � ln
m�t m
� ;
t < m:
(2.209)
• For a random variable with discrete realizations f�1; C1g and %.˙1/ D 1=2 one obtains f .t/ D ln .cosh t/: (2.210) The Legendre transform. Let f .t/ be a strictly convex function, then the Legendre transform g.y/ of f .t/ is defined on Œ0; 1/ by g.y/ D sup .ty � f .t//:
(2.211)
t
g.y/ is again strictly convex. Hence, in order to write down g.y/ explicitly one first has to determine the supremum; it is found at t D t.y/, where t.y/ follows from solving the equation y D f 0 .t/
(2.212)
for t. The convexity of f .t/ guarantees that t.y/ exists. Thereby one obtains g.y/ D t.y/y � f .t.y//
(2.213)
2.7 The Large Deviation Property for Sums of Random Variables
49
and dg D y dt C t dy � f 0 .t/ dt D t dy;
i.e. also
g 0 .y/ D t.y/:
(2.214)
In this way the Hamiltonian function H.p; q/ of a classical mechanical system is the Legendre transform of the Lagrange function L.q; P q/: � � P q/ : H.p; q/ D sup p qP � L.q;
(2.215)
qP
The Lagrange function is convex with respect to the argument q, P since L.q; P q/ D mqP 2 =2 C : : :. Let us determine the Legendre transforms for the above mentioned examples. • For the normal distribution N.�; � 2 / one obtains from (2.208) g.y/ D
.y � �/2 ; 2� 2
(2.216)
• For the exponential distribution follows from (2.209) g.y/ D my � 1 � ln my;
(2.217)
• And for a random variable with discrete realizations f�1; C1g and %.˙1/ D 1=2 one finds 1�y 1Cy ln .1 C y/ C ln .1 � y/: (2.218) g.y/ D 2 2 The convexity of f .t/ and g.y/ is easily verified for each case. Armed with these preparations we are now able to introduce the central notion, the large deviation property. We consider a sequence YN of random variables with densities %N .y/. We may think of them as the densities for YN D .X1 C: : :CXN /=N , where fXi g are random variables with a density %.x/. However, any other sequence is also possible. We say that such a sequence has the large deviation property, if the densities for %N .y/ obey %N .y/ D e�aN S.y/Co.N / ; (2.219) with aN ! N for N ! 1. The residual term o.N / contains only contributions which increase sublinearly as a function of N . In the limit N ! 1 the probability of an event being in .y; y C dy/ should therefore be arbitrarily small for almost all y. For large N a significant probability remains only for minima of S.y/. The function S.y/ therefore plays an essential role for the densities %N .y/ for large N . In the so-called thermodynamic limit, i.e. N ! 1, the probability limN !1 %N .y/ is different from zero only at the absolute minimum ymin of the function S.y/.
50
2 Random Variables: Fundamentals of Probability Theory and Statistics
We will see that in models of real statistical systems such a value ymin corresponds to the equilibrium state and that the function S.y/ corresponds to the negative of the entropy, and we know that the entropy assumes its maximum for an equilibrium state. But we can already see the following: If the function S.y/ assumes its absolute minimum at two (or more) values, one also obtains two (or more) possible equilibrium states. In this case one speaks of two phases. Which phase or which mixture of phases is realized depends on the initial conditions and/or boundary conditions. If S.y/ depends on a parameter and if for a certain value of this parameter the minimum splits into two minima, this value is called a critical point. The splitting is called a phase transition. Hence this phenomenon can already be described at this stage. The determination of the function S.y/ is, of course, of utmost importance. An example where this quantity is particularly easy to calculate is the following. Let X; X1 ; : : : be identical and independent random variables with a density %.x/. Furthermore, let the free energy function, �Z � ˝ tX ˛ tx f .t/ D ln e D ln dx e %.x/ ; (2.220) be finite for all t. Set YN D
N 1 X Xi : N i D1
(2.221)
Under these conditions the sequence %YN .y/ has the large deviation property. Indeed, (2.219) holds with aN D N , and we find that • The function S.y/ is the Legendre transform of f .t/: S.y/ D sup .ty � f .t//:
(2.222)
t
• The function S.y/ is the negative relative entropy S Œ%y .x/ j %.x/�, where %.x/ is the density of X and %y .x/ follows from the density of %.x/ after a shift of the expectation value to y. If the realizations of X assume only discrete values in a finite set fx1 ; : : : ; xr g with x1 < : : : < xr , then S.y/ is finite and continuous in the interval .x1 ; xr /, while S.y/ D 1 for y outside .x1 ; xr /. For a proof of these statements we refer to the literature (Ellis 1985; Shwartz and Weiss 1995). However, we want to illustrate them for the above-mentioned examples. • Let %.x/ be the normal distribution N.�; � 2 /, i.e., f .t/ is given by (2.208) and its Legendre transform by (2.216). As expected, one finds S.y/ D
.y � �/2 : 2� 2
(2.223)
2.7 The Large Deviation Property for Sums of Random Variables
51
The same result may be obtained by forming the negative relative entropy: Z � S Œ%y .x/ j %.x/� D Z D D
"
e�.x�y/ =2� dx %y .x/ ln �.x��/2 =2� 2 e 2
2
# (2.224)
� dx %y .x/ .x � �/2 =2� 2 � .x � y/2 =2� 2
.y � �/2 : 2� 2
(2.225)
• For large values of N , the mean value YN of N exponential random variables has a density (cf. (2.217)) %N .y/ / exp .�N.my � 1 � ln my/ C o.N // :
(2.226)
The sum Z D N YN of N exponential random variables is also called a gamma distributed random variable. One obtains for its density %Z .z/ D
.mz/N �1 �mz e ; .N � 1/Š
(2.227)
which is in accordance with (2.226). • For the discrete random variable with the possible realizations f�1; 1g and %.˙1/ D 1=2 one finds according to (2.218) 1 %N .y/ D N 2
X
N 1 X ı y� xi N i D1
! / e�NS.y/ ;
(2.228)
1�y 1Cy ln .1 C y/ C ln .1 � y/: 2 2
(2.229)
fxi D˙1g
where S.y/ D
One obtains the same results by forming the negative relative entropy:
.1 C y/=2 � S Œ%y .x/ j %.x/� D %.1/.1 C y/ ln 1=2
.1 � y/=2 C%.�1/.1 � y/ ln 1=2
D
1�y 1Cy ln .1 C y/ C ln .1 � y/: 2 2
(2.230) (2.231)
52
2 Random Variables: Fundamentals of Probability Theory and Statistics
In this case we may use the Bernoulli distribution for an explicit calculation of %.y/ and thus also S.y/. It gives us the probability that N realizations of X yield q times the value 1 and therefore y D .q � .N � q//=N D 2q=N � 1, N %.y/ D q
!� � � � 1 q 1 .N �q/ D 2 2
! N 2�N : N .1 C y/ 2
(2.232)
Using Stirlings formula ln N Š D N.ln N � 1/ C o.N / we obtain � � N N .1 C y/ ln .1 C y/ 2 2 � � N N � .1 � y/ ln .1 � y/ � N ln 2 C o.N / 2 2
1Cy 1�y D �N ln .1 C y/ C ln .1 � y/ C o.N /: 2 2
ln %.y/ D N.ln N � 1/ �
(2.233) (2.234)
In the next chapter we will make use of the representation of the density given in (2.219).
http://www.springer.com/978-3-642-28683-4