Range Image Registration Based on Circular Features ∗ Cecilia Chao Chen Dept. of Computer Science Graduate Center / CUNY New York, NY 10016
Ioannis Stamos Dept. of Computer Science Hunter College / CUNY New York, NY 10021
[email protected]
[email protected]
The presented method thus complements work based on linear features alone [9][10], or point signatures [8]. We envision a larger system that detects and matches features of various geometric shapes (lines, circular or elliptical arcs, spheres, cylinders, etc.).
Abstract Range sensing technology allows the photo-realistic modeling of large-scale scenes, such as urban structures. A major bottleneck in the process of 3D scene acquisition is the automated registration of a large number of geometrically complex 3D range scans in a common frame of reference. The generated 3D representations, after automated registration, are useful for urban planning, historical preservation, or virtual reality applications. Man-made urban scenes provide an abundance of linear features that can be used for the solution of the problem. Many scenes though require the utilization of non-linear primitives. This paper provides a solution of the registration problem based on the robust detection and matching of circular features from the range data sets. We present results from experiments with complex range scans from the interior of a large-scale landmark urban structure (Grand Central Terminal, NYC), where traditional methods would fail. This work is part of a larger range registration system that is based on extracted features of multiple geometric types.
(a)
(b)
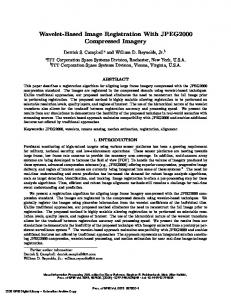
Figure 1: Two range images of the interior of a Grand Central Terminal, NYC. A robust method that extracts distinguishable features from range images is very important for our method. Previous range image segmentation techniques include edge detection [1][2], region growing [3][4], and polynomial surface fitting [3][5]. Most of these methods provide edge maps and/or regions expressed as polynomial functions. This is useful for object modeling and reconstruction, but may not be suitable for feature matching. Our method detects precise edges and extracts geometric features with concise descriptors that make them appropriate for feature matching. Iterative Closest Point (ICP) is one of the most popular range registration algorithms [6][7]. ICP provides very accurate results but requires a good initial guess of the registration transformation. We, on the other hand, utilize ICP as a post-processing step after our automated method brings scans into alignment. A method that does not require knowledge of an initial registration transformation is presented in [8][11] (spin images). The spin images approach does not rely on features of specific geometric type,
1. Introduction The photorealistic modeling of large-scale scenes, such as urban structures, requires a combination of range sensing technology with traditional digital photography. The range sensing part is critical for the accurate geometric description of the scene. A systematic and automatic way for registering 3D range scans is thus essential. This paper presents a novel method that utilizes non-linear features of circular nature extracted from range images to facilitate automated registration. Features of this type are very common in many architectural environments (consider the range scans shown in Fig. 1 for an example). Our approach brings pairs of range scans into very accurate initial alignment making no assumptions about the relative position of the range scans. ∗ Supported in part by NSF CAREER IIS-01-21239, and NSF MRI/RUI EIA-0215962.
1
features include points, circles, etc. For example, point P refers to a point in 3D space, and p refers to the corresponding pixel in the 2D grid image. The directional variation images are obtained as follows: At each point P , let B1 and B2 be its two neighbors along one of the four grid directions (see Fig. 2(a)). The vector from P to B1 is V1 , and from P to B2 is V2 . The variation at each direction for point P is defined as Angle(V1 , V2 )/π. This provides a value in (0, 1] as the intensity value for this 2D directional variation image. Note that if the pixel p (corresponding to P ) has at least one empty neighbor point on the grid, the value is set to 0, and if p is itself an empty point, the value is set to −0.1 (to detect boundary edges). Each 2D directional variation image thus emphasizes surface normal change along one direction (Fig. 2). The combination of the edges detected from them provides us with a complete set of edge points. Representative previous methods involve the estimation of surface normals first, followed by decomposition of x/y directions [4] or analysis of the angle between surface normals of neighboring points [2]. We implemented these methods as well but they are not as robust for curved surfaces for the following reasons: (1) Surface normal computation smooths out the orientation change; (2) Decomposing to x/y direction causes poor results at diagonal edges; and (3) The angle between neighboring surface normals only provides one degree of information, but the direction of change is discarded. 2D edge detection is performed on each of the four directional variation images in Fig. 2. First, Gaussian smoothing is applied to suppress noise. Then, gradients along x and y direction, gx and gy , are computed at each pixel using Sobel operators. With gx and gy we compute the gradient magnitude g. Edge direction dir at each pixel is determined by slope angle angle = arctan(gy /gx ): if angle ∈ π 3π [0, π8 ] ∪ [ 7π 8 , π], dir is horizontal; if angle ∈ ( 8 , 8 ), dir is 3π 5π positive diagonal; if angle ∈ [ 8 , 8 ], dir is vertical; and 7π if angle ∈ ( 5π 8 , 8 ), dir is negative diagonal. The traditional Canny edge detection then carries out non-maximum suppression to obtain a thin edge, followed by hysteresis thresholding to output a specified amount of edge points. In our algorithm, we reverse the order of these two procedures, due to the following considerations: 1) Instead of deciding the number of edge points by ratio, we aim at finding all the points whose neighborhoods contain more significant change than expected in the high resolution range scans of large-scale urban scenes. 2) Applying thresholding in the last step causes discontinuous edges, but we prefer to keep edges as continuous as possible, for the purpose of accurate edge linking and circle fitting in the later phases. So, our algorithm uses a generous threshold 0.35 (allowing the angle change of 5 degrees3 in any direction)
but is sensitive to varying scan resolutions. Furthermore, the extracted point signatures have local support, the extent of which is specified by the user. Our approach detects circular features of any size as long as they exist in the range image. Thus, it does not suffer from limitations on feature support. Approaches that rely on linear features alone [9][10] provide accurate results in scenes of urban nature, but will fail in scenes that do not contain a sufficient amount of lines. Our method thus complements line-based approaches. We are introducing a new range registration algorithm that extracts non-linear features (circles in this article) as well as lines. The proposed algorithm expands the capability of line-based algorithms to recognize more complicated geometric shapes in 3D scenes. The major steps include 3D edge detection, 3D line/3D circle extraction, and circlebased feature matching. Based on our current research, we propose a framework of registering range images based on a variety of geometric shapes and other feature descriptors.
2. 3D Edge Detection Each range scan Ri is represented as a 2D array of 3D points {P(k, l), k = 1 . . . N, l = 1 . . . M }1 . Within each range image we consider 3D edges of the following two types: (a) edges caused by surface normal discontinuities (roof edges), and (b) edges caused by depth discontinuities (step edges). Step edges are further divided into edges caused by one surface occluding another (occlusion edges), and edges caused by 3D surface boundaries (boundary edges). We briefly summarize the algorithm for detecting edges of various types. First the surface orientation change at each point is decomposed into variations along four grid directions. This grid is the 2D structured grid on which each range image is organized (as mentioned in the previous paragraph). We thus obtain four values at every 3D point, that we call directional variation values. In the structured 2D grid we form four 2D images. The intensity value at each pixel is the surface variation (we define it properly in the next paragraphs) of the corresponding 3D point. We call the four 2D images directional variation images. 2D Canny-based edge detection is performed on each image. Finally the 2D edges are combined and projected2 back to the 3D range image space, providing the final 3D edges due to surface normal discontinuities or depth discontinuities. Before providing more details, let us first define the notation in this paper. During the edge detection process on 2D directional variation images, 3D information such as range depth and 3D distance between range points is often needed. To minimize ambiguity, we use capital letters to denote features in 3D space, and lower case letters for 2D space. The 1 The indices k, l define the position and orientation of the laser-beam which produces the 3D point P(k, l). 2 Each pixel p(k, l) in the grid-point image corresponds to a 3D point P(k, l).
3 We
2
know that at each non-boundary point, the directional variation
a background neighbor. To find these points, we map the 2D edge points back to 3D range scan and label a 3D point P if its corresponding pixel p is an edge point. For an edge point P , let B1 and B2 be its two neighbors perpendicular to its edge direction.4 If Distance(P, B1 )>>Distance(P, B2 ) and Depth(B1 )