Progress In Electromagnetics Research, Vol. 144, 11–21, 2014
Range-Spread Target Detection in Compound Gaussian Clutter with Reciprocal of the Square Root of Gamma Texture Yanzhao Gao* , Ronghui Zhan, and Jianwei Wan Abstract—In this paper, the range-spread target detection in compound Gaussian clutter with reciprocal of the square root of gamma (RSRG) texture is investigated. The RSRG distribution has been proved to be a good model for texture component of extremely heterogeneous radar clutter. Taking this compound Gaussian model as a spherically invariant random process (SIRP), the Neyman-Pearson optimal detector for the range-spread target detection with known target amplitude is derived firstly. By replacing the ideal target amplitude with its maximum likelihood estimate (MLE), the generalized likelihood ratio test (GLRT) is then obtained. The statistical property of the texture component is taken into account in both of these two detectors, which makes the detectors computationally complicated. A suboptimal generalized likelihood ratio test based on order statistics (OS-GLRT) is finally proposed by substituting the texture component with its MLE. The OS-GLRT makes use of some largest observations from the range cells occupied by the most likely target scatters. The performance assessment conducted by Monte Carlo simulation validates the effectiveness of the proposed detectors.
1. INTRODUCTION The adaptive detection of point-like target against different kinds of clutter for the low-resolution radar has been studied for several decades, and some strategies were addressed partly in [1–9]. However, the application of the modern pulse compression techniques makes the high-resolution radar capable of resolving a target into a number of discrete scattering centers. These discrete scattering centers of a so-called range-spread target always occupy several range cells in the radar returns, and it could be referred to as multiple dominant scattering (MDS) centers [10]. It has been pointed out that increasing the radar range resolution can reduce the amount of energy per range cell backscattered by distributed clutter, and the radar detection performance, therefore, could be enhanced largely by making use of appropriate detection strategies [11]. However, the detection strategies for the point-like target may have poor performance for the range-spread target because they are not able to take full advantage of the backscattered energy of a target in the discrete range cells. The detection of range-spread target embedded in different kinds of clutter background has received considerable attentions in the recent years. The detection strategies in Gaussian-distributed clutter have been investigated in [11–15]. The N out of M (N/M ) detector and the integration detector are proposed in [11]. It is pointed out that the latter performs better than the former except that the target is composed of a single strong point. In [12], the optimal and suboptimal receiver frameworks are designed in the white Gaussian clutter background, which is considered as the theoretical basis of rangespread target detection. In [13], a reasonable distribution for the target scatterer density is employed in the range-spread target detection, and the scatterer density dependent generalized likelihood ratio test (SDD-GLRT) is proposed. For the singular covariance matrix, a modified generalized likelihood ratio test (MGLRT) is designed in [14]. Moreover, an orthogonal rejection MGLRT (OR-MGLRT) is introduced in [15] for range-spread target detection in correlated Gaussian noise and used as the second stage of a double threshold receiving structure. Received 10 October 2013, Accepted 4 December 2013, Scheduled 11 December 2013 * Corresponding author: Yanzhao Gao (
[email protected]). The authors are with the School of Electronic Science and Engineering, National University of Defense Technology, China.
12
Gao, Zhan, and Wan
In the situations such as low grazing angles and/or high-resolution radar, the background clutter may no longer be modeled accurately as a Gaussian random variable [16]. Some heavy-tailed radar clutter models, such as K distribution [16–18], Pareto distribution [19, 20], KK distribution [21, 22], are utilized in the target detection scheme design. In [16], the K-distribution is expressed as spherically invariant random process and then two CFAR detectors, i.e., scatterer density dependent GLRT (SDDGLRT) and non-scatterer density dependent GLRT (NSDD-GLRT), are proposed. For the case when the target scattering centers occupy only a fraction of the range cells under test, it is pointed out that the amplitudes of the so-called “hot spots” on a target are significantly greater than the other range cells. Two detectors, i.e., generalized likelihood ratio test based on order statistics (OS-GLRT) and OS-GLRT with dynamic threshold (DOS-GLRT), are discussed in [17] to overcome the “collapsing loss”. In [18], a robust detector with CFAR property is proposed, which cascades a detector based on the GLRT and two binary integrators. Validation of the resultant Pareto clutter intensity model for X-band radar returns has been included in [23, 24]. The target detectors based on Pareto distribution, i.e., the optimal detector, the GLRT detector and the whitening matched filter (WMF), are compared in [19, 20]. The optimal decision rules for the totally known constant target based on Neyman-Pearson criterion in KK-distributed radar clutter is derived in [21]. Additionally, the GLRT detector is proposed, which makes use of the MLE of the target amplitude. Both these two detectors are dependent on the modified Bessel-function of the second kind. A computationally simpler suboptimal detection scheme, using a well-known Bessel identity to eliminate the Bessel function dependence, is derived in [22]. The simulation results show that small detection losses are possible if an appropriate number of looks are chosen. The RSRG texture model is proposed in [25] as a particular case of the square root of generalized inverse Gaussian distribution. It is capable of modeling texture component of radar clutter with different degrees of heterogeneity and has been widely applied in heavy-tailed radar clutter modeling, such as SAR clutter [26, 27], C-band scanning radar [28], etc.. In this paper, the range-spread target detection in compound Gaussian clutter with RSRG texture is investigated. The optimal detector based on Neyman-Pearson criterion with known constant target amplitude is introduced firstly. However, in a real application, the target is unknown and hence it must be estimated. By replacing the uncertain target amplitude with its MLE, the GLRT detector is then obtained. The statistical property of the texture component is considered in both of these two detectors, which makes the detectors more computationally complicated. Substituting the texture component with its MLE, the OS-GLRT is finally derived. The remainder of this paper is organized as follows. The compound Gaussian distribution with RSRG texture is introduced in Section 2. The detection problem with target and clutter models is formulated in Section 3. Section 4 is devoted to the design of the detectors in the compound Gaussian distributed clutter, followed by their performance assessment in Section 5. The concluding remarks are given in Section 6. 2. COMPOUND GAUSSIAN MODEL WITH RSRG TEXTURE The compound Gaussian distribution with RSRG texture is derived from the multiplicative clutter model. It takes the clutter observations as a product of two independent random variables: one (X) modeling the speckle noise and the other (Y ) modeling the terrain backscatter, i.e., the texture component. Therefore, the observations are defined by the product Z = X ·Y . It is considered that both the imaginary and real part of the speckle noise can be modeled by correlated Gaussian distribution, resulting in Rayleigh distributed speckle noise, which is characterized by the density µ ¶ x2 x (1) fX ( x| y) = 2 exp − 2 , x, y > 0, y 2y where y is the parameter representing the texture component. The RSRG distribution is proposed as a special case of the square root of generalized inverse Gaussian distribution. In [25], it is pointed out that the RSRG distribution is an outstanding model for the homogeneous, heterogeneous, and extremely heterogeneous clutter data. Its probability density function (PDF) is given by ¡ ± ¢ 2 y 2α−1 exp −γ y 2 , −α, γ, y > 0. (2) fY (y) = α γ Γ (−α)
Progress In Electromagnetics Research, Vol. 144, 2014
Then the compound Gaussian distribution can be written as ¡ ¢α−1 Z ∞ −αx x2 + 2γ fZ (x) = fX ( x| y)fY (y)dy = , γ α 2α−1 0
13
−α, γ, x > 0.
(3)
From (3), it can be seen that the compound Gaussian distribution is actually the single-look amplitude G0 distribution, whose rth order moments are given by ´ ³r Γ (−α − r/2) + 1 γ r/2 . (4) E {Z r } = 2r/2 Γ 2 Γ (−α) 3. PROBLEM FORMULATION Assume that the radar returns are collected from N coherent pulses. The problem of range-spread target detection can be expressed as judging the presence of a range-spread target across K range cells zk (k = 1, 2, . . . , K). It is supposed that the possible target is completely contained within the K range cells, and its range migration is neglected within a coherent processing interval (CPI). A secondary data set zk (k = K + 1, . . . , K + R) without any useful target echo is also collected, including pure clutter with the same statistical properties as the primary data. It is also assumed that the clutter power is significantly greater than the internal noise contribution [17]. In other words, the internal noise has little effect on the detector performance. Therefore, the internal noise can be ignored, and the detection problem can be formulated in terms of the following binary hypotheses test zk = ck , k = 1, 2, . . . , K + R H0 : ½ zk = βk p + ck , k = 1, 2, . . . , K , (5) H1 : z = c , k = K + 1, . . . , K + R k k The complex random variable βk (k = 1, 2, . . . , K) accounts for target characteristics, which is assumed to be constant from scan to scan. Therefore, |βk | (k = 1, 2, . . . , K) is the target amplitude. The parameter p is the steering vector, i.e., p = (1, ejf0 , ej2f0 , . . . , ej(N −1)f0 )T where f0 denotes a constant and known phase shifting, and (·)T represents transpose. The SIRP provide a general formulation of the joint density of a non-Gaussian random process. Traditionally, a SIRP is introduced as a process whose finite order subprocesses, called spherically invariant random vector (SIRV), possess a specific density. However, due to an equivalent formulation, the SIRV and SIRP can be specified in a manner more intuitive to the modeling of radar returns as follows. The N -dimension complex envelope of the clutter return ck in range cell k is called SIRV if it can be written in the compound Gaussian formulation: ck = τk · ηk ,
k = 1, . . . , K + R,
(6)
where the texture component τk is a nonnegative real valued univariate random variable with density fτ , and the speckle noise ηk = [ηk (1), ηk (2), . . . , ηk (N )]T is zero mean complex Gaussian random vector, or multidimensional complex Gaussian process. It is assumed that τk and ηk are independent from range cell to range cell. In this paper, the texture component is modeled by RSRG distribution ¡ ± ¢ 2 fτ (τk ) = α τk2α−1 exp −γ τk2 , −α, γ, τk > 0, (7) γ Γ (−α) The covariance matrix Σ associated with ηk (k = 1, 2, . . . , K + R) is defined as Σ = E{ηk ηkH },
k = 1, . . . , K + R,
(8)
where (·)H represents conjugate transpose. For concise, it is assumed that in each range cell there is at most one scattering center. In many application cases, the scattering centers of a range-spread target may occupy only a fraction of the K range cells. Furthermore, the amplitudes of range cells containing target scattering centers are significantly greater than that of range cells with pure clutter [16]. If these range cells with pure clutter are integrated in the target detection process, the detection performance may be degraded, which is called “collapsing loss” [29]. Let ΘJ denote the index set of range cells containing target scattering
14
Gao, Zhan, and Wan
centers, where the subscript J represent the number of scattering centers, i.e., the number of effective range cells. Then the binary hypotheses test in (5) can be simplified as ½ H0 : zk = ck , k ∈ ΘJ . (9) H1 : zk = βk p + ck , k ∈ ΘJ 4. DETECTORS DESIGN It is assumed that the normalized covariance matrix Σ in (8) and p in (9) is known. According to the previous assumptions, the joint PDF of zk (k ∈ ΘJ ) conditioned on τk and βk under each hypothesis is given by · ¸ Y Y 1 qi (k) f ( zk | τk , βk , Hi ) = exp − 2 , i = 0, 1, (10) τk τk2N |Σ| k∈ΘJ
k∈ΘJ
−1 H −1 where |·| denotes determinant, and q0 (k) = zH k Σ zk , q1 (k) = (zk − βk p) Σ (zk − βk p). Taking account of the RSRG distribution of the texture component τk , the joint conditional PDF of zk (k ∈ ΘJ ) conditioned on βk can be expressed as Y Y Y Z ∞ f ( zk | βk , Hi ) = Eτ {f ( zk | τk , βk , Hi )} = f ( zk | τk , βk , Hi ) · fτ (τk )dτk k∈ΘJ
k∈ΘJ
=
Y Z
k∈ΘJ
∞
0
k∈ΘJ
·
¸
0
1 qi (k) exp − 2 · fτ (τk )dτk τk2 N |Σ| τk
Hence if we define a function hS (s)
Z
hS (s) =
∞
0
1 τk2N
i = 0, 1.
¸ s exp − 2 · fτ (τk )dτk τk
(11)
·
(12)
Then for the RSRG texture component, by substituting the PDF (7) in (12) it yields hS (s) =
Γ(N − α)(s + γ)α−N Γ(−α)γ α
Now the clutter joint density conditioned on βk can be written in the compact form as Y 1 Y hS (qi (k)), i = 0, 1 f ( zk | βk , Hi ) = |Σ|J k∈ΘJ k∈ΘJ
(13)
(14)
The function hS (s) defined in (12) is of great importance in SIRP theory, as all densities of interest are expressed in terms of it. It is thus called the characteristic function. 4.1. The Optimal Detector To simplify the analysis, it is assumed that the target amplitude βk (k ∈ ΘJ ) is a fixed constant that is completely specified. The Neyman-Pearson optimal detector is the ratio of the densities under H1 and H0 hypothesis. Hence, according to (14), the likelihood ratio test can be expressed as Y Y (q1 (k) + γ)α−N hS (q1 (k)) k∈Θ
k∈Θ
λopt = YJ
hS (q0 (k))
k∈ΘJ
= YJ
(q0 (k) + γ)α−N
k∈ΘJ
The logarithmic expression of (15) is further given by X X λopt = (α − N ) ln (q1 (k) + γ) − ln (q0 (k) + γ) k∈ΘJ
(15)
k∈ΘJ
(16)
Progress In Electromagnetics Research, Vol. 144, 2014
Then the optimal decision rule is λopt
15
H1 ≷ Gopt H0
(17)
where Gopt is the detection threshold, which can be determined numerically from the given false alarm H1
ratio. The notation X ≷ Y means that the H0 hypothesis is rejected if and only if X > Y . The detection H0
statistic in (16) is a function of the fixed target echo, which is assumed to be totally known. As a result, different thresholds Gopt are required to maintain a fixed false alarm ratio for varying signal to clutter ratio (SCR) and different distributions of the target energy in the J range cells. 4.2. GLRT Detector In a real application, the amplitude of the target echo in each range cell is unknown and hence βk (k ∈ ΘJ ) has to be estimated firstly in the target detection process. As the assumption aforementioned, the βk (k ∈ ΘJ ) is constant from scan to scan. Then these parameters are estimated by the ML estimator. By applying the MLE to (17), the GLRT detector with known covariance matrix Σ can be derived as Y max hS (q1 (k)) βk
k∈ΘJ
Y
λGLRT =
hS (q0 (k))
H1 ≷ GGLRT H0
(18)
k∈ΘJ
where GGLRT is the detection threshold. The MLE of βk (k ∈ ΘJ ) can be obtained by maximizing the function hN (q1 (k)) in (14), i.e., pH Σ−1 zk βˆk = H −1 , k ∈ ΘJ (19) p Σ p From (19) and (18), the logarithmic expression of GLRT detector is given by X X H1 ln (q0 (k) + γ) ≷ GGLRT ln (ˆ q1 (k) + γ) − λGLRT = (α − N ) H0
k∈ΘJ
k∈ΘJ
(20)
where qˆ1 (k) denotes the estimate of q1 (k) with βˆk in (19). 4.3. OS-GLRT Detector Both of the statistical properties of the two components, i.e., the speckle noise and texture component are considered in the optimal detector and the GLRT detector. Considering that 1) the number and the location of the range cells containing target scattering centers are unknown, i.e., the set ΘJ is unknown; 2) it is computationally complicated to obtain the MLE of βk (k ∈ ΘJ ), the aforementioned two detectors are not practicable in the real scenarios. In this subsection, the GLRT detector based on order statistics is proposed, in which the statistical property of the texture component is ignored, and the true τk (k ∈ ΘJ ) in the range cells are replaced by their MLEs. According to the OS method, some largest observations from the range cells occupied by the most likely target scattering centers are utilized to overcome the “collapsing loss” resulting from the lack of scattering center information. Under the assumption that the normalized clutter covariance matrix Σ is known, the GLRT without the statistical property of texture component can be derived from Y max max f ( zk | τk , βk , H1 ) τ
λGLRT =
β
max τ
k∈ΘJ
Y
k∈ΘJ
f ( zk | τk , H0 )
H1 ≷ GGLRT H0
(21)
16
Gao, Zhan, and Wan
By substituting (10) in (21), the GLRT can be written as · ¸ Y 1 q1 (k) max max exp − 2 τ β τk τ 2N k∈ΘJ k · ¸ λGLRT = Y 1 q0 (k) max exp − 2 2N τ τk τ k k∈Θ
(22)
J
In (22), the MLE of τk (k ∈ ΘJ ) under the hypotheses H0 and H1 can be derived by utilizing the MLE of βk (k ∈ ΘJ ) in (19) as 1 qˆ0 (k) 2N 1 H1 : τˆk = qˆ1 (k) 2N Substituting (19) and (23) into (22), the GLRT is denoted as " # ¯ H −1 ¯2 ¯p Σ zk ¯ X H1 λGLRT = −2(N − 1) ln 1 − ¡ H −1 ¢ ¡ H −1 ¢ ≷ GGLRT zk Σ zk pk Σ pk H0 k∈Θ H0 : τˆk =
(23)
(24)
J
Define a quantity wk as
¯ H −1 ¯2 ¯p Σ zk ¯ wk = ¡ H −1 ¢ ¡ H −1 ¢ , zk Σ zk pk Σ pk
(25)
which is part of the detection statistical in (24). From the previous formula, the quantity wk can be interpreted as the normalized energy of zk after matched filtering. Then the set ΘJ can be estimated according to the values of normalized energy wk [17]. In sort descending, the order statistics of wk (k ∈ ΘK ) are denoted as w(1) ≥ w(2) ≥ . . . ≥ w(k) ≥ . . . ≥ w(K)
(26)
Hence, the detection statistic of the OS-GLRT detector can be obtained from the first J elements of the set w(k) (k = 1, 2, . . . , J) as λOS-GLRT = −2(N − 1)
J X k=1
¡ ¢H1 ln 1 − w(k) ≷ GOS-GLRT H0
(27)
where GOS-GLRT is the detection threshold of the OS-GLRT detector. 5. PERFORMANCE ASSESSMENT The performance of the optimal detector, GLRT detector, and OS-GLRT detector are assessed by the Monte-Carlo simulation in this section. It is assumed that the normalized covariance matrix Σ is Toeplitz, and the power spectrum density (PSD) of the speckle noise is supposed to be Lorentzian. Therefore, the clutter samples are generated from an exponential correlation structure, i.e., the elements of the matrix Σ is given by [30] [Σ]i,j = γc|i−j| , 1 ≤ i, j ≤ N (28) where the parameter γc denotes the one-lag correlation coefficient. The texture is modeled by the RSRG distribution as given in (7), in which α is the shape parameter controlling the deviation from Gaussian statistics and γ is the scale parameter indicating the mean of the distribution. Without loss of generality, the scale parameter γ is set as γ = 10. Firstly, a group of clutter samples with RSRG texture are generated for the shape parameter α = −1.5. The amplitudes of the target scattering centers in the range cells are assumed to be independent identical distribution (IID), zero-mean complex circular Gaussian random vectors (RV) with the variance E{|βk |2 } = εk σs2 K (k ∈ ΘJ ), where εk implies the fraction of the total energy in the given range cell
Progress In Electromagnetics Research, Vol. 144, 2014
17
Table 1. Values of εk for typical MDS models. Model Number 1 2 3
1 1/J 0.5 0.9
Range Cell Number 2 ... J 1/J 1/J 1/J 0.5/(J − 1) 0.5/(J − 1) 0.5/(J − 1) 0.1/(J − 1) 0.1/(J − 1) 0.1/(J − 1)
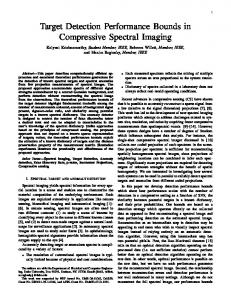
k, and the σs2 indicates the average signal power per range cell. In this paper, three typical multiple dominant scatters models are considered in Table 1. The performance of these detectors depend on the parameters, such as βk (k ∈ ΘJ ), p, etc., only through the input SCR defined as σ2 (29) SCR = s2 pH Σ−1 p σc where σc2 = E(|c|2 ) = 2γ/(−α − 1) indicates the average clutter power per range cell. It is really hard to compute the analytic detection threshold for a given false alarm probability PF . Alternatively, the thresholds are obtained by Monte-Carlo simulation. Moreover, the probability of detection PD is estimated based on Monte-Carlo simulation. The trials of Monte-Carlo simulations used to calculate PF and PD are 100/PF and 10000, respectively. In order to alleviate the computational burden, it is assumed that PF = 10−4 , and the other parameters are set to be K = 12, J = 5, N = 5, f0 = 0.4, γc = 0.99. Firstly, the effect of different MDS models on the performance of these three detectors is evaluated. In Figure 1, the plots of PD versus SCR of the three detectors are given for the three different MDS models in Table 1. It can be seen from the plots that all the three detectors has the best performance with MDS Model 1, where the target energy is uniformly distributed in J range cells. If most of the target energy is concentrated in one range cell, the performance of the three detectors is degraded. From (16), (20), and (27), the detection statistics of the three detectors are expressed as the product or logarithmic sum of the returns in the J range cells. Therefore, if the total target energy in all the J range cells is given, it can be concluded that the detection statistics achieve their maximum value when the target energy is uniformly distributed. Contrarily, if the target energy is gradually concentrated, the three detection statistics are all getting smaller, which results in significant detection loss.
Figure 1. PD versus SCR of the three detectors with MDS Model 1–Model 3.
Figure 2. Detection threshold of the optimal detector versus SCR with the MDS Model 1– Model 3.
18
Gao, Zhan, and Wan
If the target energy is uniformly distributed, taking the MDS Model 1 as an example, it can be seen that the optimal detector has the best performance, and the performance of OS-GLRT detector is the most poor. It also can be seen that the optimal detector is much better than the GLRT detector; and the performance discrepancy of the OS-GLRT detector and GLRT detector is not that evident. This means that the primary factor which affects the detector performance mostly is the estimation accuracy of the amplitude βk (k ∈ ΘJ ); and the statistical property of the texture has much less influence. If the target energy is concentrated, taking the MDS Model 3 for example, the GLRT detector has the best performance and the performance of the optimal detector, contrarily, is very poor. This means that the optimal detector is significantly affected by different MDS models. The detection statistic of the optimal detector is obtained under the condition that the target amplitudes are totally known. As aforementioned, the detection threshold must be changed to maintain a fixed PF for different SCRs or/and different distributions of the target energy in the J range cells. In Figure 2, the detection threshold of the optimal detector versus SCR is plotted for the three MDS models. It is seen from Figure 2 that the detection thresholds for the three MDS models have the same trend, and all of them are not monotone with the SCR increasing from −10 dB to 20 dB. For the range cells without target scattering centers, since 1) the variable q1 is increasing when the SCR is below 0 dB, and it is degressive if the SCR is greater than 0 dB; 2) the detection statistic of the optimal detector in (16) is a monotonically increasing function of q1 , the detection statistic increases firstly and then decreases as the same as q1 . As a result, the detection thresholds changes as in Figure 2 to maintain a fixed PF . Table 2 lists the runtimes of the three detectors for 10000 Monte-Carlo trials. From this table, the runtime consumed by the OS-GLRT detector is roughly as long as the optimal detector. The GLRT detector, however, consumes much more runtime because the amplitudes of the target scattering centers must be estimated in its procedure. Considering that: 1) the target energy is always totally unknown in the real applications; 2) the GLRT is computationally expensive, the OS-GLRT detector, therefore, is more applicable in the compound Gaussian clutter with RSRG texture. Table 2. The runtimes of the three detectors for 10000 Monte-Carlo trials. Detectors Runtime/s
Optimal Detector 8.2325
GLRT Detector 12.7317
OS-GLRT Detector 8.2183
Then the performance of the OS-GLRT detector with different parameters is considered. The performance of the OS-GLRT detector is compared for different false alarm rate, i.e., PF = 10−6 and PF = 10−4 , in Figure 3. It can be seen clearly that the PD declines when the PF decrease from 10−4 to 10−6 for all the three models. For the Model 3, the variation of the probability PD is up to 0.3702,
Figure 3. PD versus SCR of the OS-GLRT detector for different PF .
Figure 4. PD versus SCR of the OS-GLRT detector with different shape parameter α.
Progress In Electromagnetics Research, Vol. 144, 2014
19
Figure 5. PD versus SCR of the OSGLRT detector with different one-lag correlation coefficient γc .
Figure 6. PD versus SCR of the OS-GLRT detector with different constant phase shifting f0 .
Figure 7. PD versus SCR of the OS-GLRT detector with different N .
Figure 8. PD versus SCR of the OS-GLRT detector with different estimated number of scattering centers Je .
which is much greater than the ones for the Model 1. It means that the effect of PF on the probability of detection is more evidently if the target energy is more un-uniformly distributed. Figure 4 plots the probability of detection versus SCR of the OS-GLRT detector with different shape parameter α of the RSRG texture. The results indicate that the detection performance is improved evidently as the shape parameter α increases from −10 to −0.8. According to [25], the shape parameter α is related to the degree of homogeneity. Concretely, a larger α suggests more heterogeneous clutter region. Therefore, the OS-GLRT performs better in the target detection against more heterogeneous clutter. The performance of the OS-GLRT detector with different one-lag correlation coefficient γc and constant phase shifting f0 is given in Figure 5 and Figure 6. The figures show that the OS-GLRT detector is not affected by these two parameters. In Figure 7, the curves of PD versus SCR for OSGLRT detector are given with different numbers of coherent pulse N . It is observed that the detection performance is improved evidently as N increases from 3 to 8. Let Je denotes the estimated number of the scattering centers. All the simulation results in Figure 3–Figure 7 of the OS-GLRT detector are obtained for the match case, i.e., the estimated number of scattering centers equals the actual one (Je = J). However, the actual number of scattering centers of a range-spread target is always unknown and cannot be estimated exactly in the real application. The PD versus SCR of the OS-GLRT detector for different Je are plotted in Figure 8 for J = 5. It is observed that the OS-GLRT detector performs best in the match case. When the estimated number of scattering centers is larger than the actual one (Je = 7, 9), the SCR loss due to mismatch is small; however, when the estimated number of scattering centers is smaller than the actual one (Je = 1, 3), OS-GLRT is
20
Gao, Zhan, and Wan
degraded sharply, especially for Je = 1. The reason account for this is that some of the range cells occupied by target scattering centers are not integrated in the statistic detection for OS-GLRT when Je < J. 6. CONCLUSIONS In this paper, the range-spread target detection in the compound Gaussian distributed clutter with RSRG texture is studied. Three detectors, i.e., the optimal detector, GLRT detector, and the OSGLRT detector, are considered. Base on the simulation results, it can be concluded that: 1) The optimal detector has the best performance if the target energy is uniformly distributed. However, it has a severely detection loss if most of the target energy is concentrated in one range cell. 2) The detection threshold of the optimal detector must be changed to maintain a constant false alarm probability for different SCRs or/and distributions of target energy. 3) The GLRT is computationally expensive compared with the other two detectors because of the estimation of the target energy in its procedure. 4) The OS-GLRT detector is carried out without the statistical property of the texture. It has worse performance than the others if the target energy is uniformly distributed. However, it is computationally cheaper than the others. Moreover, it performs very well if the target energy is concentrated. 5) The OS-GLRT detector is hardly affected by the one-lag correlation coefficient γc and the constant phase shifting f0 . It is more applicable for the range-spread target detection in the compound Gaussian distributed clutter with RSRG texture, especially in the heterogeneous region. 6) The OS-GLRT detector is more robust for the case when the estimated number of scattering centers is larger than the actual (Je > J) than the cases when Je < J. ACKNOWLEDGMENT This work was supported in part by National Science Foundation of China (Grant No. 61002022). REFERENCES 1. Kelly, E. J., “An adaptive detection algorithm,” IEEE Transactions on Aerospace and Electronic Systems, Vol. 22, No. 1, 115–127, 1986. 2. Robey, F. C., et al., “A CFAR adaptive matched filter detector,” IEEE Transactions on Aerospace and Electronic Systems, Vol. 28, No. 1, 208–216, 1992. 3. Hansen, V. G., “Constant false alarm rate processing in search radars,” Proceedings of the IEEE 1973 International Radar Conference, 325–332, London, 1973. 4. Zhou, W., J. T. Wang, H. W. Chen, and X. Li, “Signal model and moving target detection based on MIMO synthetic aperture radar,” Progress In Electromagnetics Research, Vol. 131, 311–329, 2012. 5. Hao, C., F. Bandiera, J. Yang, D. Orlando, S. Yan, and C. Hou, “Adaptive detection of multiple point-like targets under conic constraints,” Progress In Electromagnetics Research, Vol. 129, 231– 250, 2012. 6. Hatam, M., A. Sheikhi, and M. A. Masnadi-Shirazi, “Target detection in pulse-train MIMO radars applying ICA algorithms,” Progress In Electromagnetics Research, Vol. 122, 413–435, 2012. 7. Tian, B., D. Y. Zhu, and Z. D. Zhu, “A novel moving target detection approach for dual-channel SAR system,” Progress In Electromagnetics Research, Vol. 115, 191–206, 2011. 8. Gao, F., A. Ru, J. Sun, and A. Hussain, “A novel SAR target detection algorithm based on contextual knowledge,” Progress In Electromagnetics Research, Vol. 142, 123–140, 2013. 9. Mohammadpoor, M., R. S. A. Raja Abdullah, A. Ismail, and A. F. Abas, “A circular synthetic aperture radar for on-the-ground object detection,” Progress In Electromagnetics Research, Vol. 122, 269–292, 2012. 10. Wehner, D. R., High-resolution Radar, Artech House, Norwood, MA, 1995.
Progress In Electromagnetics Research, Vol. 144, 2014
21
11. Hughes, P. K., “A high-resolution radar detection strategy,” IEEE Transactions on Aerospace and Electronic Systems, Vol. 19, No. 5, 663–667, 1983. 12. Van Trees, H. L., Detection Estimation and Modulation Theory, Wiley, New York, 1971. 13. Gerlach, K., M. Steiner, and F. C. Lin, “Detection of a spatially distributed target in white noise,” IEEE Signal Processing Letters, Vol. 4, No. 7, 198–200, 1997. 14. Maio, A. D., A. Farina, and K. Gerlach, “Adaptive detection of range spread targets with orthogonal rejection,” IEEE Transactions on Aerospace and Electronic Systems, Vol. 43, No. 2, 738–752, 2007. 15. Gerlach, K. and M. J. Steiner, “Adaptive detection of range distributed targets,” IEEE Transactions on Signal Processing, Vol. 47, No. 7, 1844–1851, 1999. 16. Gerlach, K., “Spatially distributed target detection in non-Gaussian clutter,” IEEE Transactions on Aerospace and Electronic Systems, Vol. 35, No. 3, 926–934, 1999. 17. He, Y., T. Jian, et al., “Novel range-spread target detectors in non-Gaussian clutter,” IEEE Transactions on Aerospace and Electronic Systems, Vol. 46, No. 3, 1312–1328, 2010. 18. Jian, T., Y. He, F. Su, et al., “Cascaded detector for range-spread target in non-Gaussian clutter,” IEEE Transactions on Aerospace and Electronic Systems, Vol. 48, No. 2, 1713–1725, 2012. 19. Weinberg, G. V., “Coherent multi-look radar detection for targets in Pareto distributed clutter,” Defence Science and Technology Organization, 2012. 20. Weinberg, G. V., “Coherent CFAR detection in compound Gaussian clutter with inverse gamma texture,” EURASIP Journal on Advances in Signal Processing, Vol. 2013, 105, 2013. 21. Weinberg, G. V., “Coherent multi-look radar detection for targets in KK-distributed clutter,” Digital Communication, 2012. 22. Weinberg, G. V., “Suboptimal coherent radar detection in a KK-distributed clutter environment,” International Scholarly Research Network Signal Processing, 2012. 23. Balleri, A., A. Nehorai, and J. Wang, “Maximum likelihood estimation for compound-Gaussian clutter with inverse-gamma texture,” IEEE Transactions on Aerospace and Electronic Systems, Vol. 43, No. 2, 775–780, 2007. 24. Weinberg, G. V., “Assessing the Pareto fit to high resolution high grazing angle sea clutter,” Electronics Letters, Vol. 47, No. 8, 516–517, 2011. 25. Frery, A. C., H. J. M¨ uller, C. F. Yanasse, et al., “A model for extremely heterogeneous clutter,” IEEE Transactions on Geoscience and Remote Sensing, Vol. 35, No. 3, 648–659, 1997. 26. Moser, G., J. Zerubia, and S. B. Serpico, “Dictionary-based stochastic expectation-maximization for SAR amplitude probability density function estimation,” IEEE Transactions on Geoscience and Remote Sensing, Vol. 44, No. 1, 188–200, 2006. 27. Moser, G., J. Zerubia, and S. B. Serpico, “SAR amplitude probability density function estimation based on a generalized Gaussian model,” IEEE Transactions on Image Processing, Vol. 15, No. 6, 1429–1442, 2006. 28. Xu, Z., “Modeling of sea clutter and target detection in sea clutter,” Graduate School of National University of Defense Technology, Changsha, China, 2012. 29. Nitzberg, R., “Effect of a few dominant specular reflectors target model upon target detection,” IEEE Transactions on Aerospace and Electronic Systems, Vol. 14, No. 4, 670–673, 1978. 30. Gini, F. and M. Greco, “Covariance matrix estimation for CFAR detection in correlated heavy tailed clutter,” Signal Processing, Vol. 82, 1495–1507, 2002.