Ranking Feature Sets for Emotion Models used in Classroom Based Intelligent Tutoring Systems David G. Cooper1 , Kasia Muldner2 , Ivon Arroyo1 , Beverly Park Woolf1 , and Winslow Burleson2 1
2
University of Massachusetts, Department of Computer Science, 140 Governors Drive, Amherst MA 01003, USA,
[email protected] Arizona State University, School of Computing and Informatics, Tempe AZ 85287,USA
Abstract. Recent progress has been made in using sensors with Intelligent Tutoring Systems in classrooms in order to predict the affective state of students users. If tutors were able to interpret sensor data with new students based on past experience, rather than having to be individually trained, then tutor developers could evaluate various methods of adapting to each student’s affective state using consistent predictions. Our classifiers for emotion have predicted student emotions with an accuracy between 78% and 87%. However, it is still unclear which sensors are best, and the educational technology community needs to know this to develop better than baseline classifiers, e.g. ones that use only frequency of emotional occurrence to predict affective state. This paper suggests a method for comparing classifiers using different sensors as well as a method for validating the classifiers on a novel population. This involves training our classifiers on data collected in the Fall of 2008 and testing them on data collected in the Spring of 2009. Results of the comparison show that the classifiers for some affective states are significantly better than the baseline, and a validation study found that not all classifier rankings generalize to new settings. The analysis suggests that though there is some benefit gained from simple linear classifiers, more advanced methods are needed for better results.
1
Introduction
Student affect plays a key role in determining learning outcomes from instructional situations [1, 2]. For instance, learning is enhanced when empathy or support is present [3, 4]. While human tutors naturally recognize and respond to affect [5, 6], doing so is quite challenging for Intelligent Tutoring Systems (ITS), in part due to the lack of directly observable information on a students’ affect. We constructed models of student emotion so that an ITS can respond appropriately to both the affect and the performance of the student. With the advent of inexpensive sensor technology, we have been able to deploy systems that collect students’ physical responses in conjunction with the actions that they take using the ITS. These are used to infer student affect. Specifically, in the Fall of 2008
(for training) and the Spring of 2009 (for validation), we performed a number of experiments in the classrooms of schools in both Western Massachusetts and Arizona. The experiments in the Fall included just under 100 students, and the experiments in the Spring had over 500 students. In each experiment, students were queried about four emotional states (Confident,Interested, Frustrated, and Excited), providing the standard for comparing our models. The Fall data was used to construct a number of linear classifiers for each emotional state, as we reported in [7]. The best classifiers for a given emotion obtained accuracies between 78% and 87% when performing a leave-one-student-out cross-validation. In general, it is important to validate the classifiers and verify that their performance generalizes to a new and/or larger population. This is particularly the case for our data, obtained from a classroom setting which involves a higher degree of noise and other distractions than standard controlled laboratory experiments. We also wanted to verify that our classifiers perform better than guessing based purely on the training labels (i.e. always guess yes if the labels were yes most of the time, or no if the labels were no most of the time). In addition to validating our classifier performance, we also wanted to investigate whether having a particular sensor or set of sensors improved model performance over using only features from the tutor data (e.g. number of hints requested). With an understanding of how each combination of sensor and tutor features predicts a given emotion, we can recommend which sensors to use for emotion recognition, and we can also rank the classifiers so that if some sensor data is unavailable, due to an error, a comparable (or the next best) sensor set could be selected. Since the classifiers summarize the interaction data into evidence for an ITS to take an action, accuracy is not necessarily the best measure of the classifier. Instead, True Positive Rate (Sensitivity) and True Negative Rate (Specificity) are considered more important for this purpose. If sensitivity is high, then we may want to act on positive results of the classifier, and if specificity is high, then we may want to act on negative results of the classifier. Thus, our analysis focused on identifying all of these measures. In this paper we present a methodology for constructing, ranking, and validating linear classifiers for emotion. We perform this method on the classifiers constructed in [7]. In doing so, we make the following contributions. First we find evidence that for three of our four emotions, there is at least one linear classifier that performs better than the baseline classifier. We then find that one of these classifiers does not generalize to the larger population. We then find that we are best able to predict when the student is not confident, and that tutor and seat features are best for this. In Sec. 2 we describe the physical setup and apparatus of the experiments used to collect the data. Sec. 3 presents related work on tutoring systems and classifier comparison. Sec. 4 outlines the method for constructing and validating the student emotion classifiers. Sec. 5 describes the comparison of classifiers. Sec. 6 summarizes the results, discusses the design of affective interventions based on the classifier output, and proposes ways to improve the classifiers.
2 2.1
Data Collection: Sensors with Wayang Outpost in the Classroom Setup
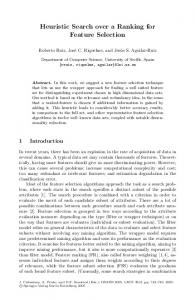
In the Fall of 2008 and the Spring of 2009 the geometry tutor Wayang Outpost was deployed with a set of sensors into real classroom environments [7–9]. The set of sensors included: a mouse that captured degree of pressure placed on its various points, a bracelet that measured skin conductance of the wrist, a chair that sensed the level of pressure on the chair back and seat, and a camera supplemented with software for facial emotion recognition. These four sensors collected data on students physiological responses while students worked with Wayang Outpost. Each student’s physiological data and interactions with the tutor were logged. Subsequently, the interaction and sensor data were time-aligned and converted into tutor and sensor features, as described in [7]. At intervals of five minutes in the Fall, and three minutes in the Spring, students were presented with an emotional query about one of four affective states (Confident,Interested, Frustrated, or Excited) selected from a uniform random distribution. The queries were presented as shown in Fig. 1; to respond, users selected from the options shown in Table 1. The sensor and tutor features were used as predictors for the levels of the self-reported affective states.
Fig. 1. An example of the Emotion query. Table 1 below has the values for each enclosed word, except for , which is the name of the student.
Table 1. The mapping of tags to text in Fig. 1 above. confident I feel anxious I feel very Confident interested I am bored I am very interested frustrated Not frustrated at all Very frustrated excited I’m enjoying this a lot This is Not Fun
The Fall 2008 data collection involved 93 students using the Wayang Tutor. Of the 93 students 85 of them had at least one working sensor connected to them
while using the tutor. Students used the tutor as part of a class, and class sizes ranged from three to twenty-five students with one teacher in the classroom and between one and three experimenters. The students had between two and five sessions with Wayang Outpost, based on teacher preference and availability of the student. The student ages were 15-16, 18-22, and 22-24. These data were used as our training set. The Spring 2009 data collection involved over 500 students, using the Wayang Tutor. 304 of the students were connected to at least one working sensor. The difference between the Fall and the Spring collection are as follows. 1. The students were from different schools. 2. The ages of students were 13-14, and 15-16. 3. The camera sensor had upgraded software. These data were used purely for validation purposes. 2.2
Tutor and Sensor Features
We considered nine tutor features and forty sensor features as potential predictors for the emotion classifiers (see Table 2). The forty sensor features are based on four ways of summarizing ten specific features: the mean, the standard deviation, the min value, and the max value over the course of a problem. Since the sensor and tutor logging happens asynchronously, their data are interpolated in a piecewise constant fashion with the constraint that only data from the past is used to predict missing sensor or tutor values. The beginning and ending of each problem is logged, creating boundaries for summarizing the interpolated sensor data (i.e. to compute each feature, we use data over the span of a single problem). When there is an emotional query after a problem, the result becomes the affective state label for that problem. For each student and for each emotion there are between two and five affective state labels. For more detail on the full specification of these features see [7].
3
Related Work
In this paper we use a method from [10] to compare and rank the different feature sets used in the linear classifiers. [11] reviews the results of feature selection competition and suggests that feature selection can be very useful for improving classifiers. In addition to using simple correlation coefficients as criteria for selection (as Stepwise Linear regression does), treed methods, wrapper and embedded methods have been used for feature selection. [12] compares features of a number of individual sensors used for detecting affective state with an ITS, but it does not compare disparate sensors, nor are multiple sensors used in conjunction in a classifier. There are a number of adaptive systems in existance that use real-time information about a student in order to address the student’s affective state. These systems use a variety of models, either using no sensors, similar sensors, similar affective states, or incorporate tutor data and/or sensor data in order to model the student’s self reported emotion.
Table 2. The nine tutor features below are on the left and the ten sensor features are on the right. These features are used in summarized form for each problem that there is an affective state label in order to train the emotion classifiers. Tutor Feature Solv. 1st Sec. to 1st
Definition 1st attempt correct Time to 1st attempt.
Sensor Feature Agreeing (Cam) Concentrating (Cam) Sec. to Solv. Time to a correct at- Thinking (Cam) tempt. # Incorrect # of incorrect re- Interested sponses. (Cam) # Hints # of hints selected. Unsure (Cam) LC Indicator of Learning Mouse Companion Pressure Group 2 for Jake, 1 for Jane, Sit Forward 0 for Neither Time In Session Time student spent in Seat Change the current session. Time In Tutor Total time student has Back Change spent in the Tutor. Skin Conductance
Definition Student is Agreeing Student is Concentrating Student is Thinking Student is Interested Student is Unsure Sum of all mouse pressure sensors. Student is sitting forward in chair. Seat movement Student Back movement On Wrist
Recent work includes [13], which discusses the use of EMG data to improve an affective model in an educational game. [14] aimed to predict learners affective states (boredom, flow/engagment, confusion, and frustration) by monitoring variations in the cohesiveness of tutorial dialogues during interactions with an ITS with conversational dialogs. Here, students and independent judges were asked to identify emotional states in recorded session videos. Other work, such as [15, 16], does not incorporate any sensor data to construct affective models. [15] uses Dynamic Bayesian Networks and Dynamic Decision Models specified by an expert to determine and respond to each student’s affective state, while [16] uses self-reports to determine affective state and focuses on how affective feedback changes the student’s experience. Much of this past research, however, has focused on constructing models based on a fixed set of sensors or solely on expert knowledge. This research builds on past work to present a method for comparing the usefulness of different sensors and sensor and tutor interaction features to enable better decisionmaking of the adaptive system. By using data collected from real schools rather than the laboratory, our data is more ecologically valid.
4 4.1
Method Collection
The data collection described in sec 2 is the first step of our method. In our case the Fall collection is our training collection and the Spring collection is our validation collection. We believe it is important for the source of training and validation sets to be from distinct locations and times. In this way, we believe that the validation will be stronger and more likely to continue to generalize. 4.2
Predictor Selection
Once the data are collected and summarized as described in Sec. 2.2, we used the entire set of labeled training data to create a subset of predictors using a combination of tutor and sensor features. For each combination of features, a subset of the data set that was not missing data for the features was selected. Then stepwise linear regression was performed in R to select the ‘best’ subset of features from those available. The subset of features was stored as a formula for use in training the classifiers and performing cross validation. 4.3
Cross Validation
For each set of features determined by the feature selection, we performed leaveone-student-out cross-validation on linear classifiers for each affective state. The Accuracy, Sensitivity, and Specificity were calculated for each student. In addition, a mean accuracy of each test student from the cross-validation was taken. We also performed the same cross-validation on a linear classifier with a constant model. We used the constant model linear classifier as our baseline. This step differs from [7] in two ways: 1) The mean taken across each test student instead of across tests; 2) Sensitivity and Specificity are used in addition to Accuracy. Though the cross-validation described above provides a general indication of the performance of each classifier, the information is not sufficient to enable appropriate pedagogical action selection by an ITS.To achieve the latter, we ranked the classifiers according to which sensors and features are needed. We also validated that the classifiers are generalizable in order to show that they can be used with a new population of students without having to be retrained. Our validation on new data, increased our confidence that the tutor can take appropriate actions based on the classifier predictions of affective state, and our classifier ranking allowed us to select which sensors are needed, and if sensor features become unavailable which is the next best ranked classifier. 4.4
Classifier Ranking
There are a number of ways to compare the classifiers. One is by using classifier Accuracy, which identifies the overall performance of a classifier, but does not express accuracy on positive vs. negative instances. Specifically, Sensitivity, also
referred to as the True Positive Rate, which provides information of the accuracy of a positive response, and Specificity, the True Negative Rate, which provides similar information for negative responses. Since the purpose of our classifiers is to help an ITS make decisions of how to appropriately respond to student emotion, one approach would be to only make a decision when there is confidence in the prediction. So, if one classifier has very good Sensitivity relative to the baseline, then the ITS would act when the classifier reports a positive result. If a classifier has a very good Specificity relative to the baseline, then the ITS would act when the classifier reports a negative result. In order to do compare Accuracy, Sensitivity, and Specificity for each affective state, we first performed one-way ANOVA’s where classifier was the independent variable and either Accuracy, Sensitivity, or Specificity were used as the dependent variable. When there was a significant difference, we performed Tukey’s HSD test to rank the differences in the means. Here, we only report results with significant differences. There is some question about the soundness of the ANOVA and Tukey’s HSD test for these comparisons because the design is not balanced (not every student had all sensors available), and the responses are not normally distributed. So, in addition to the ANOVA, a Kruskal-Wallace test was performed, and when there was a significant p-value to reject the null hypothesis that the means were the same, a Nonparametric Multiple Comparison Procedure (NPMC) for an unbalanced one-way layout was performed as described in [10]. The comparisons with significance are reported below. We conducted both parametric and non-parametric tests because the parametric tests are known to be robust to violations of the assumptions, so performing both was a way to validate the comparison results. 4.5
Validation with Follow-on Data
We use the Spring data set to validate the classifiers that were trained on the Fall Data set. The Spring data set was not used to inform any of the training. For each feature set that feature selection and cross validation was performed on, a linear classifier was made using the entire subset described in Sec. 4.2. Each classifier was tested on relevant subset of data from the Spring data set. The accuracy, sensitivity, and specificity values are compared to the cross-validated values to see how well the linear classifiers generalize to a larger population.
5
Results
The classifier sets were designed to compare the performance of (1) a classifier using just tutor features vs. (2) one using features from one sensor in addition to the tutor features vs. (3) a classifier using all of the available tutor features. The Collection, Feature Selection, and Cross Validation results from the training data (Fall 2008) are described in [7]; however, a couple of important details are needed
here. First, although the feature selection had the option of using Both tutor data and other sensor data, sometimes only tutor data was selected, sometimes only sensor data was selected, and sometimes the exact same features were selected. Table 3 shows the results of the feature selection. Second, we modified the crossvalidation results to include sensitivity and specificity, and our samples are per student rather than per test. We focus here on the further steps of Classifier Comparison and Validation. Table 3. These are the results of the Feature Selection. The baseline classifier for each emotion is just a linear model trained on a constant. The classifier names are the concatenation of an abbreviated emotion and the contributing sensor features. If there are no sensor features, then Tutor comes after the emotion, and when there is more than one classifier with the same feature set a letter is added to disambiguate the names. Names in bold are for classifiers that performed significantly better than the baseline for that emotion in at least one way. classifier Name confBaseline confTutorA confTutorM confTutorW confSeat confCameraA confCameraB frustBaseline frustTutorA frustTutorM frustCameraA frustCameraB intBaseline intTutor intMouse intCamera intCameraMouse excBaseline excTutor excCamera excCameraSeat
5.1
features constant Solv. 1st + Hints Seen # Incorrect + Solv. 1st + Session # Incorrect # Incorrect + Solv. 1st + sitForward Std Dev. # Incorrect + concentratingMax + thinkingMin # Incorrect + concentratingMax + thinkingMax constant LC + Session + # Incorrect + # Hints LC + Session + # Incorrect + # Hints + SecondsToSolved LC + Session + thinkingMin + # Hints + interestedMax unsureStdDev + LC + Session + thinkingMin + # Hints constant Group Group + # Hints + mouse Std Dev + mouse Max Group + # Hints + interestedMin Group + # Hints + interestedMin + mouseMax constant Group + # Incorrect interested Mean + # Incorrect netSeatChangeMean + interestedMin + sitForwardMean
Classifier Ranking
There is a significant difference for the Main Effect of Accuracy for both the Interested and Excited affective states, while there was no significant difference for the Confident and Frustrated states. For the interested state, the classifier using the Mouse and Tutor features was significantly better than the baseline
with a mean of 83.56% vs. 42.42%, using both Tukey’s HSD and NPMC, For the Excited state, the tutor features were better than the baseline with a mean of 73.62% vs. 46.31%. For Sensitivity, there is a significant difference for Confident, Interested, and Excited affective states. However for Confident, nothing was shown to be better than the baseline. For Interested, both the Camera and Tutor, and Mouse and Tutor features were better than the baseline. For excited, the Camera with Seat sensors, Camera Sensors, and just the Tutor performed better than the baseline. For Specificity, there is a significant difference for Confident: TutorA, TutorM, and Seat classifiers are better than the baseline. The details of these results are shown in table 4.
Table 4. Classifier Ranking using cross-validation data Confident Specificity Interested Accuracy Sensitivity Excited Accuracy Sensitivity
Tukey HSD NPMC (conf T utorA ∼ conf T utorM ∼ (conf T utorA ∼ conf T utorM ) > conf Seat) > conf Baseline conf Baseline Tukey HSD NPMC intM ouse > intBaseline intM ouse > intBaseline (intCamera ∼ intM ouse) > (intCamera, intM ouse) > intBaseline intBaseline Tukey HSD NPMC excT utor > excBaseline excT utor > excBaseline (excT utor ∼ excCamera ∼ (excT utor ∼ excCamera ∼ excCameraSeat) > excBaseline excCameraSeat) > excBaseline
Given these results to date, our findings suggest that the tutor could generate interventions more reliably when it detected Interest and Excitement. If the tutor wanted to intervene when the student is interested, then using the Mouse and Tutor features or the Camera and Tutor features would be most appropriate. If the tutor wanted to intervene when the student is excited then either the Camera with Seat Features, Camera Features, or Tutor Features classifier would all be appropriate. It may be more relevant to intervene when a student is not interested or not excited, or not confident. In the case of low interest and low excitement, we have no suggestions, but for the case of not confident, we could use either the TutorA, TutorM, or seat features trained on confident. The key features for not confident are: SolvedOnFirst + Hints Seen, or incorrectAttempts + Solved On First + Time In Session, or incorrectAttempts + Solved On First + sitForward StDev
5.2
Validation with Follow-on Data
In order to verify that these classifiers are ranked in a way that generalizes to new data sets, we tested the classifiers by training them with all of the Fall data and testing them with the Spring data. Performance results of the significantly ranked classifiers from the cross-validation done above are shown in Table 5. Since the data are from an entirely separate population, it is likely that the overall performance will degrade somewhat; however, if each classifier’s performance is similar, then that will provide evidence that the classifiers should be preferred as they were ranked during the cross-validation phase. When comparing mean accuracy for the training vs. test sets, there is a general drop in accuracy of between 2% and 15%, though in some cases, there is a much larger difference of up to 37%. The larger differences suggest that the features do not generalize well to other populations. Table 5. This shows validation results of all classifiers that performed better than the baseline classifier during training. All values are the mean value per student. Fall specifies the training set based on the leave-one-student-out cross-validation, and Spring specifies the results of the classifiers trained on the training set (Fall Data), and tested on the validation set (Spring Data). Values in bold are significantly better than the baseline. model
Accuracy Fall Spring confBaseline 65.06% 62.58% confTutorA 70.49% 65.49% confTutorM 68.64% 67.53% confSeat 65.70% 67.13% intBaseline 42.42% 78.30% intMouse 83.56% 63.34% 69.44% 57.65% intCamera excBaseline 46.31% 74.31% excTutor 73.62% 62.99% excCamera 66.33% 51.53% excCameraSeat 70.67% 43.34%
Sensitivity Fall Spring 72.22% 76.13% 47.07% 46.04% 52.31% 52.26% 54.63% 60.17% 0.00% 0.00% 29.73% 5.09% 52.08% 12.11% 0.00% 0.00% 36.54% 12.45% 38.67% 28.39% 32.00% 15.97%
Specificity Fall Spring 55.56% 44.14% 90.43% 84.88% 82.41% 80.68% 79.26% 70.32% 81.82% 100.00% 90.54% 81.60% 64.58% 68.53% 96.15% 100.00% 87.88% 77.28% 72.00% 52.24% 83.00% 54.07%
Significant results of ranking on the validation set are shown in Table 6. Note that the Accuracy rankings no longer hold, and the Mouse classifier for the interested affective state is no longer significantly better than the baseline.
6
Discussion
In this paper we describe a method for discovering actionable affective classifiers for Intelligent Tutoring Systems (ITS). Though the method was used with
Table 6. Classifier Ranking Using Validation data from the Spring of 2009 Confident Specificity
Interested Sensitivity Excited Sensitivity
Tukey HSD (conf CameraA ∼ conf T utorA ∼ conf T utorM ) > (conf Seat ∼ conf T utorW ) > conf Basline conf CameraB > conf T utorW > conf Baseline Tukey HSD intCamera > intBaseline Tukey HSD ((excCamera > excT utor) ∼ excCameraSeat) > excBaseline
NPMC (conf CameraA ∼ conf T utorA ∼ conf T utorM ) > (conf Seat ∼ conf T utorW ) > conf Basline conf CameraB > conf T utorW > conf Baseline NPMC intCamera > intBaseline NPMC excCamera > excCameraSeat > excT utor > excBaseline
specific sensors, features, a specific ITS, Wayang Outpost, and specific classifiers based on linear models, each of these could conceivably be swapped out for another system. The results of our method for our setup gave us a clear ranking for using three classifiers for detecting low student confidence, one classifier for detecting highly interested, and three classifiers for detecting highly excited. For not confident, two different sets of Tutor only features performed better than the Tutor and Seat features, so it is unlikely that there would be a time that we would use the classifier with the Seat sensor. Now that we have actionable classifiers for three affective states, our ITS will be able to use the combined results to make a decision. In general, the ITS should probably intervene whenever the classifier detects low confidence. However, the detection of high excitement and/or high interest may change the type of intervention that is used. The ITS will keep track of when each intervention is performed and will set a timer so that the student is given an appropriate amount of interventions given the affective. Future work will involve implementing the affective based interventions, and constructing classifiers that can perform better than the baseline for the other affective states. One approach to finding better classifiers is to find more complex features based on the sensor data. A more complete set of affective classifiers will likely improve the ITS interventions. For example, if we had a classifier that had good sensitivity for confidence, then that classifier could be used to stop interventions relating to low confidence. Acknowledgments. We thank Sharon Edwards and Sarah English for their coordination of the school studies. This research was funded by awards from the National Science Foundation, 0705554, IIS/HCC Affective Learning Companions: Modeling and Supporting Emotion During Teaching, Woolf and Burleson (PIs) with Arroyo, Barto, and Fisher and the U.S. Department of Education to Woolf, B. P. (PI) with Arroyo, Maloy and the Center for Applied Special
Technology (CAST), Teaching Every Student: Using Intelligent Tutoring and Universal Design To Customize The Mathematics Curriculum. Any opinions, findings, conclusions or recommendations expressed in this material are those of the authors and do not necessarily reflect the views of the funding agencies.
References 1. Beebe, S.A., Ivy, D.K.: Explaining student learning: An emotion model. (1994) – 2. Kort, B., Reilly, R., Picard, R.: An affective model of interplay between emotions and learning: reengineering educational pedagogy-building a learning companion. In: Advanced Learning Technologies, 2001. Proceedings. IEEE International Conference on. (2001) 43–46 3. Graham, S., Weiner, B.: Theories and principles of motivation. In Berliner, D., Calfee, R., eds.: Handbook of Educational Psychology. Volume 4. Macmillan, New York (1996) 63–84 4. Zimmerman, B.J.: Self-efficacy: An essential motive to learn. Contemporary Educational Psychology 25 (2000) 82–91 5. Lepper, M.R., Woolverton, M., Mumme, D.L., Gurtner, J.L. Technology in education. In: Motivational techniques of expert human tutors: Lessons for the design of computer-based tutors. Lawrence Erlbaum Associates, Inc (1993) 75 – 105 6. Derry, S.J., Potts, M.K.: How tutors characterize students: a study of personal constructs in tutoring. In: ICLS ’96: Proceedings of the 1996 international conference on Learning sciences, International Society of the Learning Sciences (1996) 368–373 7. Cooper, D.G., Arroyo, I., Woolf, B.P., Muldner, K., Burleson, W., Christopherson, R.: Sensors model student self concept in the classroom. In: UMAP ’09: Proceedings of the 17th International Conference on User Modeling, Adaptation, and Personalization, Berlin, Heidelberg, Springer-Verlag (2009) 30–41 8. Arroyo, I., Cooper, D.G., Burleson, W., Woolf, B.P., Muldner, K., Christopherson, R.: Emotion sensors go to school. In Dimitrova, V., Mizoguchi, R., du Boulay, B., Graesser, A.C., eds.: AIED. Volume 200., IOS Press (2009) 17–24 9. Arroyo, I., Woolf, B.P., Royer, J.M., Tai, M.: Affective gendered learning companions. In Dimitrova, V., Mizoguchi, R., du Boulay, B., Graesser, A.C., eds.: AIED. Number 200, IOS Press (2009) 41–48 10. Munzel, U., Hothorn, L.A.: A unified approach to simultaneous rank test procedures in the unbalanced one-way layout. Biometrical Journal 43(5) (2001) 553–569 11. Guyon, I., Gunn, S., Ben-Hur, A., Dror, G.: Result analysis of the nips 2003 feature selection challenge. In: Advances in Neural Information Processing Systems. (2004) 12. D’Mello, S., Picard, R.W., Graesser, A.: Toward an affect-sensitive autotutor. IEEE Intelligent Systems 22(4) (2007) 53–61 13. Conati, C., Maclaren, H.: Modeling user affect from causes and effects. In: UMAP ’09: Proceedings of the 17th International Conference on User Modeling, Adaptation, and Personalization, Berlin, Heidelberg, Springer-Verlag (2009) 4–15 14. D’Mello, S.K., Craig, S.D., Graesser, A.C.: Multimethod assessment of affective experience and expression during deep learning. Int. J. Learn. Technol. 4(3/4) (2009) 165–187 15. Hernandez, Y., Arroyo-Figueroa, G., Sucar, L.: Evaluating a probabilistic model for affective behavior in an intelligent tutoring system. (July 2008) 408–412 16. Robison, J., McQuiggan, S., Lester, J.: Evaluating the consequences of affective feedback in intelligent tutoring systems. (2009) 1–6