International Food Research Journal 20(1): 397-402 (2013) Journal homepage: http://www.ifrj.upm.edu.my
Rapid and sensitive HPLC-PDA method for simultaneous identification and quantification of dietary weight reducing compound hydroxy citric acid lactone and chemo preventive compounds isoxanthochymol and xanthochymol in Garcinia indica *
Kumar, S., Sharma, S. and Chattopadhyay, S.K.
Central Institute of Medicinal and Aromatic Plants (CIMAP), Council of Scientific and Industrial Research, P.O. CIMAP, Lucknow-226015, India Article history
Abstract
Received: 25 March 2012 Received in revised form: 6 May 2012 Accepted:7 May 2012
Following optimization of extraction, separation and analytical conditions, a rapid, sensitive and simple reverse-phase HPLC-PDA method has been developed for the simultaneous identification and quantification of hydroxy citric acid lactone (HCAL), isoxanthochymol (Isoxan) and xanthochymol (Xan) in different extracts of Garcinia indica (Guttiferae). The separation of HCAL, Isoxan and Xan was achieved on a Waters Sunfire C-18 column using the solvent system consisting of a mixture of acetonitrile - water (90:10, v/v) and methanol - acetic acid (99.5:0.5, v/v) as a mobile phase followed by photo diode array (PDA) detection of peaks at 220 and 276 nm. Calibration curves presented good linear regression (r2 > 0.986) within the test ranges.
Keywords HPLC-PDA analysis Garcinia indica extracts polyisoprenylated benzophenones
Introduction Garcinia (family: Guttiferae) is a large genus of polygamous trees or shrubs, distributed in tropical Asia, Africa and Polynesia region. Garcinia indica is a slender evergreen tree with drooping branches. The tree is found in the tropical rainforest of Western Ghats from Konkan southwards in Mysore, Coorg and Waynaad. It is reported to flourish well in the lower slopes of Nilgiri hills. The fruits of the tree have an agreeable flavor and a sweetish acid taste. Its fruit is antihelminthics, cardiotonic and useful in piles, dysentery, tumors, pains and heart complaints. Syrup from fruit juice is given in bilious infections. The dried fruit rind of G. indica (‘Kokum’) is used as a garnish for curry and in traditional medicine in India. There are about thirty species of Garcinia available in India; however, most of the works on Garcinia plants that are available in India are limited mainly on two species, Garcinia indica and Garcinia cambogia (The Wealth of India, Raw Materials., 1956). Hydroxy citric acid (HCA) is found in the fruit rinds of some Garcinia species which include G. indica, G .cambogia, G. atrovirdis and G. cowa. HCA is one of the most popular dietary supplements that have been marketed as a natural weight loss product (Loe et al., 2001). Physiological and biochemical effects of HCA due to its unique regulatory effect on fatty acid synthesis and weight loss have been *Corresponding author. Email:
[email protected]
© All Rights Reserved
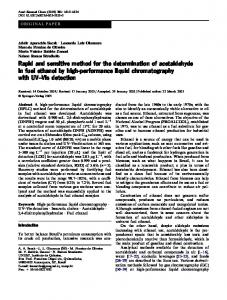
extensively studied. For the claimed purpose of enhancing weight loss, cardio protection, lipid abnormalities correction properties and endurance in exercise, HCA derivatives have been incorporated in combination with other ingredients into a number of pharmaceutical preparations (Jena et al., 2002 A). Furthermore, anti-obesity potential of HCA has been clinically screened (Varghese, 1996) and it has shown potential metabolic regulator of obesity and lipid abnormalities in mammalian system (Rao and Sakariah., 1988). Another group of compounds known as prenylated benzophenones have also been reported from Garcinia species. Isoxan and Xan (Figure 1) belong to this class of compounds. These two compounds are isomeric in nature. Pure Isoxan and Xan have been isolated from G. indica. Isoxan has also been isolated from G. xanthochymus, G. subelliptica and G. pyrifera (Roux et al., 2000). Recent studies have demonstrated that polyprenyl benzophenones xanthochymol and guttiferone E isolated from the ethyl acetate soluble extracts of fruits of G. pyrifera exhibited significant inhibitory activity on the disassembly of microtubules into tubulin (Roux et al., 2000). Recently, it has been established from our study that a combination of Isoxan and Xan in a specific ratio showed potent cytotoxic activity which has been established by LCMS/MS data (Kumar et al., 2007). Previous work on the HPLC analysis of water
398
Kumar et al./IFRJ 20(1): 397-402
Figure 1. Structures of hydroxy citric acid lactone (1), isoxanthochymol (2) and xanthochymol (3)
soluble components HCA, HCAL, citric acid and oxalic acid have been reported from G. pedunculata (Jayaprakash et al., 2003). HCA, HCAL and citric acid have been analyzed from the leaves, fruits and rinds of G. cowa (Jena et al., 2002A, 2002 B). HCA and its lactone, HCAL (Figure 1) from G. cambogia were analyzed and the percentage of HCA was reported to be varied from 45 to 65 % in different salts of HCA (Antony et al., 2004). Although, HCA has been reported in leaves, pulp and fruit rinds of Garcinia species, but there is not any report available in literature for HCA and HCAL content in other parts such as stem bark and seeds of Garcinia species. Also simultaneous determination of these two different groups of bioactive compounds HCAL (water soluble), Isoxan and Xan (water insoluble) have not been reported earlier. As a part of our ongoing research for profiling of bioactive compounds from Garcinia species available in India, a high performance liquid chromatography (HPLC) method for simultaneous qualitative and quantitative analysis of HCAL, Isoxan and Xan in different extracts of G. indica has been developed. The developed HPLC method will reduce sample processing procedures, analysis time and could be utilized for throughput screening purposes. Materials and Methods Plant Material Fruits and fruit pericarps of G. indica were collected from Bangalore and leaves, stem barks, seeds were collected from Dapoli, Maharashtra, India, respectively. The voucher specimens were authenticated by Dr. G.D. Bagchi and deposited in the herbarium of the Department of Botany and Pharmacognosy, CIMAP, Lucknow.
Chemicals and Standards HPLC grade acetonitrile (ACN), methanol and water (Merck, Mumbai, India) were used. Analytical grade acetic acid, hexane, chloroform, ethyl acetate and n-butanol (Merck, Mumbai, India) were used for extraction and sample preparation. Isoxan and Xan were isolated from the fruit rinds of G. indica in house whereas HCAL was procured from Life Technologies (India) Pvt. Ltd. and their purity was above 99.5% by HPLC. HPLC system consisted of a Waters 600 E pump (Milford, MA, USA), quaternary solvent system, an in- line Waters AF degasser and a Waters 2996 photodiode array detector. Instrument control and data processing were performed under Empower software. Extract preparation and isolation of isoxanthochymol and xanthochymol The pulverized fruit rinds (250 gm) of G. indica were dried in shade. The dried fruit rinds were extracted with methanol (250 ml X 6) for 24 hrs at 25 ºC. The methanol extract so obtained were pooled together and concentrated under reduced pressure to obtain a residue (147.7 g).The residue was suspended in water (200 ml) and sequentially extracted with hexane (100 ml X 6), chloroform (100 ml X 6), ethyl acetate (100 ml X 6) and n- butanol (100 ml X 6). The aqueous extract obtained after n- butanol extraction was concentrated and spray dried to obtain a semisolid residue (24 g). The hexane extract thus obtained were combined together, dried over anhydrous sodium sulfate and concentrated under reduced pressure to a residue (16.32 g) of hexane extract. Similar processing of chloroform, ethyl acetate and n-butanol extract provided their concentrated extract (1.0 g, 2.0 g and 4.0 g), respectively. Isoxan and Xan were isolated from the hexane extract of the fruit rinds of G. indica. The purity (99.5 %) and structures of Isoxan and Xan were confirmed by recording and matching their reported physio-chemical (mp, optical rotations) and spectral data (UV, IR NMR (both 1D and 2D), Mass) (Krishnamurthy et al., 1981; Rama Rao et al., 1980a; 1980b).These two isolated and characterized molecules were used as standard for HPLC analysis. Seed, stem bark and leaves were also extracted with methanol to obtain their methanolic extract. 1 mg of the concentrated extract obtained were dissolved in methanol to obtain 1mg/ml (1000 µg/ml, 1000 ppm) concentration and subjected to HPLC analysis for quantification of HCAL, Isoxan and Xan. Standard and Sample Preparations The standard stock solutions (1mg/ml) of HCAL,
Kumar et al./IFRJ 20(1): 397-402
399
Isoxan and Xan were prepared in HPLC grade methanol and stored at 4ºC. Working solutions of lower concentration (HCAL: 25, 40, 60, 100, 140 and 200 µg/ml, Isoxan : 20, 25, 75, 100, 150 and 200 µg/ ml, Xan : 10, 15, 20, 75, 100, 150, 200 µg/ml) were prepared by appropriate dilution of the stock solutions in methanol. Stock solutions of different extracts of G. indica were prepared by dissolving 1 mg of the extract in 1 ml methanol and filtered through a 0.45 µm membrane filter. HPLC Analysis The chromatographic separation was achieved using a Waters Sunfire C18 column (150 X 4.6 mm packed with 5µm particle size; Waters, Milford, MA, USA) at 250C .The mobile phases were acetonitrile : water (90:10 v/v, solvent A) and methanol - acetic acid (99.5:0.5, v/v) (solvent B). The mobile phase was filtered through a 0.45 µm membrane filter in solvent filtration apparatus (Millipore, USA). Samples for HPLC analysis were also filtered through a 0.45 µm membrane filter (Waters, USA). Before delivering into the system, the solvents were degassed using vacuum. The optimized HPLC condition is as follows: elution was initially started with 30 % of solvent A and 70 % of solvent B with a flow rate of 0.5 ml/min. At 3.8 minute, the flow rate was increased to 0.8 ml/ min. Further, the flow rate was decreased to 0.6 ml/ min at 6.0 minute. The flow rate was kept constant for 15 min and then finally decreased to 0.5 ml/min, restoring the initial conditions at 20 minute. The flow rate of the mobile phase was varied to optimize the separation and peak shape. Total runtime was 25 minute. Detector wavelength was 220 nm for HCAL and 276 nm for Isoxan and Xan. The injection volume was 20µl. Results and Discussion Method Development and Optimization Several RP LC columns were explored for the optimal separation of HCAL, Isoxan and Xan including Symmetry C18 (250 X 4.6 mm, 5µm), X Terra (250 X 4.6 mm, 5µm) from Waters (Waters, Milford, MA, USA), Spherisorb-5 RP-8, Brownlee (100 X 2.1 mm, 5µm) and Spherisorb-5 RP-18, Brownlee (100 X 2.1 mm, 5µm) from Perkin-Elmer (Perkin-Elmer, USA). Separation of the three analytes was better in case of RP C-18 column. However, the best base line chromatographic separation of HCAL, Isoxan and Xan was achieved using Sunfire C18 (4.6 x 150 mm, 5µm) (Waters, Milford, MA, USA) column. Both ACN-water and water-methanol were tested as the mobile phase under isocratic as well as
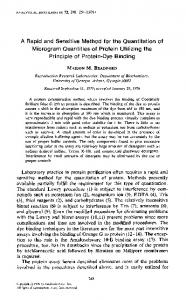
Figure 2. Representative HPLC –UV (PDA) chromatograms of (A) MeOH extract of GI fruit rinds; (B) Aqueous extract of GI fruit rinds; (C) MeOH extract of GI stem bark; (D) MeOH extract of GI leaves; (E) MeOH extract of GI seeds; (F) Butanol extract of GI fruit rinds spiked with standard HCA lactone, isoxanthochymol and xanthochymol; (G) Mixture of standard HCA lactone (1), isoxanthochymol (2) and xanthochymol (3) (concentration = 100 ppm for three standards)
gradient elution mode. However, addition of acetic acid to mobile phase was found necessary for better peak shape and resolution of peaks. Furthermore, to minimize the tailing effects, 0.5 % acetic acid in water was chosen as organic modifiers. A base line
Kumar et al./IFRJ 20(1): 397-402
400
Table1. 1. Retention time,time, calibration curve, linearcurve, range, limit of detection Table Retention calibration linear range,(LOD) limitand of detection (LOD) and (LOQ) quantification (LOQ) of HCAL, Isoxan and Xan quantification of HCAL, Isoxan and Xan. Analyte Retention time (min) Mean RSD (%)
Regression equation (y = ax + b)a
R2*
HCAL Isoxan Xan
y= 16000x + 2960000 y= 6910x – 52300 y= 3190x - 28700
0.986 0.986 0.992
3.10 7.23 16.32
0.73 1.31 0.73
Linear range (µg/mL) 25-200 20-200 20-200
LOD c (µg/mL ) 20 15 15
LOQ c (µg/mL) 25 20 20
In the calibration equation, y represents the peak area, x represents concentration of the analyte (µg/mL); a and b are the slopes and the intercept of the regression line; * R is the correlation coefficient; c LOD and LOQ were estimated based on the signal/noise = 3 and signal/noise = 10 respectively a
Table 2. Recovery data of HCAL, Isoxan and Xan usingand the developed Table 2. Recovery data of HCAL, Isoxan HPLCHPLC methodmethod. Xan using the developed Analyte HCAL Isoxan Xan
Added concentration (µg/mL) 100 100 100
Recovery (%)* 95.80 101.76 98.58
Table * Mean value (n =3. 3) Precision
(R.S.D.) of the developed HPLC method at two different Table 3. Precision (R.S.D.) of the concentrations of developed HPLC method at two different concentrations HCAL, Isoxan and Xan.of HCAL, Isoxan and Xan Analyte HCAL
Isoxan
Xan
* Mean value (n = 3)
Concentration (µg/mL) 40 60 120 30 50 100 30 50 100
R.S.D. (%) Intra-day Inter-day 3.89 4.06 3.57 4.21 1.99 3.99 1.55 2.86 1.22 2.08 0.83 2.97 1.64 1.61 1.24 1.26 3.44 4.94
separation of HCAL, Isoxan and Xan was obtained using a mobile phase composed of acetonitrile : water (90:10; v/v) and methanol - acetic acid (99.5:0.5, v/v) in 25 minute run time. The best base line separation (peak purity > 98%) for HCAL was achieved at 220 nm and at 276 nm for Isoxan, Xan respectively. At these wavelengths, the marker compounds had adequate absorptions according to their three-dimensional ultraviolet absorption spectra. A chromatogram of a mixture of standard HCAL, Isoxan and Xan has been shown in Fig. 2. These standards were resolved with relatively high sensitivities at mean retention times of 3.10 min at 220 nm for HCAL and at 7.23 min and 16.32 min for isoxanthochymol and xanthochymol at 276 nm, respectively (Table 1, Figure 2). Method validation Linearity As the linear range of analytical methods is known to be limited, linearity of the calibration curve prepared and its working range were determined. Linearity was determined based on detector response of the different concentrations (HCAL: 25, 40, 60, 100, 140 and 200 µg/ml, Isoxan : 20, 25, 75, 100, 150 and 200 µg/ml, Xan : 10, 15, 20, 75, 100, 150, 200 µg/ml) of standards used for calibration curves. Regression analysis was used to access the linearity
of the developed HPLC method using the equation, y = bx + c , where, x correspond to the concentration of the standard solution (µg/ml) , y to the peak area , b is slope of line, and c is intercept of the straight line with y axis. In the present study, linearity was studied in the concentration range of 25 - 200 µg/ml of the standard solutions of HCAL, 20-200 µg/ml for Isoxan and Xan respectively (Table 1). Calibration curves were linear in this concentration range and showed good linear regression (HCAL, Y = 16000 X + 2960000, R2 = 0.986; Isoxan, Y = 6910 X – 52300, R2 = 0.986; and Xan, Y = 3190 X – 28700, R2 = 0.992). Accuracy and precision The accuracy of an analytical method is the closeness of test results obtained by that method to the true value and was determined based on the recovery of known amounts of analytes. Analytical recovery was performed by analyzing analytes by spiking 100 µg/ml of three standards in blank extract (n-butanol extract of G. indica in which HCAL, Isoxan and Xan were absent). The results of the accuracy studies are shown in Table 2. The recovery ranged from 95.80 to 101.76 % as shown in Table 2, indicating that the developed HPLC method is reliable and highly accurate. Intraday precision was evaluated for three concentrations of three standards with triplicate injections under same experimental conditions. Inter day precision also was measured for the same three concentrations during three different days (Table 3). Intraday precision were in the range 0.83-3.89 % (HCAL: 1.99- 3.89 %, Isoxan: 0.83- 1.55 % ,Xan: 1.24-3.44 %) and the inter day precision varied from 1.26-4.94 % (HCAL : 3.99- 4.06 %, Isoxan 2.08 - 2.97 %, Xan: 1.26-4.94 %). These data confirms that the new HPLC method is repeatable and yields consistent results. The specificity of the method was examined by analyzing standard blank extract and standard blank extract spiked with a known concentration of HCA lactone, isoxanthochymol and xanthochymol. No interference of the retention times of the analytes was observed. Limit of detection (LOD) and Limit of quantification (LOQ) Lowest concentration of analyte detectable and quantifiable with a stated degree of reliability is one of the many important parameters of any analytical method. Limit of detection (LOD) is the lowest amount of analyte in a sample that can be detected but not necessarily quantified. Limit of quantification (LOQ) is defined as the lowest concentration, which can be reproducibly quantified above baseline level,
Kumar et al./IFRJ 20(1): 397-402
Table 4. Contents (mean ± S.D.)* of HCAL, Isoxan and Xan in
Table 4. Contents (mean ± S.D.)* of HCAL, Isoxan and Xan in G. indica extracts of different G. indica extracts of different plant parts plant parts. Extracts MeOH extract (Fruit rinds)
HCAL (mg/g) Mean ± S.D.* 90.43 ± 2.45
Isoxan (mg/g) Mean ± S.D.* 57.49 ± 5.18
Xan (mg/g) Mean ± S.D.* 156.32 ± 5.8
Aqueous extract (Fruit rinds)
191.28 ± 5.98
nd
nd
MeOH extract (Seeds)
61.56 ± 3.92
nd
nd
MeOH extract (Stem bark)
55.68 ± 2.41
47.86 ± 4.8
29.75 ± 1.33
MeOH extract (Leaves)
75.44 ± 4.46
nd
nd
*n = 3, nd= not detected
typically an S/N = 10 or above. The LOD and LOQ for the present HPLC method developed were measured as per guidelines described by the international conference on Harmonization (ICHQ2 (R1)., 2005). LOD determined on the basis of signal to noise ratio of 3:1 was found to be 20 µg/ml for HCAL, 15 µg/ ml for Isoxan and Xan. LOQ for HCAL was 25 µg/ ml and 20 µg/ml for Isoxan and Xan, respectively. Further, LOD and LOQ were verified by injecting the respective concentrations. Determination of hydroxycitric acid lactone, isoxanthochymol and xanthochymol in different extracts of G. indica. The developed HPLC method was subsequently applied to the determination of concentration of HCAL, Isoxan and Xan in different extracts of G. indica. Presence or absence of HCAL, Isoxan and Xan in different extracts of G. indica was confirmed by comparing their retention times (tR). Quantity of HCAL, Isoxan and Xan in different extracts of G. indica calculated from the peak area of HPLC chromatograms of the extracts has been summarized in Table 4. HCAL was maximum in aqueous extract of the fruit rinds followed by methanolic extract of the fruit rinds of G. indica. Similarly, Isoxan and Xan had highest content in the methanolic extract of the fruit rinds of G. indica. This is the first HPLC method for the simultaneous quantitative analysis of three biologically important molecules from Garcinia species using polar embedded phase. Additionally, the developed method was checked for robustness in terms of linearity, limit of detection and quantification, intraday and inter day precision. The method allows for a simple, accurate, precise and sensitive determination of HCAL, Isoxan and Xan in different extracts of Garcinia species in run time less than 25 minute. These results justify the future application of this method for the efficient and accurate analysis of HCAL, Isoxan and Xan at low levels in Garcinia extracts as well as in dietary formulations commercially available.
401
Acknowledgements The authors are grateful to the director, CIMAP (CSIR), Lucknow, for providing necessary facilities and encouragements. Financial assistance from the CSIR networking project NWP-09 is gratefully acknowledged. References Antony B., Varghese, W. and Merina, E. 2004. Preparation and evaluation of hydroxyl citric acid from Garcinia cambogia extract using RP amide HPLC. Indian Journal of Pharmaceutical Sciences 66: 208-211. ICH. 2005. International Conference on Harmonization of technical requirements for registration of pharmaceuticals for human use (ICH) Q2 (R1): Validation of analytical procedures text and methodology. http:// www.ich-org 2005. Jayaprakasha, G.K., Jena, B.S. and Sakariah, K. K. 2003. Improved liquid chromatographic method for determination of organic acids in leaves, pulp, fruits and rinds of Garcinia. Journal of AOAC International 86: 1063-1068. Jena, B.S., Jayaprakasha, G.K., Singh, R.P. and K.K. Sakariah . 2002 A. Chemistry and biochemistry of (-) hydroxycitric acid from Garcinia. Journal of Agricultural and Food Chemistry 50: 10-22. Jena, B.S., Jayaprakasha, G.K. and K.K. Sakariah .2002 B. Organic acids from leaves, fruits and rinds of Garcinia cowa. Journal of Agricultural and Food Chemistry 50: 3431-3434 Krishnamurthy, N., Lewis, Y.S. and Ravindranath, B. 1981.On the structure of garcinol, isogarcinol and camboginol. Tetrahedron Letters 22: 793-796. Kumar, S., Chattopadhyay, S.K., Darokar, M. P., Garg , A. and Khanuja, S.P.S. 2007. Cytotoxic activities of xanthochymol and isoxanthochymol substantiated by LC-MS/ MS. Planta Medica 73: 1452-1456. Loe, Y.C., Bergeron, N., Rodriguez, N. and Schwarz, J.M. 2001. Gas chromatography/mass spectrometry method to quantify blood hydroxycitrate concentration. Analytical Biochemistry 292: 148-154. Rama Rao, A.V., Venkatswamy, G. and Yemul, S.S. 1980 a. Xanthochymol and isoxanthochymol, two novel polyisoprenylated benzophenones from Garcinia xanthochymus. Indian Journal of Chemistry 19B: 627633. Rama Rao, A.V., Venkatswamy, G. and Pendse, A.D. 1980b. Camboginol and cambogin. Tetrahedron Letters 21: 1975-1978. Rao, R.N. and Sakariah, K.K. 1988. Lipid lowering and anti-obesity effect of (-) hydroxycitirc acid. Nutrition Research 8: 209-212. Roux, D., Hadi, H.A., Thoret, S., Guenard , D., Thioson, O., Pais , M. and Sevenet, T. 2000. Structure- activity relationship of polyisoprenyl benzophenones from Garcinia pyrifera on the tubulin/ microtubulin system. Journal of Natural Products 63: 1070-1076.
402
Kumar et al./IFRJ 20(1): 397-402
The Wealth of India (Raw Materials). 1956. Vol. IV. CSIR: New Delhi, India. 101-103. Varghese, J. 1996. (-) Hydroxy citrate: unique potent metabolic regulator of obesity. Indian Spices 33: 2325.