The use of HlS is demonstrated through the rapid development of a DChart ... believe in facilitating rapid, domain-specific modelling of the UI, and that this.
Rapid Development of Scoped User Interfaces Denis Dub´e, Jacob Beard, Hans Vangheluwe School of Computer Science, McGill University, Montreal, Qu´ebec, Canada
Abstract. As the demand for domain- and formalism-specific visual modelling environments grows, the need to rapidly construct complex User Interfaces (UIs) increases. In this paper, we propose a Multi-Paradigm Modelling (MPM) approach whereby structure, visual appearance and above all reactive behaviour of a UI are explicitly modelled. These models are constructed at the most appropriate level of abstraction, using the most appropriate modelling formalisms. This allows for rapid application synthesis, easy adaptation to changing requirements, and simplified maintenance. In this paper, we introduce Scoped User Interfaces, and illustrate how one may model them using Hierarchically-linked Statecharts (HlS). The use of HlS is demonstrated through the rapid development of a DChart formalism-specific modelling environment.
1
Introduction
There are many challenges developers face during the development of a complex User Interface. Desired behaviour may be autonomous or reactive, and possibly real-time. Each UI component may be required to exhibit a radically different behaviour from that of any other component and the behaviour of components may be inter-related. These complex behavioural relationships between components are often difficult to express, and are even more difficult to encode and maintain. There are also difficulties related to the development process: the developer must be able to rapidly adapt the structure and behaviour of the UI to changing system requirements. Unfortunately, conventional code-centric approaches fall short. Hence, a developer needs to capture the structure and behaviour of a UI such that “accidental complexity” [3] is minimized. We claim that an elegant solution to these problems may be found in Multi-Paradigm Modelling [15]. By modelling every aspect of the system-to-be-built, at the most appropriate level of abstraction, using the most appropriate formalisms, it becomes possible to completely capture the structure, behaviour and visual appearance of a UI, to rapidly generate prototype implementations, to easily adapt the UI as project requirements change, and, finally, to synthesize a UI and maintain it. The modelling of UIs is an active field of research. Navarre et.al. for example developed an architecture capable of handling failures of input and output devices [16]. The goal of their research is to facilitate specification, validation and implementation, and testing of User Interfaces, and to achieve plasticity, or dynamic reconfiguration of user interfaces, not just for visual appearance, but also
for behaviour. In this approach, the behaviour of each UI component is explicitly modelled in the ICO formalism, a variant of Petri Nets [2]. The Presentation Framework of VMTS, the Visual Modeling and Transformation System [13] on the other hand, provides a flexible environment for model visualization and provides a declarative solution for appearance description. The project leverages XAML, an XML-based user interface descriptor language, to describe not only the static appearance of the UI, but the dynamic behavior of an element as well. There is a lot of similarity between our approach and the cited projects: we believe in facilitating rapid, domain-specific modelling of the UI, and that this may best be achieved by explicitly modelling the behaviour of each individual UI component. Our approach distinguishes itself in several important ways from related research. First, we attempt to solve the problems of UI development by casting it as a pure “language engineering” problem. Second, we are primarily concerned with modelling the reactive behaviour of the class of user interfaces that are made up of hierarchically-nested entities. The following section introduces the notion of Scoped User Interface and its uses. Section 3 presents Hierarchically-linked Statecharts (HlS) and section 4 demonstrates the use of HlS to model a visual modelling environment for DCharts, and extension of the Statecharts formalism [11]. Finally, we conclude and give some directions for future work.
2
Scoped User Interfaces
A Scoped User Interface is one in which reactive visual components (widgets) such as buttons and windows, but also domain-specific entities, are hierarchically nested. At the highest level of the hierarchy, widgets exhibit general behaviour. Deeper in the hierarchy, widgets have more specific behaviour. The notion of scope as it pertains to a UI is analogous to that in highlevel programming languages which provide a syntactic means of specifying the hierarchical scope of a variable. The latter is used by the compiler to bind a variable use to its declaration by searching successively higher levels in the scope hierarchy until reaching the global variable space. The variable becomes an event and the bounding boxes of graphical entities become scope delimiters. A Scoped UI, then, is one which has a notion of hierarchical scope, and can bind an event to the most tightly-binding component in a hierarchy, based upon event coordinates. There are many real-world examples in which Scoped UIs are implicitly used. Hereafter, we focus on domain/formalism-specific modelling environments. Domain- and formalism-specific modelling have the potential to greatly improve productivity as they [12]. – match the user’s mental model of the problem domain; – maximally constrain the user (to the problem at hand, through the checking of domain constraints) making the language easier to learn and avoiding modelling errors “by construction”;
– separate the domain-expert’s work from analysis and transformation expert’s work; – are able to exploit features inherent to a specific domain or formalism. This will for example enable specific analysis techniques or the synthesis of efficient code exploiting features of the specific domain. While editing in multiple formalisms within a single environment is highly desirable, it is important to be able to delimit each formalism’s scope. This is achieved by assigning formalism-specific behaviour based on graphically-delimited regions. The primary challenge faced when developing Scoped UIs is to describe the interaction between the user on the one hand and the various entities in the UI on the other hand. As those entities may exhibit reactive as well as autonomous, timed behaviour, it makes sense to consider them as “actors” [1,8]. The second challenge is to avoid creating an entirely new specification of UI behaviour for each formalism, but rather modifying it to suit special requirements. Hence, it makes sense to have at the root level a single, generic specification. Scope-specific modifications to this generic specification can then be made. That is, for each entity of the scope that has specific user-interface requirements, a specific UI specification is created specializing or complementing the more generic one.
3
Hierarchically-linked Statecharts
Hierarchically-linked Statecharts (HlS) is a formalism for visually describing the structure and behaviour of Scoped UIs based on a combination of UML Class Diagram and Statecharts [11]. UML Class Diagrams are used to describe permissible relationships such as containment and connectivity between UI components. Statecharts are used to encode reactive behaviour of individual visual entities and their interactions. As will be demonstrated in section 4, HlS make it easier to develop applications with complex UI behaviour faster and more reliably. This is possible, as HlS allow the developer to see UI development as a language engineering problem. Specifically, HlS entails the following work-flow: 1. One uses an appropriate formalism, such as UML Class Diagrams, to specify the Abstract Syntax of the visual language. This entails specifying all elements in the domain one wishes to model, and qualifying their relationships with other elements. This Class Diagram, together with constraints over its elements is commonly known as a meta-model. 2. Subsequently, one models the Concrete Visual Syntax by associating a visual entity (such as an iconic shape [4]) of the application being developed, 3. One finally specifies UI behaviour using Statecharts, such that each Statechart is associated with a class and specifies the reactive behaviour of each instance of that class. The Statechart “glues” together – reaction to user events such as mouse clicks and key-presses;
ci
al Us e
O nl
y
DC_DChartContains
DC_DChart -name
State 1
0..* 0..*
-name -enter_action -exit_action -is_default
DC_Contains
DC_Hyperedge 0..* 1
DC_History -is_deep
Fo
DC_Basic
CompositeState
-is_fina 1
rN
DC_Orthogonal
on
DC_Composite
-c
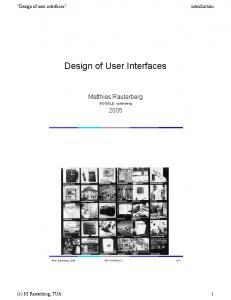
om m er the non-visual part of the language. In particular, check– interaction with ci ing of well-formedness al of constructs against the Abstract Syntax specification as well as reflecting Us the Semantics of the language which is often encoded as transformation e rules; – layout operations which act O exclusively on the Concrete Visual Syntax. nl The Abstract Syntax, Concrete Syntax, y and Behaviour models are sufficient Fig. 1. DCharts Meta-model in the Class Diagram formalism
to specify the structure, behaviour and appearance of a visual language, each sentence of which is a valid application instance. This visual language specification is sufficient to allow the automatic synthesis of a language-specific modelling environment.
4
Example
To demonstrate the usefulness and feasibility of explicitly modelling UI behaviour using HlS, a visual modelling environment for the DCharts formalism was created. DCharts, a formalism created by Thomas Feng [9] is an extension of Statecharts. For the implementation, we will use our own tool AToM3 [5,6] (A Tool for Multi-Formalism and Meta-Modelling). 4.1 Specifying DCharts Abstract and Concrete Syntax The Abstract Syntax of the DCharts visual language is shown in Fig. 1, modelled as a variant of UML the Class Diagram formalism. It has classes with attributes, associations with multiplicities, and inheritance. The rectangular boxes in the class diagram describe the nodes/vertices in the visual language. The meaning of the nodes is as follows:
– DC DChart is a representation of the entire model. All other entities will be contained by this entity. – DC Basic corresponds to a simple state that does not hierarchically contain others. – DC Composite is nearly identical to DC Basic. A major structural difference is that it can contain other states. – DC History is the history (pseudo-)state. – DC Orthogonal is an orthogonal block that allows for concurrently active states. The entities whose icons have a hexagonal shape at the top describe relationships/edges in the visual language. The first type is the hierarchical containment topological constraint relationship. The following entities are of this type: DC ChartContains, DC Contains, and DC Orthogonality. The second type of relationship are the visible arrows. DC Hyperedge, is a simple directed transition between states. It consists of common Statechart attributes such as a trigger, guard (condition), and action code. It also has DCharts specific attributes: priority, broadcast code and broadcast to field. 4.2
Specifying Formalism-specific Behaviour Using DCharts
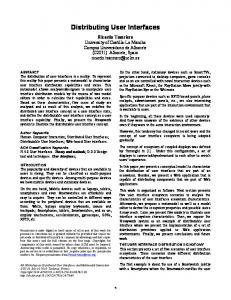
Although the above models describe both Abstract and Concrete Syntax of the visual language, we still need to model the behaviour of a language-specific visual modelling environment. This will be done in the form of Hierarchically linked Statecharts. In the following, the labels on the states and transitions of the UI behaviour Statecharts use a custom notation. This notation does not change the expressiveness of the formalism, but does make the communication between Hierarchically linked Statecharts which is encoded in explicitly in transition, enter, and exit actions, more intuitive to the modeller. A star, x*, indicates that action code is present. A plus, x+, indicates that a different Statechart handles the action. Parenthesis, , indicate that the trigger event is generated by another Statechart. Regular brackets, (x), indicate the event was generated by the initialization routine for the entity when it is first instantiated. Square brackets1 [x] indicate that the event was generated by the Statechart itself, usually within the action code of a state. Note that while the following behaviour Statecharts were designed to accommodate layout behaviour, and include events specifically targeting layout, a detailed presentation of this behaviour is beyond the scope of this paper. Button Behaviour model. Code for Buttons is automatically synthesized for each of the classes in the meta-model. They allow for the instantiation of DChart entities. The button behaviour model shown in Fig. 2 is simple. When the button to create entity X is pushed, the events “” and “” are sent 1
This should not be confused with the UML Statechart notation for transition guard.
DChartActions
*
Composite Mode *
Orthogonal Mode (create)*
Default
Idle
*
State Mode
*
History Mode
Fig. 2. Button behaviour Statechart
to this Statechart. If not already there, the Statechart moves to an Idle state upon receipt of the first event. The second event then moves it to a state whereby entity X can get instantiated. It then waits for an event requesting the creation of that entity. The “” event is generated by the DC DChart specific behaviour Statechart when it intercepts and handles the “Model Action” event. DChart entity-specific behaviour models. All visual entities of the DCharts formalism require their own behaviour models. The most important are the root entity that contains all other entities of the DCharts formalism and the composite state. Referring to the class diagram in figure 1, these correspond to DC DChart and DC Composite respectively. At the other extreme, the behaviour Statechart for the transition edge, DC Hyperedge, is trivial. All the remaining entities, excluding the non-visual containment relationships, use behaviour Statecharts that are specializations of that of the composite state. DC DChart behaviour Statechart. The behaviour of the DC DChart entity begins with initialization when the entity is first created. This initialization includes a “(create)*” trigger that sets the active state to “Idle”. From then on, the following five events trigger interesting behaviour: 1. The “” event indicates that a new DCharts formalism entity should be added to the canvas. Note that the same event is generated if one uses the AToM3 menu system or a keyboard/mouse shortcut. The actual creation of an entity is of course handled by the button behaviour Statechart described previously in 4.2. 2. The “*” event triggers a “modal” lock, forcing all events to be routed only to this Statechart. The lock is only released when either an arrow is finally created or the process is aborted, via the “*” and “Reset*” events respectively. It is necessary to refine the behaviour found in this generic UI behaviour Statechart for two reasons. The first is merely for the convenience of the
New Arrow
Create DChart Entity+
Rollback*
* [Done]
(create)*
Idle
Drop Point*
[Done]
Default
[Done]
serviceLayoutRequest+
Drop Point
Snap Points*
* * * Toggle Snap* Toggle Snap* * Drop Point
No Snap*
Reset*
[Done]
Drop Point2*
*
Rollback*
Fig. 3. DC DChart behaviour Statechart user. Instead of allowing the user to draw arrows to indicate containment relationships, only transitions may be drawn. This saves time, and a dragand-drop behaviour model exists for creating and destroying containment relationships as shall be shown later. The second reason is simply to know when transitions are actually created so that their UI behaviour Statecharts may be initialized.
Default*
[didConnect]
hierarchicalConnect*
hierarchicalDisconnect*
(create) [disconnected]
[Done]
requestLayoutOnParent*
requestLayoutOnOldParent*
Idle
(loadModelCreate)
[drop]
[Done]
[didNotConnect] (loadModelConnect)
[stayedConnected]
H
NoParent [Done]
HasParent *
[notDropRoot]
History [Request drop]
serviceLayoutRequest+
[drop]
[Done]
Request Drop*
Edit*
finalLayoutRequest*
Fig. 4. DC Composite behaviour Statechart DC Composite behaviour Statechart. The behaviour of DC Composite, the composite state, is the most complex of all. Fortunately, it is also re-usable by many other entities. The initialization phase is rather involved, with two main possibilities. The first is that an interactive session with the user is in effect, in
which case the “(create)” trigger signals the creation of a new DC DChart. Immediately, the user is presented with a dialog asking to which of the entities in the region of the newly created DC Composite, they would like to contain the new composite state. If the composite state is successfully connected to either a DC DChart or another DC Composite, then the “[didConnect]” trigger is generated, followed by a “” event to the container, and finally a “[Done]” event to set the state to “HasParent”. If the composite state is not successfully connected, then a “[didNotConnect]” event is generated and the active state is set to “NoParent”. Finally, the second of the two possibilities is that the model is being loaded rather than interactively edited. In this case, a “(loadModelCreate)” event is first sent when the DC Composite is first instantiated, setting the active state to “NoParent”. Then, a second “(loadModelCreate)” event is sent if a containing relationship is instantiated with this DC Composite as its parent, thus setting the active state to “HasParent”. The following is a list of all the events that occur after the initialization phase. 1. The ”*” event is dealt with in the same manner as the DC DChart UI behaviour Statechart. All hierarchical children are selected. 2. The “” event indicates that the user has opened an edit dialog on the DC Composite attributes. This allows the user to modify the visual appearance of the node, which may trigger requests for layout. 3. The ”” event indicates that this composite state, among potentially many other entities, has just been dragged and then dropped. The transition with this trigger promptly generates two events: “[Done]”, which restores the active state to either “NoParent” or “HasParent”, followed by “[drop]”, which causes hierarchical connection or hierarchical disconnection, respectively, to be attempted. The latter occurs only if the entity has been dropped outside of its parent container and the user has explicitly agreed to disconnect it. This triggers a “” followed by an attempt to hierarchically connect the disconnected composite state in its new location. 4. The “” event indicates that this composite state is to be deleted.
* (create)
Default*
Idle
Fig. 5. DC Hyperedge behaviour Statechart DC Hyperedge behaviour Statechart. The behaviour of the DC Hyperedge or transition, is trivially simple, as Fig. 5 shows. As noted earlier, the transition is a hyper-edge only in the meta-model, in the generated DCharts formalism itself it is a simple directed edge with one source and one target. The transition is first initialized with a “(create)” event. Afterwards, it simply awaits “*”
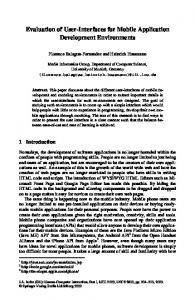
Fig. 6. Synthesized DCharts modelling environment with model instance events in order to apply changes made in its edit dialog. These changes affect the information content of the label associated with the transition. For a full description of all behaviour Statecharts we refer to M.Sc. thesis of the first author [7]. It is finally possible to synthesize a visual DChart modelling environment from the Class Diagram meta-model and the Hierarchically linked Statechart models as shown in Fig. 6. Note how this demonstrates support for multiformalism modelling, with specific behaviour for Buttons and DChart entities. 4.3
Conclusion
We have shown how it is possible to model complex, scoped, formalism-specific UI behaviour using HlS. This was possible by modelling abstract syntax and concrete syntax of a visual language explicitly as well by attaching models of behaviour to all entities in the language. It was possible to develop an example application quickly. The result has proven to be both robust and easy to maintain. Our contribution is most closely related to the work by Minas on DiaGen and DiaMeta [14]. Our focus is however mostly on the explicit modelling of behaviour. We believe HlS can be used as the “assembly language” for UI behaviour modelling. As such, we will explore other notations such as task models [10] and map them onto HlS. Our current work implements the above idea in the form of UIs running entirely within a web-browser, using only SVG and ECMAScript (JavaScript).
References 1. G. Agha and C. Hewitt. Actors: a conceptual foundation for concurrent objectoriented programming. pages 49–74, 1987. 2. E. Barboni, S. Conversy, D. Navarre, and P. A. Palanque. Model-based engineering of widgets, user applications and servers compliant with arinc 661 specification. In G. J. Doherty and A. Blandford, editors, DSV-IS, volume 4323 of Lecture Notes in Computer Science, pages 25–38. Springer, 2006. 3. F. P. Brooks. No silver bullet: Essence and accidents of software engineering. Computer, 20(4):10–19, 1987. 4. G. Costagliola, A. D. Lucia, S. Orefice, and G. Polese. A classification framework to support the design of visual languages. J. Vis. Lang. Comput., 13(6):573–600, 2002. 5. J. de Lara and H. L. Vangheluwe. AToM3 : A tool for multi-formalism and meta-modelling. In European Joint Conference on Theory And Practice of Software (ETAPS), Fundamental Approaches to Software Engineering (FASE), Lecture Notes in Computer Science 2306, pages 174 – 188. Springer-Verlag, April 2002. Grenoble, France. 6. J. de Lara and H. L. Vangheluwe. Defining visual notations and their manipulation through meta-modelling and graph transformation. Journal of Visual Languages and Computing, 15(3 - 4):309–330, June - August 2004. Special Issue on DomainSpecific Modeling with Visual Languages. 7. D. Dub´e. Graph layout for domain-specific modeling. M.Sc. dissertation, School of Computer Science, McGill University, June 2006. 8. S. N. Edward A. Lee and M. J. Wirthlin. Actor-oriented design of embedded hardware and software systems. Journal of Circuits, Systems, and Computers, 12(3):231 – 260, 2003. 9. T. H. Feng. DCharts, a formalism for modeling and simulation based design of reactive software systems. Master’s thesis, School of Computer Science, McGill University, Montr´eal, Canada, February 2004. 10. P. Forbrig and F. Patern` o, editors. Engineering Interactive Systems, HCSE/TAMODIA 2008, volume 5247 of Lecture Notes in Computer Science. Springer, 2008. 11. D. Harel. Statecharts: A visual formalism for complex systems. Sci. Comput. Program., 8(3):231–274, 1987. 12. S. Kelly and J.-P. Tolvanen. Domain-Specific Modeling: Enabling Full Code Generation. Wiley, 2008. 13. T. Levendovszky, L. Lengyel, G. Mezei, and T. M´esz´ aros. Introducing the vmts mobile toolkit. In A. Sch¨ urr, M. Nagl, and A. Z¨ undorf, editors, AGTIVE, volume 5088 of Lecture Notes in Computer Science, pages 587–592. Springer, 2007. 14. M. Minas and O. K¨ oth. Generating diagram editors with DiaGen. In AGTIVE, pages 433–440, 1999. 15. P. J. Mosterman and H. Vangheluwe. Computer Automated Multi-Paradigm Modeling: An Introduction. Simulation: Transactions of the Society for Modeling and Simulation International, 80(9):433–450, September 2004. Special Issue: Grand Challenges for Modeling and Simulation. 16. D. Navarre, P. A. Palanque, J.-F. Ladry, and S. Basnyat. An architecture and a formal description technique for the design and implementation of reconfigurable user interfaces. In T. C. N. Graham and P. A. Palanque, editors, DSV-IS, volume 5136 of Lecture Notes in Computer Science, pages 208–224. Springer, 2008.