Rate-Based End-to-End Congestion Control of Multimedia Traffic in Packet Switched Networks1 S. R. Subramanya Department of Computer Science University of Missouri-Rolla 1870 Miner Circle, Rolla MO 65409, USA
[email protected]
Mingsheng Peng Department of Computer Science University of Missouri-Rolla 1870 Miner Circle, Rolla MO 65409, USA
[email protected]
Abstract This paper proposes an explicit rate-based end-to-end congestion control mechanism to alleviate congestion of multimedia traffic in packet switched networks such as the Internet. The congestion is controlled by adjusting the transmission rates of the sources in response to the feedback information from destination such as the buffer occupancy, packet arrival rate and service rate at the outgoing link, so that a desired quality of service (QoS) can be met. The QoS is defined in terms of packet loss ratio, transmission delay, power, and network utilization. Comparison studies demonstrate the effectiveness of the proposed scheme over New-Reno TCP (a variant of AIMD: additive increase multiplicative decrease) technique during simulated congestion. Since it is end-toend, no router support is necessary, the proposed methodology can be readily applied to today’s Internet, as well as for real-time video and voice data transfer in unicast networks.
1. Introduction In the recent years, the emergence of high-speed Internet, has generated new challenging problems for computer network designers [1,2]. As the Internet offers best effort service to inelastic multimedia traffic and because the traffic has bursty traffic characteristics and various quality of service (QoS) and bandwidth requirements, a high-speed Internet requires a real-time control scheme that manages the admission and control of 1
J. Sarangapani Embedded Systems and Networking Laboratory Department of Electrical and Computer Engineering University of Missouri-Rolla 1870 Miner Circle, Rolla MO 65409, USA
[email protected]
traffic flows to avoid congestion. The basis of congestion control scheme in the Internet lies in additive increase and multiplicative decrease (AIMD) algorithm, halving the congestion window for every window containing packet loss, and increasing the congestion window roughly one segment per round trip time (RTT) otherwise [5,6]. Unfortunately, the AIMD-based congestion control scheme is known to have several problems: 1) it does not guarantee fair share to all the users (elastic and inelastic) [5]; 2) it is not proven analytically to converge and the stability of the entire system is not shown; 3) the loss of packets in the Internet may be construed as congestion; 4) the initial congestion window is currently selected heuristically; and 5) it is a reactive scheme; predictive scheme is preferable due to feedback delays. Finally, the congestion control problem in the Internet is exacerbated, as the Internet is increasingly transformed into a multiservice high-speed network [5]. To overcome some of the problems, random early detection (RED) scheme for controlling average queue size is proposed so that unnecessary packet drops can be avoided [6]. Further, explicit congestion notification (ECN) bit is introduced, which when built upon queue management allows routers the option of marking, rather than dropping packets, as indication of congestion at end nodes [6]. However, many of the problems (1), (2), (4), and (5) remain. This paper intends to overcome some of the problems of the existing Internet congestion control schemes by developing a new rate-based control scheme. The novelty of the scheme is its modeling based on non-linear system theory using which, the performance and stability of the scheme can be mathematically analyzed and established.
Research supported in part by University of Missouri Research Board Award.
Proceedings of the International Conference on Information Technology: Computers and Communications (ITCC’03) 0-7695-1916-4/03 $17.00 © 2003 IEEE
The proposed scheme is implemented and the conformance of the simulation results with mathematical analysis is demonstrated. The simulation uses measurements of buffer occupancy, packet arrival and service rates at the destination to determine the source data rates for congestion control.
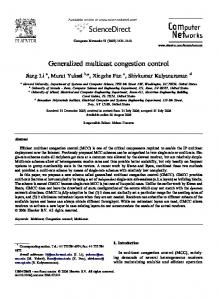
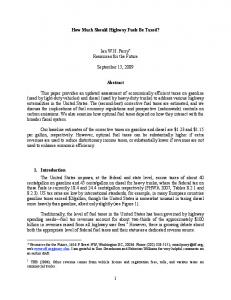
2. Background and Modeling Figure 1 illustrates an end-to-end network configuration for evaluating the proposed congestion control schemes. Congestion happens whenever the input rate is more than the available link capacity at the ingress node or when the network has a congested node inside the network.
The objective is to select a suitable traffic rate, u (k ) , such that the available bandwidth can be exploited up to its peak packet rate (PPR).
3. Proposed Congestion Control Scheme Define the traffic rate input, u (k ) , as 1 (4) u(k ) = ( xd − f (x(k )) + kv e(k )) T where k v is a diagonal gain matrix, f (x(k )) is the traffic accumulation at the bottleneck link/egress buffer, and T is the measurement interval. Then, the error in buffer length system becomes (5) e(k + 1) = [ k e(k ) + d (k )] .
Sat
p
v
If an adaptive estimator is employed to estimate the bottleneck queue and hence the traffic accumulation, fˆ (.), at the destination buffer, then the buffer length error is written as (6) e ( k + 1 ) = S a t [ k e ( k ) + fˆ (.) + d ( k )] . p
Figure 1. End-to-End network configuration. Consider the buffer dynamics of a pair of ingress/egress node pairs connected to a network and characterized as discrete time nonlinear system, to be controlled, given in the following form (1) x (k + 1) = Sat p ( f ( x (k )) + Tu (k ) + d (k )) x (k ) ∈ ℜ n is a state variable, which is the buffer occupancy at time instant k, u(k ) ∈ ℜ n a control signal, which is the regulated traffic rate, and T is the measurement interval. The function, f (.) , represents the actual packet accumulation at the network router/node, which is further defined as f (.) = [ x(k ) + q(k ) + ( I ni (k ) − S r (k ))T ] , where I ni (k ) is the packet arrival rate at the ingress node, q(k ) is the bottleneck queue level, this value is estimated by ( I ni ( k ) − I r ( k )) T . I r ( k ) is the arrival rate at the egress node, S r ( k ) is the service rate at the egress node, and Sat p (.) is the saturation function. The unknown disturbance vector, d(k ) ∈ℜn , which can be an unexpected traffic burst/load or a network fault, is assumed to be bounded by a constant, d (k ) ≤ d M . Given a desired buffer size, x d , define the performance in terms of buffer occupancy error (2) e (k ) = x (k ) − x d where the packet losses are defined due to overflows as c( k ) = max( 0, e(k )) . The dynamics of the buffer can be written in terms of the buffer occupancy errors as (3) e(k + 1) = Sat p [ f ( x(k )) − x d + Tu (k ) + d (k )]
v
The proposed rate-based methodology uses packet arrival rate at the ingress node and packet arrival rate at the egress node to estimate the network traffic accumulation. The estimated value and the packet accumulation at egress node, are together used to compute the rate u (k ) by which the source has to reduce or increase its rate. If u (k ) is a positive value, it indicates that the buffer space is available and the sources can increase their rates whereas if u (k ) is negative, it indicates that there are packet losses at the node and the sources have to decrease their rates. The details of the mathematical analysis shown in [2] suggests that the error in queue length, e(k), are bounded and the packet losses are also bounded and finite for any initial state of the network.
4. Simulation Results Network Simulator 2 (NS-2) [7] is used in the simulations. We compare the proposed scheme with the New Reno-TCP protocol [4], since the latter reflects the current packet switched networks (ex. Internet) quite well. For conveniently, we denoted our scheme as TQ.
4.1 Network Topology and Traffic Sources In our simulations, we use a typical “dumb-bell” topology as shown in Figure 2. All links except the bottleneck link are sufficiently provisioned to ensure that any drops/delays that occur are only due to congestion at the bottleneck link.
Proceedings of the International Conference on Information Technology: Computers and Communications (ITCC’03) 0-7695-1916-4/03 $17.00 © 2003 IEEE
Figure 2. Network topology. The default buffer length at each node is set to 50 packets, the particular buffer length will be used to test some cases and will be introduced in the specific cases. A packet is 1 KB in size. The simulation length is taken to be 30s. The problem of accurately modeling background traffic is more difficult. We present results using two types of background traffic: VBR (variable bit rate) and CBR (constant bit rate) traffic. In the simulation, totally six data sources S1 – S6 are used: three VBR and three CBR sources. S1 – S3 were MPEG video sources (Star wars, Jurassic and Soccer). The MPEG data sets used in the simulation was found at a website[3]. These data sets come from the movie “Star Wars IV”, “Jurassic Park I” and sport event “Soccer”. The CBR sources S4 – S6 had data rates of 2Mbps, 1Mbps, and 0.5Mbps, respectively.
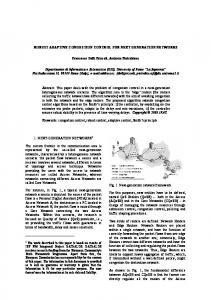
Case I: Single Source: Figure 3(a-d) shows the plot of CBR traffic with time for a single source. In the simulations the bandwidth of bottleneck Link0 between the switches was cut down from 2Mbps to 0.5Mbps and various performance measures were observed in the Link0. The associated cumulative packets loss is shown in Figure 3(a), the buffer utilization is shown in Figure 3(b), the PLR is shown in Figure 3(c), and network utilization is shown in Figure 3(d). From this figure, it is clear that during congestion, the packets are stored in the buffer to prevent losses. Further, the losses happen only during transient condition whereas no losses are observed during steady state.
Figure 3. (a) Cumulative packet loss.
4.2 Performance Metrics Transmission delay, packet loss ratio, and utilization were used as the major measures of performance. The transmission delay is defined as Transmission delay = T c − T o . (7) T
Figure 3. (b) Buffer utilization.
0
where T c and T o denotes the time to complete the transmission by a source with and without feedback respectively. The buffer utilization is defined as the ratio of the packets occupied at a buffer with the maximum buffer size. The network utilization is defined as, Network utilization = CurrentThr oughput . (8)
Figure 3. (c) PLR.
Bandwidth
The packet loss ratio (PLR) is defined as the total number of packets discarded at the receiver due to buffer overflows divided by the total number of packets sent onto the network. The system power is defined as System Power = AverageThr oughput . (9) Transmissi onDelay
4.3 Simulation Scenarios In order to show the performance of the proposed rate based end-to-end congestion control algorithm, we test it in following scenarios.
Figure 3.(d) Network utilization.
The corresponding results for TCP New-Reno are shown in Figure 4(a-d). The congestion window in New Reno-TCP scheme is shown in Figure 4(a), which exhibits a saw-tooth like behavior. We also test some other single traffic sources, the results are similar to the above. The compared results between TQ and New-Reno TCP are shown in the Table 1. The main parameters used in this simulation are shown in Table 2.
Proceedings of the International Conference on Information Technology: Computers and Communications (ITCC’03) 0-7695-1916-4/03 $17.00 © 2003 IEEE
= 2Mbps, = 10Mbps,
Figure 4. (a) Congestion window.
24 ≤ t < 27 s; 27 ≤ t.
Table 3. Network parameters for multiple sources Bottleneck Buffer Size 60 packets Bottleneck Delay 10ms Delay of Other Links 5ms Bandwidth of Other Links 10Mbps
Figure 4. (b) Cumulative packet loss. Figure 5. PLR with time for multiple traffic sources.
Figure 4. (c) Buffer utilization.
Figure 4. (d) PLR. Table 1. Compared results for single source CBR1 TQ New-Reno TCP PLR 0.517% 0.583% Transmission Delay 1.5033 1.5360 Power 1.3304 1.3021 Table 2. Network parameters for single source Bottleneck Buffer Size 10 packets Bottleneck Delay 2ms Delay of Other Links 10ms Bandwidth of Links 2Mbps Case II: Multiple Sources: We use 3 VBR traffic sources and 3 CBR traffic sources introduced in section 5.1. Source rates are adjusted using the feedback u(k) separately. For results in Figure 5, Figure 6, Figure 7, and Figure 8., congestion was created by cutting down the bandwidth of Link0 as follows: Bandwidth of Link0 = 10Mbps, 0 ≤ t < 3s ; = 2Mbps, 3 ≤ t < 6 s; = 1Mbps, 6 ≤ t < 24s;
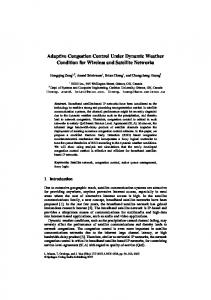
Figure 5 shows the PLR with time when TQ and NewReno TCP based congestion control schemes were deployed. The parameters used in this simulation are shown in table 3. It can be observed that the PLR for both schemes increases as the service capacity is decreased, reaches a maximum value when the service capacity is a small value during the time interval of 6 ≤ t < 24s . The PLR again decreases as the service capacity is increased. From the Figure 5, the PLR obtained using TQ congestion control scheme is much better than the New-Reno TCP congestion control scheme. The compared results between TQ and New-Reno TCP are shown in the Table 4. Table 4. Compared results for multiple sources 3VBR+3CBR TQ New-Reno TCP PLR 0.087% 0.443% Transmission Delay 0.2783 0.4110 System Power 16.5701 11.2162
Figure 6, Figure 7 and Figure 8 show Transmission Delay, PLR and System Power with different queue size for TQ and New-Reno TCP. The packets losses decrease with an increase in queue size for both schemes. From the three Figure, we can see, the Transmission Delay, PLR and System Power obtained using TQ congestion control scheme is much better than the New-Reno TCP congestion control scheme.
Figure 6. Transmission delay with queue size for multiple traffic sources.
Proceedings of the International Conference on Information Technology: Computers and Communications (ITCC’03) 0-7695-1916-4/03 $17.00 © 2003 IEEE
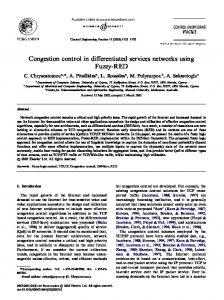
From the Figure 10, once again we can see, the PLR obtained using TQ congestion control scheme is much better than the New-Reno TCP congestion control scheme. In fact, the PLR using TQ congestion control scheme is equal to zero. The compared results between TQ and New-Reno TCP are shown in the Table 6. Figure 7. PLR with queue size for multiple traffic sources.
Table 6. Compared results for extended topology 3VBR+3CBR TQ New-Reno TCP PLR 0 0.42% Transmission Delay 0.6587 0.6643 System Power 6.9984 6.968
5. Conclusions Figure 8. System Power with queue size for multiple traffic sources. Case III: Extended Topology: We also test our scheme’s performance with multiple bottlenecks, using the extended topology of Figure 9.
This paper proposed a rate based end-to-end congestion control schemes for packet switched networks. The buffer dynamics is modeled as a nonlinear dynamical system, which is driven by the outgoing bandwidth, bottleneck queue level and inflow rate. The bottleneck queue level is estimated by packet arrival rate at ingress /egress nodes. A novel control scheme is designed to prevent congestion by adjusting the transmission rates of the sources. This rate-based approach does not require the information about the network system dynamics. Based on the results, it was concluded that the proposed methodology performs better compared to the conventional New-Reno TCP method.
Figure 9. Extended topology with multiple bottlenecks.
6. References
We use the same traffic sources: 3 VBR and 3 CBR traffic sources introduced in section 4.1. Source rates are adjusted using the feedback u(k) separately. For results in Figure 10, congestion was created by cutting down the bandwidth of different Links as follows: Bandwidth of Link0 = 10Mbps->4Mbps, t =3s; Bandwidth of Link1 = 10Mbps->3Mbps, t = 6s; Bandwidth of Link2 = 10Mbps->2Mbps, t =24s; Bandwidth of Link3 = 10Mbps->1Mbps, t = 27s.
[1] A. Pitsillides, P. Ioannou, and Loukas Rossides, “Congestion control for differentiated services using nonlinear control theory”, Proc. of the IEEE Conf. on INFOCOM, pp. 726-733, 2001. [2] S. Jagannathan, “End to end congestion control of packet switched networks”, IEEE Conference on Control Applications, pp. 519-524, Sept. 2002. [3] MPEG-4 trace files, http://www-tkn.ee.tuberlin.de/~fitzek/TRACE/ltvt.html [4] Fall, K. and S. Floyd, "Simulation-based Comparisons of Tahoe, Reno and SACK TCP", Computer Communication Review, July 1996. [5] J. Widmer, R. Denda, M. Mauve, “A survey on TCPfriendly congestion control”, IEEE Network, pp. 28-37, May/June 2001. [6] S. Flyod, “A report on recent developments in TCP congestion control”, IEEE Communications Magazine, pp. 84-90, April 2001. [7] Ns-2 manual, http://www.isi.edu/nsnam/ns/nsdocumentation.html.
Table 5. Network parameters for extended topology Bottleneck Delay 10ms Delay of Other Links 5ms Bandwidth of Other Links 10Mbps
Figure 10. PLR with time for extended topology.
Proceedings of the International Conference on Information Technology: Computers and Communications (ITCC’03) 0-7695-1916-4/03 $17.00 © 2003 IEEE