Cell Tissue Res (2011) 345:405–414 DOI 10.1007/s00441-011-1216-4
REGULAR ARTICLE
The Analysis of Receptor-binding Cancer Antigen Expressed on SiSo Cells (RCAS1) immunoreactivity within the microenvironment of the ovarian cancer lesion relative to the applied therapeutic strategy Wojciech Jozwicki & Wieslawa Windorbska & Anna A. Brozyna & Cezary Jochymski & Pawel Basta & Jerzy Sikora & Elzbieta Stasienko & Magdalena Dutsch-Wicherek & Krzysztof Koper & Lukasz Wicherek
Received: 27 March 2011 / Accepted: 15 July 2011 / Published online: 16 August 2011 # The Author(s) 2011. This article is published with open access at Springerlink.com
Abstract RCAS1 is involved in generating the suppressive profile of the tumor microenvironment that helps cancer cells evade immune surveillance. The status of the cells surrounding the cancer nest may affect both the progression of the cancer and the development of metastases. In cases of ovarian cancer, a large number of patients do not respond to the applied therapy. The patient’s response to the applied therapy is directly linked to the status of the tumor microenvironment and the intensity of its suppressive
W. Jozwicki : A. A. Brozyna : C. Jochymski Department of Tumor Pathology and Pathomorphology of the Franciszek Lukaszczyk Oncology Center, the Ludwik Rydygier Collegium Medicum, Nicolaus Copernicus University, Bydgoszcz, Poland W. Windorbska Department of Teleradiotherapy, The Franciszek Lukaszczyk Oncology Center, Bydgoszcz, Poland P. Basta Gynecology and Oncology Department of the Lukaszczyk Oncological Center in Bydgoszcz and Chair of Gynecology, Oncology and Gynecological Nursing of the Ludwik Rydygier Collegium Medicum in Bydgoszcz, Nicolaus Copernicus University, Bydgoszcz, Poland J. Sikora Gynecology and Obstetrics Department, Silesian Medical University, Katowice, Poland
profile. We analyzed the immunoreactivity of RCAS1 on the cells present in the ovarian cancer microenvironment in patients with the disease; these cells included macrophages and carcinoma-associated fibroblasts. Later we analyzed the immunoreactivity levels within these cells, taking into consideration the clinical stage of the cancer and the therapeutic strategy applied, such as the number of chemotherapy regiments, primary cytoreductive surgery, or the presence of advanced ascites. In the patients who did
E. Stasienko Gynecology and Oncology Department, The Lukaszczyk Oncological Center, Bydgoszcz, Poland
M. Dutsch-Wicherek Outpatient Unit of Otolaryngology, The Lukaszczyk Oncological Center, Bydgoszcz, Poland K. Koper : L. Wicherek Chair of Gynecology, Oncology and Gynecological Nursing, Ludwik Rydygier Collegium Medicum in Bydgoszcz, Nicolaus Copernicus University, Bydgoszcz, Poland
L. Wicherek (*) Gynecology and Oncology Department, The Lukaszczyk Oncological Center, Bydgoszcz, Poland e-mail:
[email protected]
406
not respond to the therapy we observed significantly higher immunoreactivity levels of RCAS1 within the cancer nest than in those patients who did respond; moreover, in the non-responsive patients we found RCAS1 within both macrophages and carcinoma-associated fibroblasts. RCAS1 staining may provide information about the intensity of the immuno-suppressive microenvironment profile found in cases of ovarian cancer and its intensity may directly relate to the clinical outcome of the disease. Keywords RCAS1 . Ovarian cancer . RCAS1 positive macrophages . CAF
Introduction Cancer cells must evade immune surveillance. Many molecular mechanisms present within both the cancer milieu and the cancer microenvironment participate in this process of evasion. RCAS1 is a well-known membrane protein that was discovered in 1996 by Sonoda (1996). More specifically, it is a membrane II protein that is expressed on various types of cancer cells, including those of ovarian cancer. The presence of RCAS1 expression correlates with a poor prognosis (Akahira et al. 2004; Sonoda et al. 2008; Enjoji et al. 2005) for the case. This is because this protein is able to suppress cytotoxic T lymphocytes (CTLs) and NK cells (Nakashima et al. 1999; Yoshida et al. 2008) and it may evoke apoptosis of these mononuclear immune cells as well as trough activation of FADD in its cytoplasm (Matsushima et al. 2001). Some recent research papers have revealed that RCAS1 expression is not limited to the cancer milieu but can also be detected within cells derived from the cancer microenvironment, such as macrophages or stromal cells (Adamek et al. 2009; Dutsch-Wicherek 2010; DutschWicherek et al. 2009; Enjoji et al. 2006). Moreover, the presence of RCAS1 within the cancer microenvironment seems to be related to the escape of the cancer cells from immune surveillance (Sonoda et al. 1996; 2005a; b; Giaginis et al. 2008; Enjoji et al. 2004a). In a similar way, the function of RCAS1 is related to the soluble form of RCAS1 (Sonoda et al. 1996; Giaginis et al. 2008; Enjoji et al. 2004a; b; Dutsch-Wicherek and Wicherek 2008; Sonoda et al. 2010). The soluble form of RCAS1, or sRCAS1, has been detected in the blood sera of patients with various types of carcinomas and, moreover, the level of sRCAS1 correlated inversely with the response to applied anti-cancer therapy (Dutsch-Wicherek and Wicherek 2008; Sonoda et al. 2006). It is well known that the status of the tumor microenvironment is crucial for the development of the cancer nest. Both stromal cells and even immune cells
Cell Tissue Res (2011) 345:405–414
present within the tumor microenvironment may help the cancer to progress. The macrophages from the tumor microenvironment, called tumor-associated macrophages (TAM), may suppress the activity of cytotoxic immune cells. Most likely, this process is realized by the expression of various proteins present on the cell membrane of the macrophages, including B7H4 and RCAS1 (Adamek et al. 2009; Dutsch-Wicherek 2010; Dutsch-Wicherek et al. 2009; Kryczek et al. 2007; Kryczek et al. 2006). As immune cells are able to suppress the activity of CTLs and NK cells, RCAS1-positive macrophages probably participate in generating the suppressive profile of the tumor microenvironment (Yoshida et al. 2008). The cellular profile of the tumor microenvironment is important for the clinical outcome of the cancer patient treatment. Not only do the macrophages surrounding the tumor affect its homeostasis but recently carcinoma-associated fibroblasts (CAFs) have been identified as a cellular population important for tumor growth. Furthermore, tumor growth does not proceed uniformly (Wu et al. 2011; Dutsch-Wicherek et al. 2010; DutschWicherek et al. 2011). Consequently, in advanced carcinoma it is possible to distinguish different zones within the tumor. For instance, one part of the tumor may be typified by strongly matched proliferation while another zone may be typified by apoptosis, necrosis, or hyalinization of the stroma. The development of metastases is linked with changes not only within the same tumor (e.g., the grading of cancer cells) but also in the cancer microenvironment itself. Most likely, the zones of the microenvironment associated with strong tumor growth (highly matched proliferation) differ from those zones in which there is highly marked hyalinization of the stroma. For this reason we decided to focus on RCAS1 immunoreactivity levels in the different parts of the tumor as well as in the different parts of its microenvironment. Since RCAS1 has been identified as a protein involved in the regulation of cytotoxic immune cells within the tumor microenvironment in patients with ovarian and cervical cancer, we selected RCAS1 for a planned immunohistochemical analysis that would examine the different zones in both the cancer milieu and in the cancer microenvironment. In his study, Sonoda demonstrated that, while on the one hand, the intensity of the RCAS1 immunoreactivity in ovarian cancer cells was related to a poor prognosis for the case (Sonoda et al. 2009), on the other hand, the presence of RCAS1 expression within the cervical cancer microenvironment was associated with the potential to develop metastases (Sonoda et al. 2005a; 2007). The participation of RCAS1 in the development of metastases was also found in other types of adenocarcinoma (Dutsch-Wicherek et al. 2009; Iwasaki et al. 2000; Nakabayashi et al. 2007). Recently, RCAS1 has been proposed as a clinically useful
Cell Tissue Res (2011) 345:405–414
marker for detecting various kinds of adenocarcinoma (AliFehmi et al. 2010; Giaginis et al. 2009). We therefore decided to analyze the RCAS1 immunoreactivity levels precisely, measuring them in a large group of patients treated for ovarian cancer with both surgery and subsequent chemotherapy. We detected the same kind of RCAS1 immunoreactivity profile within both the cancer milieu and the cancer microenvironment. The differences in RCAS1 immunoreactivity were analyzed according to different clinical parameters, including the kind of surgery performed and the response to the chemotherapy applied.
Methods
407
diaminobenzidine (DAB) (Dako, Carpinteria, CA), counterstained with hematoxylin and then dehydrated and mounted in a permanent medium (Consul Mount; Thermo Fisher Scientific Inc. Waltham, MA, USA). As a positive control breast cancer sections were used. The sections were viewed through the Nikon Eclipse 80i (Nikon Instruments Europe BV, Badhoevedorp, the Netherlands). The intensity of the staining of both the cytoplasm and membrane was evaluated. The percentage of stained cells Table 1 Clinical characteristics of the patient and RCAS1 immunoreactivity changes correlating with different parts of the tumor and various clinico-pathological features (a precise description of these relationships was presented in the results section of chapters 2 and 3) Data
N (%)
Significant RCAS1 immunoreactivity correlating with different clinicopathological features
Age
54 (8)
No
Patients The patients included in the study were treated surgically for ovarian cancer between December 2006 and January 2010 in the Department of Gynecology and Oncology of the Lukaszczyk Oncological Center, Bydgoszcz, Poland. All of the 74 patients involved underwent optimal cytoreductive surgery either during the primary surgical procedure or following neoadjuvant chemotherapy. The histological characteristics of the tumors are able presented in Table 1: grading, histological type and FIGO stage (Table 1). The patients were divided according to the therapeutic strategy applied: These data are also presented in Table 1 (Table 1). The patients included in our study were observed after the surgical procedure and chemotherapy in the Out-patient Unit of the Lukaszczyk Oncological Center, Bydgoszcz, Poland. The period of the follow up observation was from 1 to 5 years. The patient’s consent was obtained in each case. Prior to the present study we also obtained the approval of the Jagiellonian University Ethical Committee for our research program (DK/KB/CM/0031/447/2010). Immunohistochemistry The RCAS1 immunoreactivity levels were evaluated in samples obtained from 74 patients with primary ovarian cancer treated at the Lukaszczyk Oncology Center, Bydgoszcz, Poland. Formalin-fixed paraffin embedded 4 μm sections were de-waxed, hydrated gradually and incubated with an anti-RCAS1 antibody (ready to use; Medical & Biological Laboratories Co, Ltd, Japan) overnight at 4°C. The sections were then rinsed and incubated for 30 minutes with the EnVision peroxidase labeled polymer conjugated to anti-mouse secondary antibody (Dako, Carpinteria, CA). After washing the sections, the reaction product was developed for 5 minutes using 3,3′-
Grading
Yes
G1
1 (1.3%)
G2
25 (33.8%)
G3
48 (64.9%)
FIGO
Yes
I
20 (27.0%)
II
10 (13.5%)
III
44 (59.5%)
IV
0
Ca125 before surgery
1823.36
Surgery
Yes
primary cytoreductive surgery - optimally debulked neoadjuvant chemotherapy - secondary cytoreductive surgery Ascites
55 (74.3%)
0
42 (57.3%)
1
32 (42.7%)
19 (25.7%)
Yes
Histology Serous adenocarcinoma (ACS) Mucinous adenocarcinoma ( ACM) Endometrioid adenocarcinoma (ACE) Male differentiated (MD)
No
No 31 (41.9%) 14 (18.9%) 7 (9.4%) 10 (13.5%)
Clear cell carcinoma (ACC) Granulosa cell tumors (GCTs) Number of chemotherapy regimens 1
4 (5.4%)
More than 1
15 (20.3%)
8 (10.9%) Yes 59 (79.7%)
408
Cell Tissue Res (2011) 345:405–414
was also evaluated using the subjective method of the succeeding approximations we previously described (Jozwicki et al. 2005). Staining intensity was evaluated as negative (0) or positive with a grade of 1+ (pale brown), 2+ (brown) or 3+ (dark brown). Ki67 immunostaining was performed using consecutive sections. After deparaffinization, rehydration and antigen retrieval using PT Link and high pH buffer (Dako, Carpinteria, CA), the endogenous peroxidase activity was quenched with a 3% solution of H2O2. Anti-Ki67 primary monoclonal mouse antibody, clone MIB-1 (Dako), at dilution 1:100 with EnVision™ FLEX Antibody Diluent (Dako, Carpinteria, CA) was then applied for 30 minutes. Next, the subsequent steps of immunostaining were performed as in RCAS1 labeling. Finally, the percentage of Ki67-positive cancer cells was evaluated in both the high and low proliferative areas.
Definitions used methodologically: CI (Cytoplasmatic Immunoreactivity) – the staining level of cytoplasmatic structures of the cancer cell; MI (Membrane Immunoreactivity) – the staining level of the cell membrane of the cancer cell; CP (Central Part) – the older part of the tumor, without signs of dynamic growth; BP (Border Part) – the younger part of the tumor, with signs of dynamic growth (e. g., the presence of small nests of tumor cells, expressions of stromal reactivity, as inflammatory infiltration and/or types of stromal modeling pattern). The categorization of the central and border parts of the tumors was carried out by means of morphological assessment. Later, Ki67 immunostaining was performed in order to evaluate the rate of proliferation in given areas. We determined the 40%-cutoff point based on the percentage of Ki67-positive cancer cells (calculated as follows: mean percentage of Ki67-positive cells for
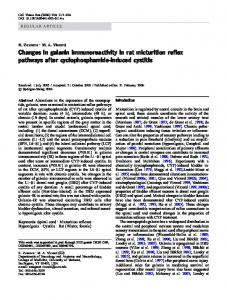
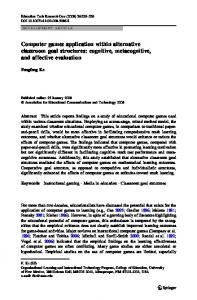
Fig. 1 Ki67 immunostaining in ovarian cancer. a) The arrow indicates the area with a high proliferation rate of the border part of the tumor with a newly invasive ovarian cancer cell group. The arrow heads indicate areas of the central part of the tumor showing a lower
percentage of the Ki67-positive cells. Scale bar 100 μm. b) The enlarged area of the central part of the tumor. Scale bar=50 μm. c) The enlarged area of the newly invasive ovarian cancer cell group. Scale bar=50 μm
Cell Tissue Res (2011) 345:405–414
central parts +1SD). The proliferation rate in the areas of the tumors initially defined as central parts was significantly a lower when compared to the rate in the areas defined as border parts (p