BIOINFORMATICS APPLICATIONS NOTE Databases and ontologies
Vol. 29 no. 21 2013, pages 2810–2811 doi:10.1093/bioinformatics/btt487
Advance Access publication August 19, 2013
RDAVIDWebService: a versatile R interface to DAVID Cristo´bal Fresno1,2,* and Elmer A. Ferna´ndez1,2,* 1
CONICET, Buenos Aires and 2BioScience Data Mining Group, Catholic University of Co´rdoba, Co´rdoba, Argentina
Associate Editor: Janet Kelso
ABSTRACT Summary: The RDAVIDWebService package provides a class-based interface from R programs/scripts to fully access/control the database for annotation, visualization and integrated discovery, without the need for human interaction on its Web site (http://david.abcc.ncifcrf.gov). The library enhances the database for annotation, visualization and integrated discovery capabilities for Gene Ontology analysis by means of GOstats-based direct acyclic graph conversion methods, in addition to the usual many-genes-to-many-terms visualization. Availability and implementation: RDAVIDWebService is available as an R package from the Bioconductor project (www.bioconductor.org) and on the authors’ Web site (www.bdmg.com.ar) under GPL-2 license, subjected to the terms of use of DAVID (http://david.abcc. ncifcrf.gov/content.jsp?file¼WS.html). Contact:
[email protected] or
[email protected] Received on April 17, 2013; revised on July 16, 2013; accepted on August 14, 2013
1
INTRODUCTION
One of the most accessed systems for functional genomics/proteomics analysis is the database for annotation, visualization and integrated discovery (DAVID), a web-based online bioinformatics resource (http://david.abcc.ncifcrf.gov) that aims to provide tools for functional interpretation of large lists of genes/ proteins (Huang et al., 2009). Its access is carried mainly through a Web site. There is also a uniform resource locator (URL)based application programming interface, to query DAVID programmatically, accessible through DAVIDQuery R package (Day and Lisovich, 2010). However, the URL-application programming interface has limited capabilities, such as URL length, and only works with the default settings. In 2012, a web service interface was made available allowing full access and control over all its functionalities except visualization (Jiao et al., 2012). Although it is possible to handle DAVID web services (DWS) through R, it requires high programming skills. In addition, query results are difficult to manage, as they are XML (SOAP package, Temple Lang, 2012) or Java objects (rJava package, Urbanek, 2013). Here we provide a versatile class-based R interface to access DAVID. It is an R wrapper to all DWS functionalities, with several new features such as offline processing (allows using previously queried saved reports) and native R classes data types. Additionally, it overcomes DWS visualization constraints, providing the usual many-genes-to-many-terms feature, and enhances DAVID capabilities for Gene Ontology (GO, *To whom correspondence should be addressed.
2810
Ashburner et al., 2000) analysis by means of GOstats-based (Falcon and Gentleman, 2007) direct acyclic graph (DAG) conversion methods. Therefore, it expands DAVID features by allowing new developments through one of the most used computer languages in Bioinformatics, R (R Core Team, 2012).
2
IMPLEMENTATION
The package implements a reference class object, by means of R5 paradigm, for DWS communication through a Java client. This allows the establishment of a unique user access point. To reduce Java-to-R handshaking due to parsing data structures (a time-consuming computational task), the provided Javabased file report client was enhanced to allow formatting of all the DAVID outputs into appropriate RDAVIDWebService S4 R classes. This speeds up the bottleneck data importation process. In addition, it allows locally saving DAVID query to file for further analysis, as well as using Web site-generated reports. Thus, permits using web services and Web site query results interchangeably. This implementation carries all the limitations of DWS as stated at DAVID’s Web site (http://david.abcc.ncifcrf.gov/content.jsp?file¼WS.html): (i) gene or term cluster report will handle up to 3000 genes, (ii) a user or computer can compute up to 200 jobs in a day and (iii) DAVID Team reserves the right to suspend any improper uses of DWS without notice.
3
FEATURES
Ease of use: It provides a uniform framework to access DAVID analysis straight from R without the need of ad hoc parsing queried reports. Data import/export: Results from DAVID can be accessed through R or also generated on the Web site. In both cases, they are stored in the same format for later use. This lets on-/ offline processing capabilities within R. Thus, queried reports generated anytime and anywhere can be used for processing, without the need to redo the uploading to DAVID. Visualization: Customizable many-genes-to-many-terms 2D relationship views are also available with ggplot2 package (Wickham, 2009). GO structure: DAVID set enrichment analysis or modular enrichment analysis results can be mapped into GOstats-based DAGs. This enables visualization of Expression Analysis Systematic Explorer (EASE) score-based enriched biological process (BP), molecular function and cellular component GO terms in the DAGs. Thus, the exploration and analysis of blurred pattern presence is facilitated, compared with the usual tabular format.
ß The Author 2013. Published by Oxford University Press. All rights reserved. For Permissions, please e-mail:
[email protected]
RDAVIDWebService
4 EXAMPLE APPLICATION DAVIDWebService requires a registered DAVID user (this is a prerequisite to use DWS). By means of the registered institutional e-mail, the user can build a DAVIDWebService object and establish a connection. Then, a gene list should be uploaded providing a name and type of list. Here, the one provided in the DAVID Web site is used (demoList1 with AffymetrixÕ identifiers of 155 genes). Then, the status of the connection is saved in david object. 4 david5-DAVIDWebService$new("
[email protected]") 4 data(demoList1) 4 result5-addList(david, demoList1, þ idType¼"AFFYMETRIX_3PRIME_IVT_ID", þ listName¼"demoList1", listType¼"Gene") 4 david
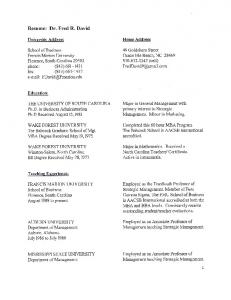
Fig. 1. Functional annotation cluster exploration of the third cluster. (A) A 2D view of the evidence of the four term/category members present in the cluster. (B) GO DAG induced by cluster three in (A). Terms with an EASE score 50.1 are shown in gray. In addition, the ratio between genes on the list versus background reference is displayed. Because no information is available regarding the other terms into the mapped GO structure from the cluster in (A), NAs (not available) are introduced when required
DAVIDWebService object to access DAVID’s website. User email:
[email protected]
However, as we go up toward the first row (regulation of blood pressure), only four ids have evidence related to it. In this view, neither the hierarchical structure of GO is considered nor the members that are enriched or not (default option). Therefore, the user can extend DAVID’s features obtaining the associated induced DAG structure of the cluster (DAVIDGODag) and contextualize it using GOstats functionalities (plotGOTermGraph, see Fig. 1B).
Available Gene List/s: Name Using 1 demoList1
*
Available Specie/s: Name Using 1 Homo sapiens(155)
*
Available Background List/s:
4 davidGODag5-
Name Using 1 Homo sapiens
þ DAVIDGODag(members(termCluster)
*
þ [[clustNumber]], pvalueCutoff¼0.1, "BP")
In this example, the complete genome is selected as the default background. If required, the user can select which annotation category to use, e.g. GOTERM_BP_ALL. A user can obtain the functional annotation cluster report and inspect the results using the following code: 4 setAnnotationCategories(david,
4 plotGOTermGraph(g¼goDag(davidGODag), þ r¼davidGODag, max.nchar¼30, þ node.shape¼"ellipse")
4 termCluster5-
Funding: This work was supported by the National University of Villa Maria [31/0186 and 31/0187 to E.F.] and Catholic University of Co´rdoba, Argentina.
þ getClusterReport(david,type¼"Term")
Conflict of Interest: none declared.
þ "GOTERM_BP_ALL")
4 head(summary(termCluster))
1 2 3 4 5 6
Cluster
Enrichment
Members
REFERENCES
1 2 3 4 5 6
2.9042961 1.9768081 1.3473934 1.3095547 1.2982877 0.8279339
14 14 4 8 6 4
Ashburner,M. et al. (2000) Gene Ontology: tool for the unification of biology. Nat. Genet., 25, 25–29. Day,R. and Lisovich,A. (2010) DAVIDQuery: retrieval from the DAVID bioinformatics data resource into R. R package version 1.20.0. Falcon,S. and Gentleman,R. (2007) Using GOstats to test gene lists for GO term association. Bioinformatics, 23, 257–258. Huang,D.W. et al. (2009) Systematic and integrative analysis of large gene lists using DAVID bioinformatics resources. Nat. Protoc., 4, 44–57. Jiao,X. et al. (2012) DAVID-WS: a stateful web service to facilitate gene/protein list analysis. Bioinformatics, 28, 1805–1806. R Core Team. (2012) R: a language and environment for statistical computing. In: R Foundation for Statistical Computing. Vienna, Austria, ISBN 3-900051-07-0. Temple Lang,D. (2012) SSOAP: client-side SOAP access for S. R package version 0.9-1. Urbanek,S. (2013) rJava: low-level R to Java interface. R package version 0.9-4. Wickham,H. (2009) ggplot2: elegant graphics for data analysis. Springer, New York. ISBN 978-0-387-98140-6.
Then, visually explore the 2D view of a particular cluster (e.g. the third). 4 clustNumber5-3 4 plot2D(termCluster, clustNumber)
However, in Figure 1A, the four term/category members of this cluster share all the ids at ‘system process’ (bottom row).
2811