Principal Scientist, GNS Science, Lower Hutt, New Zealand ..... 2010, Ninis et al. 2009, 2010) and previous trenching results (e.g. Van Dissen et al. 1992, Van ...
77
RE-EVALUATION OF CONDITIONAL PROBABILITY OF RUPTURE OF THE WELLINGTON-HUTT VALLEY SEGMENT OF THE WELLINGTON FAULT D.A. Rhoades1, R.J. Van Dissen2, R.M. Langridge3, T.A. Little4, D. Ninis5, E.G.C. Smith6 and R. Robinson7 SUMMARY New information on the activity of the Wellington-Hutt Valley segment of the Wellington Fault, New Zealand, has become available from geological and modelling studies undertaken in the last several years as part of the “It’s Our Fault” project. There are now revised estimates of: 1) the timing of the most recent rupture, and the previous four older ruptures; 2) the size of single-event displacements; 3) the Holocene dextral slip rate; and 4) rupture statistics of the Wellington-Wairarapa fault-pair, as deduced from synthetic seismicity modelling. The conditional probability of rupture of this segment over the next 100 years is re-evaluated in light of this new information, assuming a renewal process framework. Four recurrence-time distributions (exponential, lognormal, Weibull and Brownian passage-time) are explored. The probability estimates take account of both data and parameter uncertainties. A sensitivity analysis is conducted, entertaining different bounds and shapes of the probability distributions of important fault rupture data and parameters. Important findings and conclusions include: 1. The estimated probability of rupture of the Wellington-Hutt Valley segment of the Wellington Fault in the next 100 years is ~11% (with sensitivity results ranging from 4% to 15%), and the probability of rupture in the next 50 years is about half of that (~5%). 2. In all cases, the inclusion of the new data has reduced the estimated probability of rupture of the Wellington Fault by ~50%, or more, compared to previous estimates.
INTRODUCTION The Wellington-Hutt Valley segment of the Wellington Fault (Figure 1), extending from offshore Cook Strait to Kaitoke, near Upper Hutt, is widely perceived to pose the greatest risk to life, property and societal infrastructure of any known active earthquake fault in New Zealand. The conditional probability of rupture of this fault is therefore a matter of great importance. A re-evaluation of this conditional probability was a primary goal of the Likelihood Phase of the “It’s Our Fault” (IOF) project (Van Dissen et al. 2009, 2010). The results of that re-evaluation are reported here. The basic statistical method adopted is that of Rhoades et al. (1994), with modifications described by Rhoades & Van Dissen (2003) and applied by Rhoades et al. (2004) to the major faults in the Wellington area, including the WellingtonHutt Valley segment of the Wellington Fault. In this method, the probability of rupture of the fault in some future timeperiod of interest is expressed as a single value that accounts for both data and parameter uncertainties. As in the previous
studies, a range of different recurrence-time distributions are considered – namely the exponential, lognormal, Weibull and Brownian passage-time (or inverse Gaussian) distributions. The exponential recurrence-time distribution corresponds to a stationary Poisson process commonly adopted for seismic hazard analysis, in which the hazard is time-invariant. The lognormal model has been widely used for rupture recurrence (e.g., Nishenko & Buland 1987). For this model the hazard is zero immediately after a rupture, rises gradually to a peak and then tails off asymptotically to zero as the elapsed time greatly exceeds the mean recurrence interval. The Weibull distribution is widely used in failure-time modelling for manufactured items, and was proposed as a model for faultrupture recurrence by Hagiwara (1974). For the range of values of the shape parameter considered here, the hazard under this model increases monotonically from zero immediately following a rupture until the time of the next rupture. The Brownian passage-time (inverse Gaussian) distribution was proposed by Ellsworth et al. (1999) and Matthews et al. (2002) as a physically realistic model of earthquake occurrence, and at present appears to be the most
1
Principal Scientist, GNS Science, Lower Hutt, New Zealand (member)
2
Senior Scientist, GNS Science, Lower Hutt, New Zealand (Fellow) Senior Scientist, GNS Science, Lower Hutt, New Zealand
3 4 5 6 7
Associate Professor, Victoria University of Wellington, Wellington, New Zealand Doctoral candidate, Victoria University of Wellington, Wellington, New Zealand Professor, Victoria University of Wellington, Wellington, New Zealand (Fellow) Principal Scientist, GNS Science, Lower Hutt, New Zealand BULLETIN OF THE NEW ZEALAND SOCIETY FOR EARTHQUAKE ENGINEERING, Vol. 44, No. 2, June 2011
78
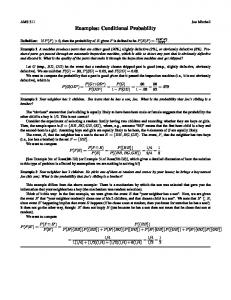
Figure 1:
Active faults of central New Zealand, with the Wellington-Hutt Valley segment of the Wellington Fault highlighted in bold (after Figure 7 of Barnes et al. 2008). Offshore faults from Barnes et al. (2008) and Pondard & Barnes (2010); onshore faults from GNS Science’s Active Faults Database. Study sites mentioned in the text are: K, Kaitoke; EH-TM, Emerald Hill/Te Marua; TK-LG, Te Kopahou/Long Gully.
generally accepted model. For this model the hazard is zero immediately after a rupture, rises gradually to a peak and then tails off asymptotically to a positive constant as the elapsed time greatly exceeds the mean recurrence interval. The Rhoades & Van Dissen (2003) methodology requires knowledge of the distribution of the long-term average slip rate and its uncertainty, the mean single-event displacement and its uncertainty, and the dates of known recent ruptures and their uncertainties. It also requires specification of prior distributions for the parameters of the recurrence-time distributions. The prior distributions adopted here are the same as those used by Rhoades & Van Dissen (2003) and Rhoades et al. (2004) for the exponential, lognormal, Weibull, and Brownian passage-time models. The principal differences between the present evaluation and that of Rhoades et al. (2004) lies in the new geological data acquired as part of the IOF project. The IOF project has provided new data affecting estimates of the size of the average single-event displacement (Little et al. 2010) and the long-term average slip rate (Ninis et al. 2009, 2010), and hence the average recurrence interval between ruptures. It has also provided new data affecting estimates of the times of occurrence of the two most recent ruptures and information allowing estimates of the times of the next three most recent ruptures to be made (Langridge et al. 2009, 2011). In addition, analysis of a synthetic earthquake catalogue derived from a computer model of the major faults in the Wellington region and their interactions has provided new information on the effect of ruptures of the Awatere and Wairarapa faults on the rupture inter-event times of the Wellington Fault (Robinson et al. 2009, and in review). These new data/results are summarised below as they pertain to our re-evaluation of
conditional probability of rupture of the Wellington-Hutt Valley segment of the Wellington Fault. DATA AND METHODS Size of Single-Event Displacements At Te Marua (location shown in Figure 1) there is a well preserved flight of a dozen or so young (675 yrs BP), Kaitoke (730-895 yrs BP). Taken collectively, the best estimate for the timing of Event II is 790895 yrs BP (Langridge et al. 2009, 2011). Using AD 2010 as a datum, the best estimate for the timing of Event II is 850-955 years ago (Figure 2). In our calculations of conditional probability of rupture we use a uniform probability disruption between 850-955 years for the timing of this the penultimate surface rupture earthquake of the Wellington-Hutt Valley segment of the Wellington Fault. Event III The best constraint for the timing of Event III is 1,835-2,340 yrs BP from the Te Kopahou/Long Gully area. Interpretation of the stratigraphy in the trench that best constrains the occurrence and timing of Event III suggests that it is more likely that Event III occurred towards the older end of the above age range (for more detail, see Langridge et al. 2009, 2011). Accordingly, in our calculations of conditional probability of rupture we adopt a triangular probability disruption between 1,895-2,400 years ago (using AD 2010 as the datum) for the timing of Event III, with maximum probability at 2,295 years ago (Figure 2), defined by the midpoint of the 95% calibrated age range of the relevant bounding radiocarbon age (in this case, sample TK1-3 of Langridge et al. 2009, 2011). Event IV Constraints on the timing of Event IV are broad. At the Te Kopahou/Long Gully area Event IV has a minimum age of 2,460 yrs BP, and at Te Marua a maximum age of ~4,900 years. In our calculations of conditional probability of rupture we adopt a trapezoidal-shaped probability distribution for the timing of Event IV (Figure 2). In our preferred earthquake timing scenario, the minimum bound of the age range of Event IV (2520 years ago; AD 2010 datum) is defined by the minimum of the 95% calibrated age range of the relevant bounding radiocarbon age (TK1-1 of Langridge et al. 2009, 2011). The probability distribution rises to a maximum at the mid-point of the 95% calibrated age range of the relevant bounding radiocarbon age (2,660 years; TK1-1 of Langridge
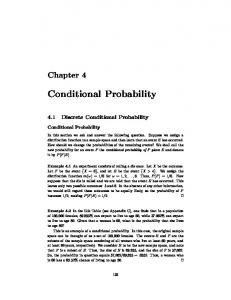
Figure 2:
Data input distributions for the times of past ruptures on the Wellington-Hutt Valley segment of the Wellington Fault.
et al. 2009, 2011). The maximum bound of the age range of Event IV (4,900 years) is defined by the +1σ OSL age (sample TM-6 of Little et al. 2010) of an alluvial terrace that is dextrally offset by ~20 m (interpreted to be the result of four surface rupture displacements). From its maximum bound, the probability distribution rises to a maximum at 4,287 years ago (AD 2010 datum) based on the maximum of the 95% calibrated age range of radiocarbon sample KAF 3/5 which defines the maximum age of a surface rupture event identified in the Kaitoke area (Langridge et al. 2009, 2011). This same rupture event at Kaitoke has a more interpretive minimum age constraint defined by radiocarbon sample KAF 3/6, with a minimum and mid-point of its 95% calibrated age range of 2,560 years ago and 3,010 years ago, respectively (AD 2010 datum). These values are used as alternative minimum bounds for the timing of Event IV in some of our sensitivity runs.
81 Event V Though more interpretive in nature, the timing of Event V can be inferred at two sites along the Wellington-Hutt Valley segment: Emerald Hill (5.5 was then compiled (equivalent to several hundred thousand years of seismicity). Sensitivity tests have been conducted to investigate the effect of changes to the following model parameters: dip of Wellington Fault, coefficients of friction, subduction interface properties, pore pressure effects, asperities, frictional healing, no small faults, visco-elastic relaxation (approximated), stress drop, and dynamic rupture enhancement factor. Of these,
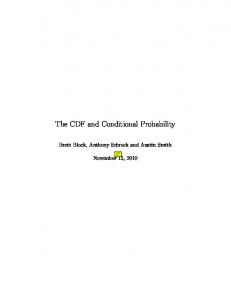
changes to the dip of the Wellington Fault had the greatest impact. See Robinson et al. (2009, and in review) for more detail. Additional major results of this modelling are as follows: 1. The regional moment release rate is constant over periods of ~1,000 years or more, but is quite variable on scales of a hundred years or so. 2. In general, the recurrence intervals of the major faults have broad distributions (coefficients of variation of mean recurrence interval are typically in the order of ~0.5). 3. Following a short period of increased risk of triggered events, a stress shadow effect predominates, probably reflecting the mutually inhibitory nature of parallel strikeslip faults and the need for a constant long-term moment release rate. 4. Wellington Fault rupture inter-event times (Mw ≥ 7.3) that span a Wairarapa Fault rupture (and an Awatere Fault rupture) are typically longer by: a) a few hundred years compared to Wellington Fault inter-event times that do not encompass ruptures of these two neighbouring faults (Figure 3), and b) about 65 years compared to the mean of all Wellington Fault inter-event times. An intriguing and, if found true, profound, aspect of Figure 3 is that there are no Wellington Fault rupture (Mw ≥ 7.3) interevent times shorter than 500 years in the synthetic seismicity catalogue. This implies that following any major rupture of the Wellington-Hutt Valley segment of the Wellington Fault there would be negligible probability that the fault would again rupture in a large earthquake in the next 500 years. This sort of fault behaviour is not emulated well by any of the four recurrence-time distributions considered in this study. No attempt is made here to use a recurrence-time distribution which would fit well to the low end of the distribution of simulated inter-event times. If such a distribution were used (such as a 3-parameter Weibull distribution), it is clear that the present conditional probability of rupture would be smaller by at least an order of magnitude than the estimates given here (see below). Further empirical evidence supporting the existence of such a persistent lack of short Wellington Fault inter-event times, as that modelled in Figure 3, is needed before it would be appropriate to incorporate it in practical estimates of the fault hazard. The result in (4b) is taken into account in the sensitivity study of the estimated conditional probability of rupture, by considering an alternative data set in which 65 years is subtracted from the time estimated to have elapsed since the last rupture. Data Inputs The input data distributions for the long-term average slip rate, the mean single-event displacement and the times of past ruptures are given in Table 1. Compared with the input data for the Rhoades et al. (2004) study, the average slip rate is now lower (~5.8 mm/yr instead of ~6.8 mm/yr), the mean single-event displacement is larger (~5.0 metres instead of ~4.2 metres) and has a smaller uncertainty, the timing of Event I is later (i.e. more recent) by about 150 years and the timing of Event II earlier by about 60 years. The combined effects of these changes are to increase the estimated average recurrence interval and reduce the estimated elapsed time since the most recent event. Both of these effects tend to reduce the present conditional probability of rupture.
82 Table 1. Preferred distributions of input data for computation of conditional probability of rupture on the Wellington-Hutt Valley segment of the Wellington Fault. Fault characteristic
Probability distribution
Horizontal slip rate (mm/year)
Lognormal (mean = 5.8, s.d. = 0.74)
Mean single-event displacement (m)
Lognormal (mean = 5.0, s.d. = 0.75) Event I:
Timing of past ruptures (years before AD 2010)
Uniform (170, 370)
Event II: Uniform (850, 955) Event III: Triangular (1895, 2295, 2400) Event IV: Trapezoidal (2520, 2660, 4287, 4900) Event V: Triangular (7350, 8350, 8440)
Statistical Method The statistical method applied here is the same as that described by Rhoades & Van Dissen (2003) in a study of the conditional probability of rupture of the Alpine Fault, and applied by Rhoades et al. (2004) to the major faults of the Wellington region, including the Wellington-Hutt Valley segment of the Wellington Fault. This method is an elaboration of the method proposed by Rhoades et al. (1994) for taking account of uncertainties in both data and parameter values when estimating the time-varying probability of rupture of a fault or fault segment. The reader is referred to Rhoades & Van Dissen (2003) for details of the method, which is outlined briefly below.
Figure 3:
Normalised histogram of Wellington Fault rupture (Mw ≥7.3) inter-event times (from Robinson et al. 2009, and in review). The distribution of Wellington Fault inter-event times that span both a Wairarapa Fault and Awatere Fault rupture (black bars) is shifted by a few hundred years to longer recurrence times compared to the distribution of interevent times that do not contain ruptures of these two faults (grey bars). Note, inter-event times >2000 years have all been plotted at 2000 years.
Sensitivity Study In order to show the sensitivity of these results to particular elements of the data, the conditional probabilities were also calculated for data sets with variations on those in Table 1, considering 30 different combinations of data inputs (A-R and a-l), as described in Table 2. The reasons for these variations have already been discussed above. The variations considered were: i) excluding Event V; ii) adjustments to the distributions for the time of occurrence of Events I and IV; iii) adjusting the coefficient of variation of single event displacements to the high-end value of 0.57 considered by Rhoades et al. (2004); iv) adjusting the elapsed time since the most recent event by 65 years in order to allow for the effect of the 1848 Awatere and 1855 Wairarapa fault ruptures on the expected time to the next rupture; and v) exploring the effect of elevated and reduced slip rates.
The estimation begins with a prior distribution for the value of the adjustable parameters in each recurrence-time distribution. For the exponential model, there is only one parameter: the mean. The other distributions considered each have two parameters: the mean and one other. The prior distribution of the mean is determined from the input distributions of the mean single-event displacement and the average slip rate. For the lognormal model, the second parameter is the coefficient of variation, for which the prior distribution is taken as uniform on the interval (0,1). For the Weibull distribution, the second parameter is a shape parameter c, which is such that if c > 1, the hazard increases (rather than decreases) as the elapsed time since the most recent rupture increases. The prior distribution for c is defined by taking 1/c to be distributed uniformly on the interval (0,1). For the Brownian passage-time model, the second parameter is a dispersion parameter called the aperiodicity, for which a generic value of 0.5 was suggested by Ellsworth et al. (1999). Values close to 0 correspond to regular, i.e. near periodic, recurrence. The prior distribution of the aperiodicity is taken as uniform on (0,1). A large sample of size n is drawn from the input data distributions of the mean single-event displacement, the average slip rate, and the times of past ruptures. We thus have n data samples, where a single sample comprises a set of values, one from each data input distribution. For each such data sample x, a sample of size m is drawn from the conditional distribution of the parameters θ of each recurrence-time distribution α, given x, and the probability density f (t | θ , x; α ) is evaluated. For each data sample, the probability density f (t | x ; α ) of the time from the last rupture to the next is calculated by mixing (i.e. averaging) the probability over the parameter samples, i.e.
f (t | x ; α ) =
1 m ∑ f (t | θ j , x;α ) . m j =1
(1)
83 Table 2. Input data variations considered in the sensitivity study Variation
Input data
A
As in Table 1
B
As for A, but excluding Event V
C
As for A, but with Triangular (170, 370, 370) for Event I
D
As for C, but excluding Event V
E
As for A, but with Trapezoidal (2560, 3010, 4287, 4900) for Event IV
F
As for F, but excluding Event V
G-L
As for A-F, respectively, but with CoV* adjusted to 0.57
M-R
As for A-F, resp., but with elapsed time reduced by 65 years
a-f
As for A-F, resp., but with reduced slip rate Normal (4.8, 0.74) mm/yr
g-l
As for A-F, resp., but with elevated slip rate Uniform (6.0, 7.6) mm/yr *CoV: Coefficient of variation of single-event displacement
Then for each recurrence-time model, the hazard function at time t since the last rupture is obtained by mixing (i.e. averaging) the hazard functions over the data sample.
h(t | α ) =
1 n ∑ h(t | xi ;α ) n i =1
(2)
Note that for a given cumulative distribution function F(t) and corresponding probability density f(t), the hazard function h(t), which has units of earthquakes per unit time, is given by
h(t ) =
f (t ) . 1 − F (t )
(3)
The conditional probability of an earthquake occurring in a time interval (t1, t2) of interest for a given model α is given by t2
P[ E(t1 ,t2 ) ] = exp[− ∫ h(t | α )dt ]
(4)
t1
An implication of the above method is that the final distribution of the mean recurrence interval is affected by the input data distributions of the times of past ruptures and the recurrence-time model, as well as its prior distribution. It follows that the final distribution can differ from the prior distribution of the mean recurrence interval determined from the input distributions for the single-event displacement and average slip rate, and can also differ between different recurrence-time models. Thus, even in the case of the exponential recurrence-time distribution, for which the hazard is in principle time-invariant, the mean recurrence interval will not coincide exactly with the estimate that would be obtained from a knowledge only of the distributions of the single-event displacement and average slip rate.
In this study we take n = 100, and m = 200. These values were found to be large enough to give stable results for all models, both for estimation of the hazard rate with the preferred input data distributions (Table 1) and for the sensitivity analysis (Table 2). RESULTS The estimated conditional probabilities of rupture under each of the four recurrence-time distributions are shown for time intervals of 1 year, 20 years, 50 years and 100 years in Table 3, using the data input values in Table 1. Also shown are the percentage changes from the previous study of Rhoades et al. (2004). The first thing to note from Table 3 is the similarity of the conditional probabilities under the four different recurrencetime models. Whether we adopt a time invariant hazard model (exponential recurrence-time distribution) or one of the three time-varying hazard models considered here, the probability of rupture for the next 100 years is about the same, allowing for uncertainties in data and parameters. Nevertheless, Figure 4 shows that the hazard rate under the exponential and Weibull models is almost static for the next 100 years, but that under the lognormal and Brownian passage-time models it is on an increasing trend. The second thing to note from Table 3 is the substantial reduction in the estimated conditional probabilities compared to those of Rhoades et al. (2004), ranging from a 41% reduction for the exponential model to about a 70% reduction for the lognormal model. The results of the sensitivity study are summarised in Figure 5, which shows the 100-year conditional probabilities for each of
Table 3. Estimated probability of rupture of the Wellington-Hutt Valley segment of the Wellington Fault during time intervals starting in AD 2010, allowing for uncertainties in data and parameters. Input data from Table 1. In brackets is shown the percentage change from the estimate of Rhoades et al. (2004). Recurrence-time distribution Exponential
Time interval 1 yr 0.0010 (-41%)
20 yr 0.020 (-41%)
50 yr 0.050 (-41%)
100 yr 0.10 (-41%)
Lognormal
0.0011 (-71%)
0.022 (-71%)
0.057 (-70%)
0.12 (-66%)
Weibull
0.0011 (-67%)
0.022 (-67%)
0.055 (-66%)
0.11 (-58%)
Brownian passage- time
0.0009 (-68%)
0.019 (-65%)
0.050 (-62%)
0.11 (-58%)
84 even then the probability is only 0.01 higher than that for the preferred data. The Brownian passage-time model is relatively insensitive to data variations, with individual 100-year conditional probabilities ranging between 0.075 and 0.15. For this distribution, there is more upward sensitivity of the results than for the lognormal and Weibull models. Increasing the coefficient of variation, excluding Event V, modifying the distribution of Event I and increasing the slip rate all tend to increase the probability. The highest value, 0.05 higher than that for the preferred data, is attained when all of these adjustments are made. CONCLUSION
Variation of hazard of rupture of the Wellington-Hutt Valley segment of the Wellington Fault with time, from AD 2010 to 2110, averaged over sampled data distributions, under the exponential, lognormal, Weibull and Brownian passagetime distributions. Data distributions as in Table 1.
the 30 input data variations. The variation that has the most consistent effect on the estimates across all recurrence-time distributions is changing the slip rate. As expected, increasing (decreasing) the slip rate consistently increases (decreases) the conditional probability of rupture, but the amount of the increase (decrease) depends on the recurrence-time distribution. The effect of adjusting the elapsed time to accommodate the “un-loading” effect of the 1848 Awatere and 1855 Wairarapa fault ruptures is also as expected: for all models other than exponential, the effect is to appreciably reduce the conditional probability. Favouring the older end of the age range of the most recent event (Event I) has a mostly predictable effect in that, for most data combinations, it increases the estimated probability of rupture under the lognormal, Weibull and Brownian passage-time models. The effect of excluding Event V is to increase the conditional probability in the case of the exponential and Brownian passage-time distributions, and to reduce it in other cases. It is clear that the exponential model probability is the least sensitive to the data variations considered, with individual 100-year probabilities ranging from 0.08 to 0.12. It is sensitive to the exclusion of Event V, the increase of the coefficient of variation of the average single-event displacement and changes to the slip rate. The lognormal model is the most sensitive to data variations, with individual 100-year conditional probabilities ranging between 0.04 and 0.15 and with more downwards than upwards sensitivity. Apart from increasing the slip rate, the only data variation that increases the hazard appreciably is when both the coefficient of variation is increased to 0.57 and a triangular distribution is adopted for Event I. In that case the conditional probability is 0.14, compared to 0.12 for the preferred data. The Weibull model is rather sensitive also, but again mainly in the downwards direction, with 100-year conditional probabilities ranging between 0.05 and 0.13. Apart from increasing the slip rate, the only data variation which appreciably increases the hazard is when the coefficient of variation and the distribution of Event I are both adjusted, and
The sensitivity results range from ~4% to 15% for the 100year conditional probability. The results are sensitive in a fairly predictable way to varying the average slip rate, reducing the elapsed time to allow for the “un-loading” effect Preferred dates Event 1 modified Event 4 modified Small symbols: Event V excluded
0.20
100yr probability of rupture
Figure 4:
Using the preferred data inputs, the estimated conditional probability of rupture of the Wellington-Hutt Valley segment of the Wellington Fault in the next 100 years is about 11%. This probability is hardly affected by the choice of recurrencetime distribution. The inclusion of the new IOF data on the size of past ruptures, the average Holocene slip rate, and the timing of the most recent ruptures have all contributed to an overall reduction in the estimated probability of rupture, by ~50% or more, compared to the pre-IOF estimates of Rhoades et al. (2004).
0.10
0.05
Exponential
Lognormal
Weibull
BPT
Recurrence time distribution
Figure 5:
Sensitivity study results: probability of rupture of Wellington-Hutt Valley segment of the Wellington Fault in the next 100 years from AD 2010, using data input variations as outlined in Table 2. BPT, Brownian passage-time. Colour codes are as follows: Black, preferred data (Table 1); Red, elapsed time reduced by 65 years to compensate for 1848 and 1855 earthquakes; Green, CoV of single event displacement = 0.57; Blue, reduced slip rate; Orange, elevated slip rate.
85 of the 1848 Awatere and 1855 Wairarapa fault ruptures on the Wellington-Hutt Valley segment, and favouring the older end of the age range of the most recent event. When Event V is excluded, there is greater variability in the results derived from the different recurrence-time distributions. ACKNOWLEDEMENTS This study is part of the “It’s Our Fault” project funded by the Earthquake Commission, Accident Compensation Corporation, Wellington City Council, Wellington Region Civil Defence Emergency Management Group, and Greater Wellington Regional Council. Brendon Bradley, Matt Gerstenberger, and Mark Quigley gave helpful reviews of the manuscript.
Conference, Oamaru, New Zealand. Geological Society of New Zealand Miscellaneous Publication 128A: 154. Ninis, D., Little, T., Van Dissen, R., Smith, E. (2010) “The Wellington Fault – Holocene displacement and slip rate at Emerald Hill, Wellington, New Zealand: Progress Report”. Victoria University of Wellington Research Report 28. Nishenko, S.P., Buland, R. (1987) “A generic recurrence interval distribution for earthquake forecasting”. Bulletin of the Seismological Society of America 77: 1382-1399.
REFERENCES
Pondard, N., Barnes, P.M. (2010) “Structure and paleoearthquake records of active submarine faults, Cook Strait, New Zealand: implications for fault interactions, stress loading, and seismic hazard”. Journal of Geophysical Research 115: B12320, doi:10.1029/2010JB 007781.
Barnes, P.M., Pondard, N., Lamarche, G., Mountjoy, J., Van Dissen, R., Litchfield, N. (2008) “It’s Our Fault: active faults and earthquake sources in Cook Strait”. NIWA Client Report WLG2008-56: 36 p.
Rhoades, D.A., Van Dissen, R.J., Dowrick, D.J. (1994) “On the handling of uncertainties in estimating the hazard of rupture on a fault segment”. Journal of Geophysical Research solid earth 99 (B7): 13701-13712.
Berryman, K.R. (1990) “Late Quaternary movement on the Wellington Fault in the Upper Hutt area, New Zealand”. New Zealand Journal of Geology and Geophysics 33: 257270.
Rhoades, D.A., Van Dissen, R.J. (2003) “Estimates of the time-varying hazard of rupture of the Alpine Fault, New Zealand, allowing for uncertainties”. New Zealand Journal of Geology and Geophysics 46: 479-488.
Ellsworth, W.L., Matthews, M.V., Nadeau, R.M., Nishenko, S.P., Reasenberg, P.A., Simpson, R.W. (1999) “A physically-based earthquake recurrence model for estimation of long-term earthquake probabilities”. U.S. Geological Survey Open-File Report 99-522: 22 p.
Rhoades, D.A., Stirling, M.W., Schweig, E.S., Van Dissen, R.J. (2004) “Time-varying earthquake hazard in the Wellington region”. Institute of Geological & Nuclear Sciences client report 2004/141: 46p.
Grapes, R. (1993) “Terrace correlation, dextral displacements, and slip rate along the Wellington Fault, North Island, New Zealand (letters to the editor)”. New Zealand Journal of Geology and Geophysics 36: 131-135. Hagiwara, Y. (1974) “Probability of earthquake occurrence as obtained from a Weibull distribution of crustal strain”. Tectonophysics 23: 313-318. Hecker, S., Abrahamson, N. (2002) “Characteristic fault rupture: implications for fault rupture hazard analysis”. paper presented at Pacific Earthquake Engineering Research Centre (PEER) Lifelines Research Meeting, June 24, 2002. Langridge, R.M., Van Dissen, R., Villamor, P., Little, T. (2009) “It’s Our Fault – Wellington Fault paleoearthquake investigations: final report”. GNS Science Consultancy Report 2008/344. Langridge, R., Van Dissen, R., Rhoades, D., Villamor, P., Little, T., Litchfield, N., Clark, K., Clark, D., (2011) “Five thousand years of surface ruptures on the Wellington fault: implications for recurrence and fault segmentation”. Bulletin of the Seismological Society of America 101 (5): in press. Little, T.A., Van Dissen, R., Rieser, U., Smith, E.G.C., Langridge, R. (2010) “Co-seismic strike-slip at a point during the last four earthquakes on the Wellington fault near Wellington, New Zealand”. Journal of Geophysical Research 115: B05403. doi:10.1029/2009JB006589. Matthews, M.V., Ellsworth, W.L., Reasenberg, P.A. (2002) “A Brownian model for recurrent earthquakes”. Bulletin of the Seismological Society of America 92: 2233-2250. Ninis, D., Little, T., Van Dissen, R., Smith, E. (2009) “The Wellington Fault – Holocene displacement and slip rate at Emerald Hill, Wellington”. in Barrell, D.J.A., Tullock, A.J. (eds). Programme and abstracts, Geosciences 09
Robinson, R. (2004) “Potential earthquake triggering in a complex fault network: the northern South Island, New Zealand”. Geophysical Journal International 159: 734748. Robinson, R., Benites, R. (1996) “Synthetic seismicity models for the Wellington region: implications for the temporal distribution of large earthquakes”. Journal of Geophysical Research 101: 27,833-27,844. Robinson, R., Van Dissen, R., Litchfield, N. (2009) “It’s Our Fault – synthetic seismicity of the Wellington region: final report”. GNS Science Consultancy Report 2009/192: 36 p. Robinson, R., Van Dissen, R., Litchfield, N. (in review) “Using synthetic seismicity to evaluate seismic hazard in the Wellington region, New Zealand”. Submitted to Geophysical Journal International. Stein, R.S., Barka, A.A., Dieterich, J.H. (1997) “Progressive failures on the North Anatolian Fault since 1939 by earthquake stress triggering”. Geophysical Journal International 128: 594-604. Van Dissen, R.J., Berryman, K.R., Pettinga, J.R., Hill, N.L. (1992) “Paleoseismicity of the Wellington-Hutt Valley segment of the Wellington Fault, North Island, New Zealand”. New Zealand Journal of Geology and Geophysics 35: 165-176. Van Dissen, R.J., Berryman, K.R. (1996) “Surface rupture earthquakes over the last c. 1000 years in the Wellington region, New Zealand, and implications for ground shaking hazard”. Journal of Geophysical Research 101 (B3): 5999-6019. Van Dissen, R., Berryman, K., King, A., Webb, T., Brackley, H., Barnes, P., Beavan, J., Benites, R., Barker, P., Carne, R., Cochran, U., Dellow, G., Fry, B., Hemphill-Haley, M., Francois-Holden, C., Lamarche, G., Langridge, R., Litchfield, N., Little, T., McVerry, G., Ninis, D., Palmer, N., Perrin, N., Pondard, N., Semmens, S., Stephenson, W.,
86 Robinson, R., Villamor, P., Wallace, L., Wilson, K. (2009) “It’s Our Fault: better defining the earthquake risk in Wellington - results to date & a look to the future”. in proceedings, New Zealand Society for Earthquake Engineering Technical Conference, Christchurch, New Zealand, 3-5 April, 2009. Paper No. 48: 8p. Van Dissen, R., Barnes, P., Beavan, J., Cousins, J., Dellow, G., Francois-Holden, C., Fry, B., Langridge, R., Litchfield, N., Little, T., McVerry, G., Ninis, D., Rhoades, D., Robinson, R., Saunders, W., Villamor, P., Wilson, K., Barker, P., Berryman, K., Benites, R., Brackley, H., Bradley, B., Carne, R., Cochran, U., Hemphill-Haley, M., King, A., Lamarche, G., Palmer, N., Perrin, N., Pondard, N., Rattenbury, M., Read, S., Semmens, S., Smith, E., Stephenson, W., Wallace, L., Webb, T., Zhao, J. (2010) “It’s Our Fault: better defining earthquake risk in Wellington”. in proceedings, 11th IAEG Congress, Auckland, New Zealand, 5-10 September, 2010. Paper No. in press: 8p. Wang, N., Rieser, U., Grapes, R. (2005) “Optical luminescence dating of Late Quaternary movement on the Wellington Fault, Upper Hutt area, New Zealand”. Luminescence and Electron Spin Resonance Dating, 2005 Conference, 25-29 July 2005, Cologne, Germany.