623
The British Psychological Society
British Journal of Health Psychology (2006), 11, 623–642 q 2006 The British Psychological Society
www.bpsjournals.co.uk
Mind the gap: : :in intelligence: Re-examining the relationship between inequality and health Satoshi Kanazawa* Interdisciplinary Institute of Management, London School of Economics and Political Science, UK Wilkinson contends that economic inequality reduces the health and life expectancy of the whole population but his argument does not make sense within its own evolutionary framework. Recent evolutionary psychological theory suggests that the human brain, adapted to the ancestral environment, has difficulty comprehending and dealing with entities and situations that did not exist in the ancestral environment and that general intelligence evolved as a domain-specific adaptation to solve evolutionarily novel problems. Since most dangers to health in the contemporary society are evolutionarily novel, it follows that more intelligent individuals are better able to recognize and deal with such dangers and live longer. Consistent with the theory, the macro-level analyses show that income inequality and economic development have no effect on life expectancy at birth, infant mortality and age-specific mortality net of average intelligence quotient (IQ) in 126 countries. They also show that an average IQ has a very large and significant effect on population health but not in the evolutionarily familiar sub-Saharan Africa. At the micro level, the General Social Survey data show that, while both income and intelligence have independent positive effects on self-reported health, intelligence has a stronger effect than income. The data collectively suggest that individuals in wealthier and more egalitarian societies live longer and stay healthier, not because they are wealthier or more egalitarian but because they are more intelligent.
In a series of articles and books, Richard G. Wilkinson argues that economic inequality reduces the health of the whole population and lowers its life expectancy (Marmot & Wilkinson, 1999; Wilkinson 1986, 1992, 2000, 2005). He claims that humans and other primates have an evolved physiological mechanism whereby their cortisol level goes up when they are under attack or in other dangerous situations. Heightened levels of cortisol and other stress hormones allow the individuals to deal with short-term emergencies by preparing them for the ‘fight or flight’ response. ‘When survival depends on alertness, reaction times and the ability to run fast, all the biological ’housekeeping’ functions such as tissue maintenance and repair, immunity, growth, digestion and reproductive process can be left until later’ (Wilkinson, 2000, p. 37).
* Correspondence should be addressed to Satoshi Kanazawa, Interdisciplinary Institute of Management, London School of Economics and Political Science, Houghton Street, London WC2A 2AE, UK (e-mail:
[email protected]). DOI:10.1348/135910705X69842
624 Satoshi Kanazawa The chemical signals from the hypothalamus (in the brain), relayed by the pituitary gland (just under the brain) cause the glands to release cortisol into the bloodstream. This is termed the ‘hypothalamic-pituitary-adrenal axis’ (HPA axis). Cortisol is a central stress hormone. To make energy available, it increases blood sugar (glucose) levels by counteracting the effects of insulin in order to release fatty acid from the body’s stores of fat. In the brain it increases vigilance, backing up the effects of adrenaline. In addition, the pituitary gland releases several other hormones during stress, including prolactin – which inhibits reproductive processes – and morphine-like pain-killers, some of which are also produced by the brain. Much of this makes obvious sense in an evolved adaptive strategy whereby short-term emergencies take priority (Wilkinson, 2000, p. 39).
This physiological process for ‘fight or flight’, however, has negative long-term health consequences. If the dangerous situation is prolonged, the continuously high levels of stress and anxiety damage health. ‘Serious consequences for health arise when anxiety and physiological arousal are sustained or recur frequently over weeks, months or years : : : . Because over-activation of the immune system leads to autoimmune diseases, in which the body’s defence mechanisms are triggered unnecessarily, the initial heightened immune response during short-term stress would be dangerous if prolonged’ (Wilkinson, 2000, pp. 40–41). Wilkinson then argues that occupying a low status in society is physiologically analogous to being in a constant, prolonged state of arousal and perpetually ready to fight or flee, with the same hormonal consequences. He contends that this is why there is a health gradient, whereby those who occupy a higher status within any society are healthier and live longer than those who occupy a lower status. At the same time, Wilkinson claims that the general level of health is lower and life expectancy is shorter in societies with greater inequality. His conclusion is succinctly captured on the cover of his book Mind the Gap: ‘Inequality kills. People die younger in countries with greater inequalities in income’. Lynch et al. (2004) provide a comprehensive review of recent studies on the ‘income inequality hypothesis’ from the epidemiological perspective. Wilkinson’s theory, however, does not make sense within its own evolutionary framework. Given that stress and anxiety lead to health problems and early death, and reduce reproductive success (due, for example, to exceedingly high levels of prolactin) with no apparent compensating benefits, any genetic mutation that allows its carrier not to experience stress in the face of permanently low status from which it cannot escape (the ‘Que sera sera’ gene?) will be selected. Chronic low status, being at the bottom of a social hierarchy for life, seems dramatically different from the acute emergency of imminent physical attack which cortisol and other stress hormones are designed to respond to. Any genotype which makes a distinction between short-term emergencies of physical attack and long-term chronic low status and responds differently, with a surge of cortisol, prolactin and other stress hormones to the former but not to the latter, will be favoured by natural selection over another genotype which does not make such a distinction and responds similarly to both. Since all primate societies are hierarchical and there are chronically high- and low-status individuals in them, suggesting that the origins of human social hierarchies go back at least 15–20 million years in evolutionary history, it appears that there should have been enough time for such a genetic mutation to emerge and spread. What is the ultimate function of stress and anxiety in the face of low status? If there is not one, why has natural selection not eliminated such stress and anxiety?
Mind the gap : : : in intelligence
625
The Savanna Principle Recent developments in evolutionary psychological theory suggest an entirely different determinant of health and life expectancy. The human brain, just like any other part of any other organism, is an evolved organ adapted to its environment of evolutionary adaptedness (EEA; Tooby & Cosmides, 1990). This fundamental observation of evolutionary psychology leads Kanazawa (2004a) to propose the Savanna Principle, which states that the human brain has difficulty comprehending and dealing with entities and situations that did not exist in the EEA, including virtually everything in modern society except for people and many social relationships (mateships, parenthood, kin relationships).1 Kanazawa uses the Savanna Principle to explain that some otherwise elegant scientific theories of human behaviour, such as microeconomic subjective expected utility maximization theory and game theory, often fail empirically because they posit entities and situations that did not exist in the EEA and thus are difficult for the human brain to fully comprehend. For example, he speculates that many players of one-shot Prisoner’s Dilemma games make the theoretically irrational choice to cooperate with their partner because the human brain has difficulty comprehending completely anonymous social exchange with absolutely no possibility of future interactions, situations that did not exist in the EEA but are logically crucial for the gametheoretic prediction of universal defection (Kanazawa, 2004a, pp. 44–45).
The evolution of general intelligence In an entirely different line of research, Kanazawa (2004b) advances an evolutionary psychological theory of the evolution of general intelligence. In contrast to views expressed by Cosmides and Tooby (2002) and Chiappe and MacDonald (2003), Kanazawa proposes that what is now known as general intelligence originally evolved as a domain-specific adaptation to deal with evolutionarily novel, non-recurrent problems. The human mind consists of numerous domain-specific adaptations to solve recurrent adaptive problems. In this sense, our ancestors did not really have to think in order to solve such recurrent problems. Evolution has already done all the thinking, so to speak, and equipped the human brain with the appropriate psychological mechanisms, which engender preferences, desires, cognitions, and emotions and motivate adaptive behaviour in the context of the ancestral environment. Even in the extreme continuity and constancy of the EEA, however, there were occasional evolutionarily novel and non-recurrent problems that, in order to be solved, required our ancestors to think and reason, deductively and inductively. To the extent these evolutionarily novel, non-recurrent problems happened frequent enough in the EEA (different problem each time) and had serious enough consequences for survival and reproduction, then any genetic mutation that allowed its carrier to think and reason would have been selected for, and what we now call ‘general intelligence’ could have evolved as a domain-specific adaptation for solving evolutionarily novel, non-recurrent problems. Kanazawa (2004b) suggests that general intelligence has only become universally important in modern life (Gottfredson, 1997; Herrnstein & Murray, 1994; Jensen, 1998) because our current environment is almost entirely evolutionarily novel. 1
Kanazawa’s (2004a) Savanna Principle about the evolutionary limitations and biases of the human brain is not to be confused with Orians’ (1980, 1986) habitat selection theory, sometimes known as the Savannah Hypothesis (Buss, 2004, pp. 88–90), about the innate human preference for savannah-like habitat.
626 Satoshi Kanazawa
Kanazawa (2004b) then derives and empirically supports a hypothesis that intelligent (high-g) individuals are only better than less intelligent (low-g) individuals at solving problems if the problems are evolutionary novel and that intelligent individuals are no better than less intelligent individuals at solving evolutionarily familiar problems, such as those in the domains of mating, parenting, interpersonal relationships and wayfinding. The logical conjunction of the Savanna Principle and the theory of the evolution of general intelligence suggests a qualification of the Savanna Principle. The human brain’s difficulty in dealing with and comprehending entities and situations that did not exist in the EEA should interact with general intelligence such that the Savanna Principle holds stronger among less intelligent individuals than among more intelligent individuals. High-g individuals should be better able to deal with and comprehend evolutionarily novel entities and situations than low-g individuals.
Evolutionary psychological perspective on health and longevity in the modern society Deary, Whiteman, Starr, Whalley, and Fox’s (2004) recent longitudinal analysis of the Scottish mental surveys of 1932 and 1947 reveals that childhood intelligence has a positive effect on longevity; more intelligent Scots live longer than less intelligent Scots. This and other similar findings prompt the intelligence researcher Linda S. Gottfredson (2004) to suggest that general intelligence might be the ‘fundamental cause’ of the health gradient that has long been known to epidemiologists. Since individuals in higher social classes tend to be more intelligent on average than those in lower social classes (Kanazawa & Kovar, 2004, pp. 232–234), a positive effect of intelligence on health and longevity will produce the health gradient where those in higher classes are healthier and live longer than those in lower classes. While there is emerging evidence that intelligence increases health and longevity, neither intelligence researchers nor epidemiologists seem to know why. Gottfredson and Deary (2004) thus ask in the title of their recent article, ‘Intelligence predicts health and longevity, but why?’ The Savanna Principle and its interaction with general intelligence discussed above can provide one answer. Most dangers to health today are evolutionarily novel. These include cigarettes, alcohol, junk food, sedentary life (which necessitates regular exercises), automobiles and guns. While our ancestors in the African savannah may have partaken in psychotropic drugs and intoxicating substances (since their use is known among contemporary hunter-gatherers), they certainly did not have anything nearly as potent and, as a result, as potentially dangerous as crack cocaine or vodka. The revised Savanna Principle would therefore predict that high-g individuals can better recognize such dangers to health, deal with them appropriately and so remain healthier and live longer. I thus predict that, in largely evolutionarily novel modern society, more intelligent individuals live longer than less intelligent individuals (as Deary et al. (2004) discovered). However, intelligence should not affect health and life expectancy in subSaharan Africa, the site of our ancestral environment, where, even today, life in tribal societies is less radically different from the ancestral environment than in the rest of the world. I will first test these two hypotheses with macro data from a large number of countries. I will then use micro data on individuals from the United States to attempt to replicate Deary et al.’s finding from Scotland on the positive effect of intelligence on health and longevity.
Mind the gap : : : in intelligence
627
Macrolevel analysis Data All the macro-level data comes from published sources. Data on male and female life expectancy at birth (in years) and on economic development (gross domestic product [GDP] per capita) was obtained from the United Nations (http://unstats.un.org/ unsd/demographic/products/socind/health.htm and http://unstats.un.org/unsd/ demographic/products/socind/inc-.eco.htm). Data on income inequality (Gini coefficient) was obtained from the World Bank (http://www.worldbank.org/data/wdi2004/ pdfs/table2-7.pdf). Data on national intelligence quotients (IQs; the mean IQ of a country’s population) was obtained from Lynn and Vanhanen’s data (2002). Lynn and Vanhanen compiled a comprehensive list of ‘national IQs’ of 185 nations in the world, either by calculating the mean scores from a large number of primary data or carefully estimating them from available sources. The Appendix presents all of the data used in the following macro-level analyses. The data will allow any interested readers to replicate all of the findings below. Results Table 1 shows that income inequality, measured by a Gini coefficient, has a strong and highly significantly negative effect on the life expectancy of men (column 1: b ¼ 20:4883, p , :0001) and women (column 4: b ¼ 20:4870, p , :0001). This bivariate analysis therefore confirms Wilkinson’s conclusion that income inequality reduces life expectancy. Table 1. The effects of income inequality, national IQ and economic development on life expectancy at birth (all nations) Male life expectancy at birth
Gini coefficient
1
2
3
4
5
6
2.5920**** (.0946) 2 0.4883
2.1332 (.0687) 2 0.1092 .8486**** (.0615) 0.7786
2.6726**** (.1079) 2 0.4870
2.1255 (.0723) 2 0.0903 1.0130**** (.0647) 0.8156
86.7792 (3.9230) .2385 127
25.0476 (7.1048) .7003 126
2.1245 (.0698) 2 0.1021 .8214**** (.0709) 0.7536 .0001 (.0001) 0.0479 23.4222 (7.4221) .7018 126
94.8556 (4.4731) .2372 127
214.7307 (7.4736) .7446 126
2.1258 (.0736) 2 0.0905 1.0138**** (.0748) 0.8163 2.0000 (.0001) 2 0.0013 214.7807 (7.8263) .7446 126
National IQ
GDP per capita
Constant R2 N
Female life expectancy at birth
Note. Main entries are unstandardized regression coefficients. Numbers in parentheses are standard errors. Numbers in italics are standardized regression coefficients (betas). *p , :05; **p , :01; ***p , :001; ****p , :0001.
It turns out, however, that his conclusion that ‘inequality kills’ may be premature because the significantly negative effect of income inequality on life expectancy may be spurious. Once national IQ is entered in the multiple regression equations (columns 2 and 5), income
628 Satoshi Kanazawa
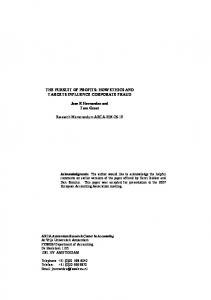
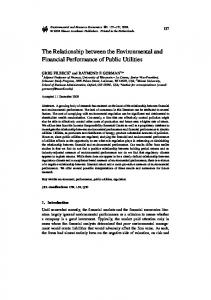
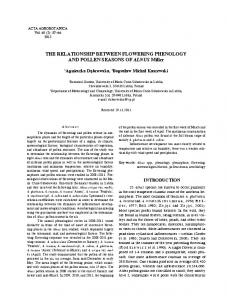
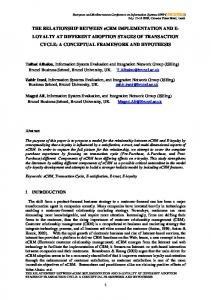
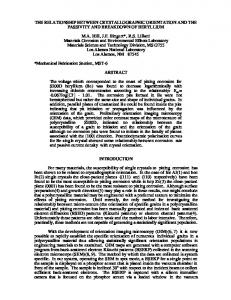
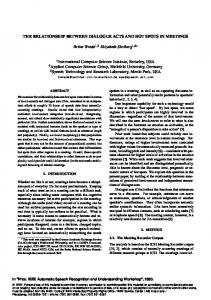
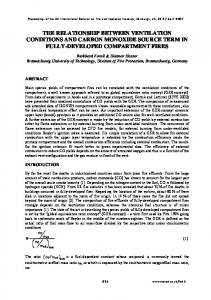
inequality ceases to have any significant effect on either male (b ¼ 20:1092, ns) or female (b ¼ 20:0903, ns) life expectancy. National IQ instead has a very large and strong effect on male (b ¼ 0:7786, p , :0001) and female (b ¼ 0:8156, p , :0001) life expectancy. A comparison of their standardized coefficients reveals that national IQ has seven to eight times as strong an effect on life expectancy as does income inequality (b ¼ 20:1092 vs. b ¼ 0:7786 for male life expectancy; b ¼ 20:0903 vs. b ¼ 0:8156 for female life expectancy). National IQ single-handedly explains about half of the variance in life expectancy across the 126 countries. Even though economic development is highly correlated with national IQ (Lynn & Vanhanen, 2002), national IQ is not a proxy for economic development in the present analysis. When entered with the Gini coefficient and national IQ (columns 3 and 6), GDP per capita has no effect at all on male or female life expectancy (b ¼ 0:0479, ns, for male life expectancy; b ¼ 20:0013, ns, for female life expectancy). Note that the unstandardized regression coefficient for national IQ in Equation 6 for female life expectancy is 1.0138. It means that each additional point in mean IQ of a population increases the female life expectancy at birth by more than a year! (The correspondent effect on male life expectancy is 8214.) Figures 1–3 show the partial relationship between male life expectancy, on the one hand, and income inequality (Figure 1), national IQ (Figure 2) and economic development (Figure 3) on the other, and Figures 4–6 show the same partial relationships with female life expectancy. Figures 1 and 4 show that, when national IQ and economic development are controlled, income inequality has no relationship with male or female life expectancy, contradicting Wilkinson’s argument. Similarly, Figures 3 and 6 show that when national IQ and income inequality are controlled, economic development has no effect on male or female life expectancy. In sharp contrast, even when income inequality and economic development are controlled, national IQ has a very strong partial relationship with male life expectancy (partial r ¼ :7236; Figure 2) and female life expectancy (partial r ¼ :7752; Figure 5). Table 2 presents the results from a limited sample of 29 sub-Saharan African countries.2 As before, in the bivariate regressions (columns 1 and 4), income inequality has a significantly negative effect on male (b ¼ 20:4946, p , :01) and female (b ¼ 20:4347, p , :05) life expectancy. However, unlike before, the inclusion of national IQ in multiple regression equations does not attenuate the negative effect of income inequality on life expectancy. In clear contrast to the analysis with all 126 nations, the result from the 29 sub-Saharan African nations shows that national IQ has no effect on either male (b ¼ 20:1854, ns) or female (b ¼ 20:1665, ns) life expectancy. The inclusion of economic development in the equations (columns 3 and 6) does not alter the picture at all. Additional analyses Limiting the sample to 81 countries for which national IQ was directly measured Lynn and Vanhanen’s (2002) data on national IQs for 185 countries, on which I rely heavily for the macro-level analyses presented above, are quite controversial, partly because Lynn and Vanhanen have direct measures of national IQ for less than half of these nations (81) 2 I exclude Madagascar from the subsample of sub-Saharan African nations because it is discontiguous with the rest of sub-Saharan Africa and I do not know if it was part of our ancestral environment. Including Madagascar in the subsample does not at all alter the results presented in Table 2, however.
Mind the gap : : : in intelligence
629
Residuals for male life expectancy at birth
30
20
10
0
–10
–20
–30 –20
–10
0
10
20
30
Residuals for Gini coefficient
Figure 1. Partial correlation between male life expectancy and income inequality.
Residuals for male life expectancy at birth
20
10
0
–10
–20
–30 –20
–10
0
10
20
30
Residuals for national IQ
Figure 2. Partial correlation between male life expectancy and national IQ.
and the national IQs of the rest of the nations are carefully estimated from information from the 81 nations. Lynn and Vanhanen (2002, pp. 71–73) explain how they estimate the national IQ of the additional 104 nations but critics have questioned some of the details of Lynn and Vanhanen’s estimation methods (Palairet, 2004). It is possible that their estimation is imprecise or even biased, although it is difficult to see how it could be biased simultaneously to bolster Lynn and Vanhanen’s claims about economic development and my claims about health and longevity. At any rate, in order to assess whether my results presented in Table 1 are in any way biased by Lynn and Vanhanen’s estimation procedure, I have rerun the analysis with the subsample of 81 nations for which Lynn and Vanhanen have direct measures of national IQ.
630 Satoshi Kanazawa
Residuals for male life expectancy at birth
30
20
10
0
–10
–20 –30 –20000
–10000
0
10000
20000 30000
40000
50000
Residuals for GDP per capita
Residuals for female life expectancy at birth
Figure 3. Partial correlation between male life expectancy and economic development. 30 20 10 0 –10 –20 –30 –20
–10
0
10
20
30
Residuals for Gini coefficient
Figure 4. Partial correlation between female life expectancy and income inequality.
Table 3 presents the results from this smaller subsample. Despite the much smaller number of cases (N ¼ 65 versus N ¼ 126), the findings are identical to those presented in Table 1 for the full sample. When entered alone, income inequality has a large and highly significant effect on male and female life expectancy at birth (b ¼ 20:5163, p , :0001 for male; b ¼ 20:4989, p , :0001 for female). However, as before, when national IQ is entered, it has an even larger effect on life expectancy at birth (b ¼ 0:7785, p , :0001 for male; b ¼ 0:8177, p , :0001 for female) and income inequality ceases to have a significant effect (b ¼ 20:1467, ns for male; b ¼ 20:1106, ns for female). Once again, as before, entering economic development does not change these findings; GDP per capita has absolutely no effect on life expectancy when entered with the Gini coefficient and national IQ (b ¼ 0:0597, ns for male; b ¼ 0:0027, ns for
Residuals for female life expectancy at birth
Mind the gap : : : in intelligence
631
30 20 10 0 –10 –20 –30 –40 –30
–20
–10
0
10
20
Residuals for national IQ
Residuals for female life expectancy at birth
Figure 5. Partial correlation between female life expectancy and national IQ. 30 20 10 0 –10 –20 –30 –20000 –10000
0
10000 20000 30000 40000 50000
Residuals for GDP per capita
Figure 6. Partial correlation between female life expectancy and economic development.
female). Even when income inequality and economic development are controlled, national IQ has a large and statistically significant effect on life expectancy (b ¼ 0:7469, p , :0001 for male; b ¼ 0:8163, p , :0001 for female). It therefore appears that, at least for the purpose of my substantive conclusions, Lynn and Vanhanen’s estimation of national IQs for 104 additional nations does not seem to introduce bias. There are only 11 sub-Saharan African nations for which national IQ was directly measured. Despite its extremely small sample size, regression analyses performed with these 11 nations replicate the results from Table 2 for the full sample of 29 sub-Saharan African nations. When income inequality and economic development are controlled, national IQ does not have any significant effect on male and female life expectancy while income inequality has a significant (p , :05) negative effect.
632 Satoshi Kanazawa Table 2. The effects of income inequality, national IQ and economic development on life expectancy at birth (sub-Saharan African nations)
Gini coefficient
Male life expectancy at birth
Female life expectancy at birth
1
2
3
4
5
6
2 .2877** (.0973) 2 0.4946
2 .2730** (.0978) 2 0.4693 2 .3594 (.3260) 2 0.1854
2 .2706* (.1079) 2 0.4347
2 .2564* (.1091) 2 0.4120 2 .3453 (.3635) 2 0.1665
56.4567 (4.7645) .2446 29
80.7380 (22.5321) .2784 29
2.3732** (.1104) 2 0.6416 2.5254 (.3281) 2 0.2710 .0023 (.0013) 0.3454 95.4676 (23.2840) .3466 29
57.5514 (5.2825) .1890 29
80.8815 (25.1264) .2161 29
2.3843** (.1207) 2 0.6175 2.5572 (.3589) 2 0.2686 .0030 (.0015) 0.4119 99.6784 (25.4714) .3275 29
National IQ
GDP per capita
Constant R2 N
Note. Main entries are unstandardized regression coefficients. Numbers in parentheses are standard errors. Numbers in italics are standardized regression coefficients (betas). *p , :05; **p , :01; ***p , :001; ****p , :0001. Table 3. The effects of income inequality, national IQ and economic development on life expectancy at birth (nations for which national IQ was directly measured, not estimated) Male life expectancy at birth
Gini coefficient
1
2
3
4
5
6
2.6181**** (.1292) 2 0.5163
2.1756 (.0888) 2 0.1467 .7805**** (.0743) 0.7785
2.6822**** (.1493) 2 0.4989
2.1513 (.0953) 2 0.1106 .9364**** (.0798) 0.8177
90.3660 (5.1143) .2666 65
3.2271 (8.8557) .7361 65
2.1570 (.0935) 2 0.1311 .7488**** (.0888) 0.7469 .0001 (.0001) 0.0597 4.7261 (9.1832) .7379 65
97.9652 (5.9120) .2489 65
26.5832 (9.5080) .7668 65
2.1503 (.1008) 2 0.1099 .9348**** (.0957) 0.8163 .0000 (.0001) 0.0027 26.5046 (9.8946) .7668 65
National IQ
GDP per capita
Constant R2 N
Female life expectancy at birth
Note. Main entries are unstandardized regression coefficients. Numbers in parentheses are standard errors. Numbers in italics are standardized regression coefficients (betas). *p , :05; **p , :01; ***p , :001; ****p , :0001.
Using total infant mortality rate Table 4 presents the analysis of the total infant mortality rate, which is the number of deaths among infants under one year of age per 1,000 live births. The data come from the same United Nations table as male and female life expectancy at birth
Mind the gap : : : in intelligence
633
(http://unstats.un.org/unsd/demographic/products/socind/health.htm). The empirical results for infant mortality are exactly the same as for life expectancy. When entered alone, income inequality has a significantly positive effect on the total infant mortality rate (b ¼ 0:4030, p , :0001); the more unequal the income distribution, the higher the infant morality rate. When national IQ is entered into the equation, however, it has a very strong and statistically significant negative effect (b ¼ 20:8372, p , :0001), while income inequality ceases to have any effect (b ¼ 20:0057, ns). This pattern does not change when economic development is entered into the equation; national IQ retains its strong and significant effect on infant mortality rate (b ¼ 20:8021, p , :0001), while neither income inequality nor economic development has any effect (b ¼ 20:0157, ns, for income inequality; b ¼ 20:0674, ns, for economic development). Table 4. The effects of income inequality, national IQ and economic development on total infant mortality rates (all nations) Total infant mortality rate
Gini coefficient
1
2
3
1.4430**** (.2931) 0.4030
2 .0206 (.2044) 2 0.0057 – 2 2.6946**** (.1827) 2 0.8372
217.4126 (12.1534) .1624 127
274.4925 (21.1217) .6963 126
2 .0566 (.2069) 2 0.0157 – 2 2.5816**** (.2104) 2 0.8021 2 .0002 (.0002) 2 0.0674 267.7401 (22.0136) .6992 126
National IQ
GDP per capita
Constant R2 N
Note. Main entries are unstandardized regression coefficients. Numbers in parentheses are standard errors. Numbers in italics are standardized regression coefficients (betas). *p , :05; **p , :01; ***p , :001; ****p , :0001.
The unstandardized regression coefficient of 2 2.5816 for national IQ in Equation 3 in Table 4 means that each additional point in the mean IQ of a population saves more than two and half infants from death per 1,000 live births! Of course, because infants under one cannot choose to avoid evolutionarily novel hazards to health, it is the parents’ and other adult caretakers’ general intelligence that matters for infant mortality. Using age-specific mortality rate Table 5 presents comparable results for age-specific mortality rates for males and females for age 15–19. The data on age-specific mortality rates are also available from the United Nations (http://unstats.un.org/unsd/demographic/products/dyb/DYB2002/ Table20.pdf), albeit for a somewhat smaller number of nations than life expectancy or infant mortality. I use information from the latest available year. I choose the 15–19
634 Satoshi Kanazawa Table 5. The effects of income inequality, national IQ and economic development on age-specific mortality rates (age 15–19) (all nations) Male age-specific mortality rate (15–9)
Gini coefficient
1
2
3
4
5
6
.04334** (.0132) 0.3704
.0049 (.0125) 0.0422 2.0810**** (.0136) 2 0.6389
.0411** (.0144) 0.3264
2.0041 (.0131) 2 0.0322 2.0952**** (.0142) 2 .6980
2.4863 (.4989) .1372 70
8.4540 (1.5485) .4376 70
.0057 (.0127) 0.0483 2.0849**** (.0156) 2 0.6689 .0000 (.0000) 0.0572 8.7271 (1.6491) .4398 70
2.8047 (.5461) .1066 70
9.7016 (1.6242) .4652 70
2.0020 (.0131) 2 0.0162 2.1059**** (.0162) 2 0.7765 .0000 (.0000) 0.1496 10.4693 (1.7091) .4799 70
National IQ
GDP per capita
Constant R2 N
Female age-specific mortality rate (15–19)
Note. Main entries are unstandardized regression coefficients. Numbers in parentheses are standard errors. Numbers in italics are standardized regression coefficients (betas). *p , :05; **p , :01; ***p , :001; ****p , :0001.
age group for two reasons. Firstly, humans in this age group are at or near the height of their health, no longer susceptible to congenital diseases and dangers associated with infant and childhood mortality and too young to be subject to the degenerative diseases of old age. Secondly, and more importantly, individuals in this age group begin to make their own decisions about what to eat (and, more importantly, what not to eat), how to behave and, in general, what to do for the first time in their lives. So late adolescence and early adulthood are when their own intelligence begins to impact on their health. Despite the fact that the age-specific mortality rate for individuals aged 15–19 is far less than perfectly correlated with life expectancy at birth (r ¼ 2:7741 between male life expectancy and male age-specific mortality; r ¼ 2:7840 between male life expectancy and female age-specific mortality; r ¼ 2:7720 between female life expectancy and male age-specific mortality and r ¼ 2:8081 between female life expectancy and female age-specific mortality), the results presented in Table 5 are once again identical in substantive terms to those in Table 1. When entered alone, income inequality has a significantly positive effect on male and female age-specific mortality rate (b ¼ 0:3704, p , :01, for male; b ¼ 0:3264, p , :01, for female). When national IQ is entered into the equation, however, it has a strong and significantly negative effect (b ¼ 20:6389, p , :0001, for male; b ¼ 20:6980, p , :0001, for female) while income inequality ceases to have any effect (b ¼ 0:0422, ns, for male; b ¼ 20:0322, ns, for female). This pattern remains the same when economic development is entered into the equation; national IQ retains its strong and significant effect (b ¼ 20:6689, p , :0001, for male; b ¼ 20:7765, p , :0001 for female) while neither income inequality nor economic development has any effect (income inequality: b ¼ 0:0483, ns, for male; b ¼ 20:0162, ns, for female; economic development: b ¼ 0:0572, ns, for male; b ¼ 0:1496, ns, for female). It therefore appears that my conclusion that national IQ
Mind the gap : : : in intelligence
635
largely determines the health of a population and that neither income inequality nor economic development has any partial effect on health is independent of a particular measure of population health.
Microlevel analysis Data The National Opinion Research Center at the University of Chicago has administered General Social Surveys (GSS) either annually or biennially since 1972. Personal interviews are conducted with a nationally representative sample of non-institutionalized adults in the US. The sample size is about 1,500 for each annual survey, and about 3,000 for each biennial one. The exact questions asked in each survey vary. Dependent variable In every survey, the GSS asks all or part of its respondents to rate their health with the question: ‘Would you say your own health, in general, is excellent, good, fair, or poor?’ The dependent variable is thus a four-category ordinal variable (1 ¼ poor, 2 ¼ fair, 3 ¼ good, 4 ¼ excellent). I will therefore use ordinal regression (McCullagh, 1980), rather than the OLS (Ordinary Least Squares), to estimate the effect of the independent variables on health. Independent variables Income The GSS measures the respondents’ annual earnings with 12–23 equidistant ordinal categories (1 ¼ less than $1,000, 2 ¼ between $1,000 and $2,999, 3 ¼ between $3,000 and $3,999 etc.). Even though it is technically not an interval-ratio variable, I treat it as such in my analysis because the categories are numerous and equidistant. Intelligence The GSS measures the verbal intelligence of its respondents by asking them to select a synonym for a word out of five possible answers. The questions are similar to those found in the verbal section of the Graduate Record Exams (GRE). Each respondent answers 10 of these questions and their total score thus varies from 0 to 10. I use the total number of correct responses as a crude measure of verbal intelligence in the following analysis.
Results Column 1 of Table 6 shows that, when entered alone, the respondents’ income has a very strong and highly significant positive effect on their health (b ¼ :0404, Wald ¼ 258.4814, p , :0001). However, Table 6, column 2 shows that, when entered together, the respondents’ intelligence (b ¼ :1086, Wald ¼ 129.3146, p , :0001) has nearly twice as strong an effect on health as income (b ¼ :0307, Wald ¼ 69.4245, p , :0001), even though the latter still remains significant. So, while income is a very strong determinant of individual health in the contemporary United States, consistent with Wilkinson’s thesis, verbal intelligence appears to be a much stronger determinant than income.
636 Satoshi Kanazawa Table 6. The effects of income and intelligence on individual health US general social surveys 1972–2002
Income
1
2
3
4
.0404**** (.0025)
.0307**** (.0037) .1086**** (.0096)
.0427**** (.0039) .1144**** (.0099) 2.0253**** (.0016) 2.1108** (.0408) 2.1492** (.0562) .2341**** (.0403)
23.4352 (.0562) 21.2192 (.0321) 1.0084 (.0314) .0134 19,190
2 3.0293 (.0968) 2.7461 (.0675) 1.5441 (.0688) .0246 9,615
23.8782 (.1152) 21.5660 (.0910) .7802 (.0894) .0534 9,606
.0253**** (.0043) .0521**** (.0113) 2 .0218**** (.0016) 2.0743 (.0412) 2.1601** (.0565) .2318**** (.0406) .0882**** (.0095) .0045* (.0018) 2 2.9590 (.1411) 2.6328 (.1228) 1.7366 (.1237) .0663 9,583
Intelligence Age Sex (1 ¼ male) Race (1 ¼ black) Marital status (1 ¼ currently married) Education Occupational prestige Threshold (Y ¼ 1) Threshold (Y ¼ 2) Threshold (Y ¼ 3) Pseudo R2 (Cox & Snell) N
Note. First entries in each cell are unstandardized regression coefficients. Numbers in parentheses are standard errors. *p , :05; **p , :01; ***p , :001; ****p , :0001.
This conclusion remains even after I enter demographic controls into the equation, such as age (in years), sex (1 ¼ male), race (1 ¼ black) and marital status (1 ¼ if currently married). The result in Table 6, column 3 shows that, even with these demographic controls, verbal intelligence (b ¼ :1144, Wald ¼ 133.6335, p , :0001) still has a stronger effect on health than income (b ¼ .0427, Wald ¼ 120.2008, p , :0001). Only age (b ¼ 2 .0253, Wald ¼ 268.4795, p , :0001) has a stronger effect on health than verbal intelligence in this equation. It is important to note that verbal intelligence in my analysis is not entirely a proxy for education or social status. Even when I enter education (in years of formal schooling) and social status (occupational prestige score) into the equation, verbal intelligence retains its strong and significantly positive effect on health (b ¼ :0521, Wald ¼ 21.4326, p , :0001), even though its effect is cut roughly in half. My analysis of the US General Social Surveys thus replicates Deary et al.’s (2004) analysis of the Scottish longitudinal data on the effect of intelligence on health and longevity. While income does exert a strong effect on health, intelligence again appears to have an even stronger effect, consistent with recent evolutionary psychological theory (Kanazawa, 2004a, 2004b).
Mind the gap : : : in intelligence
637
Discussion The macro-level analysis of 126 nations shows that neither income inequality nor economic development has a significant effect on the health of the population, contradicting both Wilkinson’s argument about the detrimental effect of inequality and commonly accepted beliefs about the benefit of economic development. In a multivariate analysis, neither the Gini coefficient nor the GDP per capita has any effect on male and female life expectancy, infant mortality rate or the age-specific mortality rate of males and females aged 15–19. In contrast, national IQ has a substantively very large and statistically highly significant effect on all measures of health and longevity. The macro-level data collectively suggest that individuals in wealthier and more egalitarian societies live longer and stay healthier not because they are wealthier or more egalitarian but because they are more intelligent. The micro-level analysis of the US general social survey data is consistent with this interpretation. While an individual’s income and verbal intelligence both have significant effects on self-reported health, verbal intelligence consistently has a stronger effect, even after controlling for relevant demographic variables. Controlling for education and social status attenuates but does not eliminate the independent effect of intelligence on health. The convergence of the Savanna Principle (Kanazawa, 2004a) and the evolutionary psychological theory of the evolution of general intelligence as a domain-specific adaptation (Kanazawa, 2004b) can explain these findings. Because most dangers to health in the current environment are evolutionarily novel, individuals with greater general intelligence are able to recognize and deal with them more appropriately than those with less general intelligence. Consistent with this explanation, national IQ does not have any significant effect in evolutionarily more familiar sub-Saharan Africa. This explanation can also account for other recent findings, such as that more intelligent Scots live longer than less intelligent Scots (Deary et al., 2004) and that obese men (though not obese women) have lower intelligence than their non-obese counterparts (Elias, Elias, Sullivan, Wolf, & D’Agostino, 2003). What other possible explanations can account for these findings? One suggestion from an anonymous reviewer is that IQ may be a consequence of income inequality. More egalitarian societies have more equal opportunities for education and schooling, thus raising the national IQ. Hence, in this view, national IQ is an inverse correlate of income inequality and, since income inequality is less precisely measured than IQ across societies, national IQ appears to have a significant effect on health and longevity, even though it is in fact income inequality which influences the population health. I discount this explanation for two reasons. First, the suggestion that greater educational opportunities can increase national IQ contradicts the current consensus among psychometricians and intelligence researchers that general intelligence is largely hereditary, with a large genetic component (Jensen, 1998, pp. 169–202). The current estimate of heritability among adults is roughly .80; in other words, 80% of variance in general intelligence is genetic in origin. Much of the remaining variance is due to environmental factors in early childhood and individual IQ is relatively stable after the age of about 10 (Jensen, 1998, pp. 316–318). So there appears little that education can do to significantly alter the general intelligence of a population. Secondly, and more importantly, this explanation fails to account for the fact that income inequality, but not national IQ, has a significant effect on male and female life expectancy among the subsample of 29 sub-Saharan African nations. If national IQ is a mere correlate of income
638 Satoshi Kanazawa
inequality and has a significant effect on population health simply because it is more precisely measured, how does one account for the fact that the empirical pattern is reversed among the 29 sub-Saharan African nations? The results presented in this paper are consistent with Kanazawa’s (2004b) theory of the evolution of general intelligence as a domain-specific adaptation to solve evolutionarily novel problems. However, only further research will show whether my explanation of national health and longevity in terms of the average intelligence of the population is correct. Additional studies and empirical tests are particularly necessary in light of the large number of studies which support Wilkinson’s income inequality hypotheses. Researchers will need to revisit the studies in support of the Wilkinson hypothesis to see if including the average IQ of a population can make the inequality effect disappear, as I have done in this paper.
Conclusion The results from the macro-level and micro-level analyses collectively cast some doubt on Wilkinson’s earlier conclusion that ‘Inequality kills. People die younger in countries with greater inequalities in income’. It appears that inequality does not kill and people do not die younger in countries with greater inequalities in income. The macro data from all nations show that, once national IQ is controlled, neither income inequality nor economic development has an independent effect on male and female life expectancy, infant mortality rate or age-specific mortality rate for individuals aged 15–19. Only national IQ has a very strong and significantly positive effect on these measures of population health. Consistent with the prediction from the Savanna Principle, national IQ has no effect on life expectancy among countries in the evolutionarily familiar subSaharan Africa. The micro data from the United States show that verbal intelligence has a stronger effect on health than income. These results point to the need for epidemiologists and health psychologists to pay closer attention to the role of general intelligence in health and longevity. General intelligence may be the key that allows individuals in evolutionarily novel contemporary society to recognize health risks and deal with them appropriately.
Acknowledgements I thank Rachel Dinkes for disagreeing with me, thereby motivating me to write this paper.
References Buss, D. M. (2004). Evolutionary psychology. The new science of the mind (2nd ed.). Boston, MA: Pearson. Chiappe, D., & MacDonald, K. (2003). The evolution of domain-general mechanisms in intelligence and learning. Long Beach, CA: Department of Psychology, California State University. Cosmides, L., & Tooby, J. (2002). Unravelling the enigma of human intelligence: Evolutionary psychology and the multimodular mind. In R. J. Sternberg & J. C. Kaufman (Eds.), The evolution of intelligence (pp. 145–198). Mahwah, NJ: Erlbaum. Deary, I. J., Whiteman, M. C., Starr, J. M., Whalley, L. J., & Fox, H. C. (2004). The impact of childhood intelligence on later life: Following up the Scottish Mental Surveys of 1932 and 1947. Journal of Personality and Social Psychology, 86, 130–147.
Mind the gap : : : in intelligence
639
Elias, M. F., Elias, P. K., Sullivan, L. M., Wolf, P. A., & D’Agostino, P. B. (2003). Lower cognitive function in the presence of obesity and hypertension: The Framingham Heart Study. International Journal of Obesity, 27, 260–268. Gottfredson, L. S. (1997). Why g matters: The complexity of everyday life. Intelligence, 24, 79–132. Gottfredson, L. S. (2004). Intelligence: Is it the epidemiologists’ elusive fundamental cause of social class inequalities in health? Journal of Personality and Social Psychology, 86, 174–199. Gottfredson, L. S., & Deary, I. J. (2004). Intelligence predicts health and longevity, but why? Current Directions in Psychological Science, 13, 1–4. Herrnstein, R. J., & Murray, C. (1994). The bell curve: Intelligence and class structure in American life. New York: Free Press. Jensen, A. R. (1998). The g factor: The science of mental ability. Westport, CT: Praeger. Kanazawa, S. (2004a). The Savanna Principle. Managerial and Decision Economics, 25, 41–54. Kanazawa, S. (2004b). General intelligence as a domain-specific adaptation. Psychological Review, 111, 512–523. Kanazawa, S., & Kovar, J. L. (2004). Why beautiful people are more intelligent. Intelligence, 32, 227–243. Lynch, J., Davey Smith, G., Harper, S., Hillemeier, M., Ross, N., Kaplan, G. A., & Wolfson, M. (2004). Is income inequality a determinant of population health? Part 1. A systematic review. Milbank Quarterly, 82, 5–99. Lynn, R., & Vanhanen, T. (2002). IQ and the wealth of nations. Westport, CT: Praeger. Marmot, M. & Wilkinson, R. G. (Eds.), (1999). Social determinants of health. Oxford: Oxford University Press. McCullagh, P. (1980). Regression models for ordinal data. Journal of the Royal Statistical Society, Series B, 42, 109–142. Orians, G. (1980). Habitat selection: General theory and application to human behavior. In J. S. Lockard (Ed.), The evolution of human social behaviour (pp. 49–66). Chicago, IL: Elsevier. Orians, G. (1986). An ecological and evolutionary approach to landscape aesthetics. In E. C. Penning-Rowsell & D. Lowenthal (Eds.), Landscape meaning and values (pp. 3–25). London: Allen and Unwin. Palairet, M. R. (2004). IQ and economic development: Review of IQ and the wealth of nations. Heredity, 92, 361–362. Tooby, J., & Cosmides, L. (1990). The past explains the present: Emotional adaptations and the structure of ancestral environments. Ethology and Sociobiology, 11, 375–424. Wilkinson, R. (2000). Mind the gap: Hierarchies, health and human evolution. London: Weidenfeld and Nicolson. Wilkinson, R. G. (1986). Income and mortality. In R. G. Wilkinson (Ed.), Class and health: Research and longitudinal data (pp. 88–114). London: Tavistock. Wilkinson, R. G. (1992). Income distribution and life expectancy. British Medical Journal, 304, 165–168. Wilkinson, R. G. (2005). The impact of inequality: How to make sick societies healthier. New York: New Press. Received 18 February 2005; revised version received 8 August 2005
640 Satoshi Kanazawa
Appendix Macro data 1
2
3
4
5
6
7
8
9
Albania* Algeria* Argentina Armenia* Australia Austria Azerbaijan * Bangladesh* Belarus* Belgium Bolivia* Bosnia and Herzegovina Botswana*† Brazil Bulgaria Burkina Faso*† Burundi*† Cambodia* Cameroon*† Canada Central African Republic*† Chile* China Colombia Costa Rica* Coˆte d’Ivoire*† Croatia Czech Republic Denmark Dominican Republic* Ecuador Egypt El Salvador* Estonia* Ethiopia† Finland France Gambia*† Georgia* Germany Ghana† Greece Guatemala Guinea† Guinea-Bissau*† Guyana*
28.2 35.3 52.5 37.9 35.2 30.0 36.5 31.8 30.4 25.0 44.4 26.2 63.0 59.1 31.9 48.2 33.3 40.4 44.6 33.1 61.3 57.1 44.7 57.6 46.5 45.2 29.0 25.4 24.7 47.4 43.7 34.4 53.2 37.2 30.0 26.9 32.7 38.0 36.9 28.3 30.0 35.4 48.3 40.3 47.0 43.2
90 84 96 93 98 102 87 81 96 100 85
1,915 2,049 3,375 905 26,525 31,187 853 385 1,768 29,257 878 1,613 3,983 2,700 2,533 294 86 278 803 27,097 325 4,523 1,100 1,744 4,189 886 6,398 8,834 39,497 2,408 2,108 1,062 2,302 6,232 91 31,069 29,222 224 770 29,137 354 15,690 1,963 424 208 1,010
70.9 68.1 70.6 69.0 76.4 75.4 68.7 61.0 64.9 75.7 61.8 71.3 38.9 64.0 67.4 45.2 40.4 55.2 45.1 76.7 38.5 73.0 68.9 69.2 75.8 40.8 70.3 72.1 74.2 64.4 68.3 66.7 67.7 66.5 44.6 74.4 75.2 52.7 69.5 75.2 56.5 75.7 63.0 48.8 43.8 60.1
76.7 71.3 77.7 75.6 82.0 81.5 75.5 61.8 75.3 81.9 66.0 76.7 40.5 72.6 74.6 46.2 41.4 59.5 47.4 81.9 40.6 79.0 73.3 75.3 80.6 41.2 78.1 78.7 79.1 69.2 73.5 71.0 73.7 76.8 46.3 81.5 82.8 55.5 77.9 81.2 59.3 80.9 68.9 49.5 46.9 66.3
25 44 20 17 6 5 29 64 11 4 56 14 57 38 15 93 107 73 88 5 100 12 37 26 10 101 8 6 5 36 41 41 26 9 100 4 5 81 18 5 58 6 41 102 120 51
– – 1.0 .7 .6 .7 .7 – 1.1 .6 – – 1.8 – .6 – – – – .7 – .7 – – .9 – .7 .6 .6 – – 1.0 1.5 1.4 – .7 .7 – .4 .6 – .7 1.7 – – –
– – .5 .2 .3 .3 .4 – .5 .3 – – 2.0 – .3 – – – – .3 – .3 – – .4 – .3 .3 .3 – – .7 .6 .3 – .3 .3 – .3 .3 – .3 1.0 – – –
72 87 93 67 70 89 70 97 68 93 100 89 91 71 90 97 98 84 80 83 84 97 63 97 98 65 93 102 71 92 79 66 66 84
Mind the gap : : : in intelligence
641
Appendix (Continued) 1 Honduras* Hong Kong Hungary India Indonesia Iran Ireland Israel Italy Jamaica Japan Jordan* Kazakhstan* Kenya† South Korea Kyrgyzstan* Laos* Latvia* Lesotho*† Lithuania* Luxembourg* Macedonia* Madagascar* Malawi*† Malaysia Mali*† Mauritania*† Mexico Moldova* Mongolia* Morocco Mozambique*† Namibia*† Nepal Netherlands New Zealand Nicaragua* Niger*† Nigeria† Norway Pakistan* Panama* Papua New Guinea* Paraguay* Peru Philippines Poland Portugal Romania
2
3
4
5
6
7
8
9
55.0 43.4 24.4 32.5 34.3 43.0 35.9 35.5 36.0 37.9 24.9 36.4 31.3 44.5 31.6 29.0 37.0 32.4 63.2 31.9 30.8 28.2 47.5 50.3 49.2 50.5 39.0 54.6 36.2 44.0 39.5 39.6 70.7 36.7 32.6 36.2 55.1 50.5 50.6 25.8 33.0 56.4 50.9 56.8 49.8 46.1 31.6 38.5 30.3
84 107 99 81 89 84 93 94 102 72 105 87 93 72 106 87 89 97 72 97 101 93 79 71 92 69 74 87 95 98 85 72 72 78 102 100 84 67 67 98 81 85 84 85 90 86 99 95 94
980 22,618 8,384 555 944 2,079 38,864 18,101 25,527 2,802 33,819 1,803 1,785 444 11,059 372 361 4,453 594 5,203 57,379 2,225 318 158 4,227 298 381 5,945 459 462 1,463 222 2,307 233 31,759 19,350 750 227 390 48,881 498 3,400 577 1,001 2,238 1,005 5,355 14,645 2,550
66.5 77.3 67.7 63.2 64.8 68.9 74.4 77.1 75.5 73.7 77.9 69.7 60.9 43.5 71.8 64.8 53.3 65.6 32.3 67.5 75.1 71.4 52.5 37.3 70.8 48.0 50.9 70.4 65.5 61.9 66.8 36.6 42.9 60.1 75.6 75.8 67.2 45.9 51.1 76.0 61.2 72.3 56.8 68.6 67.3 68.0 69.8 72.6 67
71.4 82.8 76.0 64.6 68.8 71.9 79.6 81.0 81.9 77.8 85.1 72.5 71.9 45.6 79.3 72.3 55.8 76.2 37.7 77.6 81.4 75.8 54.8 37.7 75.7 49.1 54.1 76.4 72.2 65.9 70.5 39.6 45.6 59.6 81.0 80.7 71.9 46.5 51.8 81.9 60.9 77.4 58.7 73.1 72.4 72.0 78.0 79.6 74.2
32 4 9 64 42 33 6 6 5 20 3 24 52 69 5 37 88 14 92 9 5 16 91 115 10 119 97 28 18 58 42 122 60 71 5 6 36 126 79 5 87 21 62 37 33 29 9 6 20
– .3 .5 – – – .7 .7 .7 – .4 – 1.6 – .5 .9 – .9 – 1.3 .9 .5 2.7 6.5 1.3 – – 1.0 .9 .9 – 6.8 – 1.1 .4 .9 – – – .6 1.5 – – – – 1.1 .7 .8 .7
– .2 .3 – – – .3 .3 .3 – .2 – .7 – .2 .5 – .5 – .4 .2 .3 3.0 6.6 .4 – – .4 .4 .4 – 6.8 – 1.0 .2 .4 – – – .3 1.3 – – – – .5 .3 .3 .3
642 Satoshi Kanazawa Appendix (Continued) 1 Russia Rwanda*† Senegal*† Sierra Leone† Singapore Slovakia Slovenia South Africa† Spain Sri Lanka* St. Lucia* Swaziland*† Sweden Switzerland Tajikistan* Tanzania† Thailand Trinidad and Tobago* Tunisia* Turkey Turkmenistan* Uganda† Ukraine* United Kingdom United States Uruguay Uzbekistan* Venezuela* Vietnam* Yemen* Zambia† Zimbabwe†
2
3
4
5
6
7
8
9
45.6 28.9 41.3 62.9 42.5 25.8 28.4 59.3 32.5 34.4 42.6 60.9 25.0 33.1 34.7 38.2 43.2 40.3 39.8 40.0 40.8 43.0 29.0 36.0 40.8 44.6 26.8 49.1 36.1 33.4 52.6 56.8
96 70 65 64 103 96 95 72 97 81 75 72 101 101 87 72 91 80 84 90 87 73 96 100 98 96 87 89 96 83 77 66
3,026 185 641 197 21,195 6,019 13,831 3,551 20,424 913 4,611 1,653 33,925 43,486 249 271 2,273 7,607 2,561 3,418 3,078 242 975 30,355 36,924 3,274 338 2,994 471 484 398 190
60.8 38.8 50.8 33.1 75.9 69.8 72.6 45.1 75.9 69.9 70.8 33.3 77.6 75.9 66.2 42.5 65.3 68.4 70.8 68 63.9 45.4 64.7 75.7 74.3 71.6 66.8 70.9 66.9 58.9 32.7 33.7
73.1 39.7 55.1 35.5 80.3 77.6 79.8 50.7 82.8 75.9 74.1 35.4 82.6 82.3 71.4 44.1 73.5 74.4 74.9 73.2 70.4 46.9 74.7 80.7 79.9 78.9 72.5 76.7 71.6 61.1 32.1 32.6
16 112 61 177 3 8 6 48 5 20 15 78 3 5 50 100 20 14 23 40 49 86 14 5 7 13 37 19 34 71 105 58
2.0 – – – .4 .6 .7 – .7 1.7 – 2.2 .4 .5 2.1 – – .8 – – – – 1.3 .6 .9 .9 .9 2.2 – – – –
.8 – – – .4 .3 .3 – .3 2.5 – 2.3 .3 .3 .8 – – .6 – – – – .5 .3 .4 .4 .5 .5 – – – –
1 Country, 2 Gini coefficient, 3 National IQ, 4 GDP per capita, 5 Male life expectancy at birth, 6 Female life expectancy at birth, 7 Total infant mortality rate, 8 Male age-specific mortality rate (15–19), 9 Female age-specific mortality rate (15–19). * National IQ estimated by Lynn and Vanhanen (2002). † Sub-Saharan African country.