2246
IEEE TRANSACTIONS ON POWER SYSTEMS, VOL. 26, NO. 4, NOVEMBER 2011
Reactive Power Planning Based on Fuzzy Clustering, Gray Code, and Simulated Annealing Yurong Wang, Student Member, IEEE, Fangxing Li, Senior Member, IEEE, Qiulan Wan, and Hao Chen
Abstract—Voltage stability constrained reactive power planning (RPP) or VAr planning is a very challenging issue in power systems. This paper proposes a new approach for modeling and solving VAr planning problem taking into account the static voltage stability constraint. First, the fuzzy clustering method is employed to select new candidate VAr source locations. Then, modified Gray code is proposed and used to represent a series of non-uniform VAr capacity intervals at different candidate buses. Under the new ordering of the VAr capacity intervals, a simplified piecewise linear function between the total transfer capability (TTC) and new VAr capacity is derived and applied as static voltage stability constraint in RPP. Finally, the RPP optimization model is solved by an enhanced simulated annealing (SA) algorithm taking advantage of the modified Gray code. In the SA algorithm, a modified definition of the neighborhood selection and a novel approach to generate new random solutions are proposed. In the case study, fuzzy clustering method, the modified Gray code, and the improved SA are applied to the IEEE 30-bus system. Test results conclude that the proposed method is a simplified and effective approach for voltage stability constrained VAr planning with contingency considered. Index Terms—Fuzzy clustering, Gray code, piecewise linear interpolation, reactive power planning (RPP), simulated annealing (SA), total transfer capability (TTC), voltage stability.
I. INTRODUCTION
I
NVESTIGATIONS on voltage stability are essentially related to reactive power. With sufficient reactive power compensation, particularly in the shunt connection, the voltage stability margin can be much increased to ensure system security [1]–[6]. Therefore, proper planning of reactive power is a critical task due to its technical difficulty and the economically high cost to relocate a shunt compensator once it is built. As one of the most challenging issues in power system research, reactive power planning (RPP), or VAr planning is a mixed integer nonlinear optimization problem with a large number of variables [7]–[9]. Recent studies show several particular interests in RPP [7], [10]. First, modeling of the RPP
Manuscript received August 05, 2010; revised December 03, 2010; accepted January 20, 2011. Date of publication February 28, 2011; date of current version October 21, 2011. Paper no. TPWRS-00636-2010. Y. Wang is with Southeast University, Nanjing, China, and was with The University of Tennessee, Knoxville, TN 37996 USA (e-mail: yurongwang@ieee. org). F. Li is with The University of Tennessee, Knoxville, TN 37996 USA (e-mail:
[email protected]). Q. Wan is with Southeast University, Nanjing, China (e-mail: qlwan@seu. edu.cn). H. Chen is with Nanjing Power Supply Company, Nanjing, China (e-mail:
[email protected]). Color versions of one or more of the figures in this paper are available online at http://ieeexplore.ieee.org. Digital Object Identifier 10.1109/TPWRS.2011.2109067
problem could be formulated with different objective functions such as cost-based objectives [11], [12] considering comprehensive system operation conditions during the planning years. Objectives can be variable and fixed VAr installation cost, real power loss cost, and/or fuel cost. Other possible objectives may be minimizing the deviation from a given voltage schedule or maximizing the voltage stability margin [13]. Multi-objective models are also widely used as the goal of RPP formulation [14], [15]. Furthermore, constraints also play an important role in making the RPP model practical. Conventional constraints include the thermal, voltage magnitude, and power flow limits under the base case and a set of credible contingency cases. In recent years, static voltage stability has raised multiple concerns [16], [17]. It is well known that the difficulty herein is the requirement of two sets of variables and constraints corresponding to normal state and the state of the nose point. The requirement of two sets of variables presents a great challenge, especially for a bulk system with many contingency cases, due to the difficulty in solving such optimization models. It is still desirable, however, to develop novel model simplification approaches for voltage stability constrained RPP. Another critical issue in RPP model simplification is the selection of candidate locations for new shunt VAr devices. Traditionally, the locations for placing new VAr sources are either simply estimated or directly assumed by engineering judgment. In general, there are two approaches to examine the site selection of new VAr devices. One is to implement the mixed integer nonlinear programming (MINLP) algorithms which can offer both new VAr capacities and their locations in the optimal results, but this method demands a large computational model which is time consuming and difficult to solve. The other solution is to reduce the candidate VAr sites by preprocessing before the optimization-based reactive power optimization is performed. For example, sensitivity index, modal analysis, weak-bus oriented criterion, VCPI index [2], singular value decomposition method [18], L index [19], index [25], index, voltage stability margin, and QV analysis [20] have been proposed as sound approaches to reduce the candidate VAr sites to a manageable size. For a realistic system with a large number of buses, it is usually preferable to first choose a set of candidate locations to reduce the complexity of RPP. The remainder of this paper is organized as follows. Section II presents the optimization model of RPP considering the voltage stability constraint, which is also an optimization problem. Section III proposes the fuzzy clustering method to examine the candidate sites for new VAr devices. Section IV attempts to apply the modified Gray code to provide a new ordering approach of the VAr capacity interval combinations so that
0885-8950/$26.00 © 2011 IEEE
WANG et al.: REACTIVE POWER PLANNING BASED ON FUZZY CLUSTERING, GRAY CODE, AND SIMULATED ANNEALING
2247
it works well with the piecewise linear function. Section V proposes to apply an enhanced simulated annealing (SA) algorithm as solutions to RPP. Section VI presents a case study based on the IEEE 30-bus system. Section VII concludes the discussion.
can be considered such as minimization of generation cost and VAr installation cost, minimization of voltage magnitude deviation from a specified value, etc. [7]. Nevertheless, this does not change the focal point of this research, and different objective functions can be applied if necessary for a specific system.
II. MODELING OF REACTIVE POWER PLANNING WITH VOLTAGE STABILITY CONSTRAINT
B. TTC Optimization Model Used for Static Voltage Stability Constraint in VAr Planning
A. VAr Planning Model VAr planning is carried out taking into account practical operational constraints at different load levels. With the consideration of the voltage stability constraints, the formulation of optimization-based RPP model can be written as follows: (1)
(2)
The above VAr planning model is static voltage stability constrained OPF model. The major reason for the computational challenge of the voltage stability constrained OPF model is the requirement of two sets of variables and constraints corresponding to the normal operation and collapse points [16]. The two sets of variables present a challenge to solve the optimization model, especially for a large system with multiple contingencies. To address this challenge, total transfer capability (TTC) can be applied to approximately present the static voltage stability constraint [16], [17]. At a fixed VAr compensation scheme with the consideration of a number of predefined credible contingencies, the security constrained TTC optimization model is written as follows:
(3)
(11)
(12)
(4) (5) (6) (7)
(13)
(8) (9) (14)
(10) where , is the set of generators; is the set of buses; is the is the number of VAr devices number of different load levels; to be installed; subscript indicates different load levels ; is the duration of load level each year; is the energy cost per kWh; is the calculated average annual allocation and maintenance cost, is a binary variable ( " if the VAr device is installed at bus , otherwise, “0”); and are the generator active and reactive power outputs at and are the load active generator bus , respectively; and reactive power demands at load bus , respectively; is at load level ; if not zero, lies in a the line flow of line specified VAr capacity interval at bus , is the VAr capacity is the final size of VAr at bus ; required at load level , and is the total active power flow through the tie lines from the source area to sink area; is a piecewise linear interpolation function used as static voltage stability constraint is the set of which will be explained later in this paper, and at all candidate buses. The objective in (1) minimizes the annual cost of system real power losses plus VAr device cost. However, other objectives
(15) (16) (17) (18) (19) and are the base case real and reactive power where is the base case power demands at load bus , respectively; ; and is the line flow of line , with Var flow of line , reprecompensation. Here, the superscript sents different states of operation with indicating the state indicating the post-contingency of normal operation, and states for the th contingency event. C. Coupling of Two Optimization Models As a result, the voltage stability constrained RPP is a complicated problem with two coupled mixed integer nonlinear optimization models. Apparently, no explicit expression exists between TTC and the new VAr capacities
2248
IEEE TRANSACTIONS ON POWER SYSTEMS, VOL. 26, NO. 4, NOVEMBER 2011
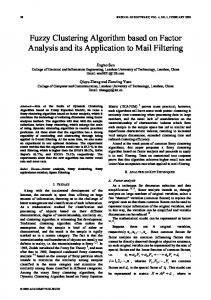
Fig. 1. Enumerative calculation with two coupled optimization models.
at the candidate buses. As an illustration, one way to deal with this problem is to perform an enumerative calculation. VAr capacities at all candidate buses can be enumerated with a small capacity change for discretization. Hence, as shown in Fig. 1, for each VAr capacity combination, TTC is calculated and then applied to (10) as a constant to solve the RPP optimization issue. Obviously, this is an inefficient and time-consuming approach. Reference [16] used a linear/quadratic ordinary least-square multivariate regression model to statistically approximate the locus of TTC such that a simple model with a lower computational complexity can be obtained. However, this method may function cannot be exlose control of the error if the pressed as a linear or quadratic model within a large range. Reference [17] proposed a piecewise interpolation method where is a polynomial function of the bus reactive compensation. The piecewise function is given by
(20) where , are the VAr capacities within a specified interval and is the polynomial function for TTC and VAr size. The piecewise interpolation method can preserve continuity at the boundary points and ensure an error within an acceptable level. However, if the studied power system has a very large scale and the number of candidate VAr compensation buses increases, both of these methods will end up evaluating a huge number of coefficients. It is still necessary to explore a more funcfeasible and simplified method to model the tion in combination with RPP. D. Outline of the Proposed Method As previously discussed, the complexity of the two coupled optimization models presents great challenges to RPP. Model simplification is highly desirable. The proposed approach handles this problem using three steps. • First, to reduce candidate locations for the new VAr devices to a manageable size as preprocessing, the fuzzy clustering method is employed to differentiate the weakest group of buses from the other buses. is simplified. A • Second, the formulation of piecewise linear interpolation method is employed to enwhile sure a reasonable degree of precision for preserving boundary continuity. Under the piecewise method, the VAr capacity at each bus is divided into a number of intervals. At each bus, the number of intervals may be different. A modified Gray code is proposed to provide a new ordering approach for the VAr interval combinations, which can finally help convert the mulfunction to a much tidimensional piecewise
more simplified one-dimensional function. The function from the modified Gray code is much smoother than that obtained with regular -ary coding. • Third, with the modified Gray code and the function used in the simplified model, an enhanced SA algorithm is applied to solve RPP. The SA algorithm improvement lies in a new neighborhood selection approach to ensure that the new random solution is within the boundary constraint without generating infeasible solutions. Further, by exploring the fat-tail characteristics of the t distribution, the degrees of freedom are well integrated with the annealing temperatures in order to control search area at different temperatures. III. FUZZY CLUSTERING FOR SELECTING CANDIDATE VAR LOCATIONS Pre-selection of candidate locations for new VAr devices can considerably reduce the searching space and the computational time for RPP. Usually, the candidate locations are weak buses which create the voltage stability bottlenecks. Multiple technical indices and criteria are proposed in the literature to address weak buses, as reviewed in Section I. Usually, it is considered a reasonably good practice to combine two or more of these indices, since any one specific index may not be persuasive under complicated circumstances. However, an unaddressed challenge is how many candidate buses should be considered for compensation in a specific power system. That is, there is no clear guideline about where to make the “cutoff” line of the index values. With this as a motivation, this paper proposes to use the clustering method [21]–[24] to provide candidate locations. In a classic cluster analysis, data are divided into different groups (clusters) such that similar data items are put into the same cluster. However, in power system applications, it is very common that there is no sharp boundary between clusters. Since the distinction between clusters may not be clear or straightforward, it is reasonable to combine fuzzy theory with cluster analysis, which leads to the development of the fuzzy clustering method [23]. A. Indices Used in Fuzzy Clustering Algorithm To site the candidate VAr locations, the indices related to voltage stability should be selected properly. Also, it is necessary to use the indices which can provide information at every load bus. In this paper, three indices containing voltage and voltages stability related information of each bus are utilized to form the index dataset matrix for fuzzy clustering. They are index, index, and a voltage fluctuation index. Index: The index, as shown in (21), is uti1) lized to provide the weak bus related information of the studied system. Here, the vector represents the base case voltage magrepresents the voltage magnitude nitude at each bus, while with all loads set to 0 for the studied system. A small ratio in the indicates a corresponding weak bus: vector (21)
WANG et al.: REACTIVE POWER PLANNING BASED ON FUZZY CLUSTERING, GRAY CODE, AND SIMULATED ANNEALING
2249
2) Index: For each load bus , the voltage stability related index [24], [25] is formulated as (26) (22) The elements of matrix where is the set of all generator buses, and are the voltage angle and magnitude at PV (PQ) buses, respec, is from ; and tively; is derived from the -Bus matrix where can be expressed as (23) can be simply interpreted as the ratio of the equivalent generator bus voltage and the load bus voltage [25]. For PV buses, . At the ideal stability limit, . Hence, , indicates a weaker bus. and a larger 3) Voltage Fluctuation Index: Assume that is the voltage magnitude at the base case and is the voltage magnitude when TTC is obtained without violating the voltage stability limit. Here, an optimization model similar to the TTC optimization in (11)–(19), but without VAr compensation, is applied to identify the possible lowest voltages at the nose point of the P-V curve for voltage stability. Equation (24) is proposed as the voltage fluctuation index in this work and used in fuzzy clustering. Here, a larger ratio indicates a weaker bus:
(24)
B. Implementation of the Fuzzy Clustering Method for Selecting New VAr Source Locations Based on the selected indices, the fuzzy clustering method can be applied prospectively. Generally, with the assumption that there are buses (items) and indices (factors), the dataset matrix can be formed as , where is the th index, , ; and is the initial value of the th index for bus . Consequently, fuzzy clustering method is carried out based on the following routine. 1) Standardization of Initial Data: The initial indices possess different ranges and dimensions. Hence, it is necessary to standardize the initial data to eliminate the impact from their different dimensions such that all initial data can be distributed in the same range with the same dimensions. Generally, data are compacted in the closed interval [0, 1]. The mean and standard deviation (S.D.) of the th index are given in (25) and (26), respectively:
is replaced by (27)
Furthermore, to guarantee that all elements in the dataset matrix are within the closed interval [0, 1], (28) or (29) can be employed to obtain the standardized value (28) (29) is the maximum value of the th index (factor) in where ; is the minimum value of the th index; and is satisfying . When the the standardized value of index has a positive relationship with the sample, (28) is used for the standardized value calculation; otherwise, (29) is used. As a result, the dataset matrix can be derived and consist of standardized elements. within [0, 1] and Since (28) and (29) ensure every without any all follow-up steps in the next sections take weights, fuzzy clustering does not need explicit weighting factors by this standardization. 2) Formation of the Fuzzy Similarity Matrix and Fuzzy Equivalent Matrix: Based on the standardized matrix , to reflect fuzzy relationship among the indices, the similarity between buses and can be calculated to form the degree new fuzzy similarity matrix . The following formula shows the similarity between buses and : (30) where , and . is Consequently, the fuzzy similarity matrix cannot be used for dynamic derived. However, the matrix fuzzy clustering since it may only meet the properties of reflexivity and symmetry without transitivity. is To further satisfy transitivity, the transitive closure calculated using the quadratic method. In the compound opera, when is satistion process fied, is called the fuzzy equivalent matrix possessing reflexivity, symmetry, and transitivity. For a square matrix , the definition of the quadratic method is (31)
(25)
is readily Consequently, the fuzzy equivalent matrix provided to conduct dynamic fuzzy clustering process.
2250
IEEE TRANSACTIONS ON POWER SYSTEMS, VOL. 26, NO. 4, NOVEMBER 2011
3) Dynamic Fuzzy Clustering Analysis: Regarding an acceptable level of classification, is used as the threshold and a -cut matrix can be obtained to provide the results of the fuzzy clustering. , elements Specifically, in the symmetrical square matrix greater than are set to 1; otherwise, 0. Then, the derived matrix is called -cut matrix. For each row in the upper triangular of the symmetrical -cut matrix, elements with value 1 are selected to form a cluster. Gradually, increases from a small number, such as 0.1, to 1 by implementing the dynamic fuzzy theory. A smaller corresponds to fewer clusters. In particular, if is 0, all buses are classified into the same cluster. Finally, the cutting line of should be determined to provide the classification results of the entire system. F test is used to offer a statistical support to the clustering results. 4) F Test of Clustering: To evaluate the rationality of classification, the test of the validity of can be carried out using fuzzy statistics given by
(32)
where is the number of the th classified objects; is the number of clusters; , ; , ; , and , . In (32), is the fuzzy statistics following F-distribution with the degrees of freedom . value means a greater difference between the A greater different clusters, indicating a satisfactory classification. So far, a reasonable fuzzy clustering result can be derived for selecting candidate locations for VAr installation. VAr size optimization at the candidate buses considering static voltage stability constraint is conducted next. IV.
FUNCTION FORMULATION USING A NEW ORDERING SCHEME: MODIFIED GRAY CODE
function is used as voltage stability constraint in RPP model in (10). In this section, a new ordering scheme based on the proposed modified Gray code is presented to build the function. A. Segmentation of VAr Capacity First, to find the approximate upper limit of the VAr capacity at each candidate bus, is obtained by optimizing with only one new VAr device compensated in the system, respectively. The piecewise approach is used to ensure that the simplifunction meets a reasonable degree of accuracy. fied By using the piecewise method, VAr capacities at all candidate buses are divided and discretized into several intervals. Consequently, the VAr capacity intervals at different buses form a series of interval combinations.
Assume that there are candidate new VAr locations and the equal interpredefined VAr capacity limit is divided into ), then a -bit series vals (i.e., the step size can be formed to represent the discrete capacity of the new VAr devices, with each digit indicating a VAr capacity interval at a specific candidate location. The corresponding digits of the two adjacent numbers can be used for developing the piecewise falls. For example, assume that there capacity interval where candidate VAr devices, , with each diare intervals, which are , , vided into , , and . To further discretize the capacity intervals, it is necessary to model the boundary points of these five intervals. That is, we may indicate that n=0 , represents the point represents the point , and so on, until represents the point . Therefore, the three-digit discretized VAr capacity series is shown as: . The above sequence is a traditional coding approach like an -ary sequence, where . The challenge here is that occasionally there is a sharp change at a digit between two adjacent numbers. If we consider two adjacent codes, e.g., 005 and 010, with the same size for all intervals, then they represent the cases and , respectively. Apparently, does not change during these by two numbers; while there are significant changes in and by . Therefore, although numerically 010 is only a slight, minimum change from 005 in the Senary system (i.e., 6-ary), this represents large and steep jumps in terms of the and capacities. Obviously, this is undesirable and contradicfunction piecetory with the original goal to make wise linear, because the changes can be too dramatic. B. Implementation of Modified Gray Code The Gray code technique [26], [27] is applied prospectively to provide a novel ordering method for the discrete VAr capacity intervals. Based on Gray code, the new sequence is re-ordered as: . With the help of the -ary Gray code, the series is designed with a change of, at most, one step size at only one digit between any two adjacent numbers. That is, only one VAr device has a step size capacity change between any two adjacent values. Consequently, the new ordering scheme makes the piecewise linear approximation more accurate since the overall will be smoother and less “jumpy”. With only one VAr device having a small capacity change in two adjacent numbers, the function can be formed with only one variable, and function Gray code assists in reducing the piecewise from multidimensional to one-dimensional. This helps to further simplify the voltage stability constraint. -Gray code represents the -digit seGenerally, the . The sequence has ries with each digit varies from 0 to points. However, it is usually the case that the maximum VAr capacity limit at different candidate buses cannot may be be the same, leading to the result that the step size . To address this, a quite different since modified Gray code is proposed next.
WANG et al.: REACTIVE POWER PLANNING BASED ON FUZZY CLUSTERING, GRAY CODE, AND SIMULATED ANNEALING
2251
these points is given next. Specifically, creation of new random solutions is improved in this work.
TABLE I THE (3,2,4; 3)-MODIFIED GRAY CODE
A. Improved Generation of New Random Solutions A popular way to generate new random solutions originally proposed in [29], called very fast simulated annealing, can be written as (34) (35) For
new candidate VAr locations with divided into equal intervals, processing the same step size , the new modified Gray code, which is called -modified Gray code, can effectively present flexible VAr interval combinations. For example, the , , , and modified Gray code with is shown in Table I. C. Formulation of the Linear
Function
With the VAr capacity divided into discretized intervals and the advantage of modified Gray code, we can formulate the piecewise linear function. If two successive numbers in the modified Gray code differ in digit, it indicates that the th VAr device has a capacity the change among a specific VAr capacity interval . and obtained by applying With (11)–(19), the piecewise linear interpolation function is (33) where , are interpolation coefficients and is the capacity of the th VAr device. The linear function can also preserve continuity at the boundary points. function in Consequently, the proposed simplified (33) can be applied to (10) in the RPP model. V. SIMULATED ANNEALING ALGORITHM APPLIED TO THE PROPOSED APPROACH The curve, based on the modified Gray code, is smoother than the one based on the conventional N-ary coding. With the VAr capacity of the new compensators divided into multiple intervals for discretization, simulated annealing (SA) [28], [29] is used to provide solutions to the proposed model. The idea of SA is derived from the principles of statistical thermodynamics. SA is an approach simulating the process of annealing for optimization. It takes the objective function value as the energy level corresponding to a given state, and the candidates in search space are treated as the possible states at an equilibrium temperature. The temperature is a control parameter in the process. In the annealing process, the neighborhood search space narrows down. SA is implemented as a powerful general-purpose technique converges asymptotically to the global optimum. Since annealing schedules, creation of new random solutions, and acceptance criteria are three key points in SA, discussion on
where
is a random value following the uniform distribution, are one of the variables of the current and new random . solutions at , with a constraint of may violate the boundary constraint; therefore, However, it is adjusted by simply truncating the violation. So, all those infeasible solutions become boundary solutions. Consequently, there are multiple boundary candidate solutions during each cycle of the new solution-generating process. In this subsection, a new generation method of new random solutions is proposed. As an improvement to the previous work, a new selection rule of neighborhoods at each temperature is proposed as follows:
(36) is the mathematical expectation of under its spewhere satisfies the boundary constraint cific distribution. With (36), without the need of truncation. Specifically, a t distribution is employed for the generation of the random value in (36), which is well known for its fat-tail characteristics and flexible adjustment of degrees of freedom. Its probability density function is given by (37) where is the degrees of freedom, , and is the Gamma function. The smaller the , the fatter the thickness of tail will be. Here, is further related to the annealing temperature in the SA algorithm. Assume the number of inner loops at a specific temperature is . Based on the t distribution with a specific degree of freedom , random values can be generated. Then, the sequence is transformed into the range of [ 1, 1] by (38) where is used in the th cycle’s generation of in the inner . loop at a specific temperature, When the degree of freedom is smaller, the tail is fatter, and the t-distribution can generate relatively larger range of random , the values after standardizavalues . Divided by tion are distributed closer to 0. Otherwise, the values are distributed more uniformly within [ 1,1]. Fig. 2 shows the distribution of under different . The characteristics shown in Fig. 2 provide ties between degrees in of freedom in the t distribution and the temperature
2252
IEEE TRANSACTIONS ON POWER SYSTEMS, VOL. 26, NO. 4, NOVEMBER 2011
Fig. 2. Distribution of y values with different t distributions.
the SA. When the temperature is higher, a greater degree of freedom can generate a more dispersed such that new random solutions have a larger range of neighborhood for selection. On the opposite, when the temperature drops, smaller degrees of freedom can be used to narrow the search space. While the annealing temperature varies from the highest value to the lowest , changes from to . By using variable substitution in the t-distribution, in (37) is replaced by using the following transformation: (39) As a result, at different temperatures, new random solutions can be generated with different ranges of neighborhood. B. Acceptance Criterion At temperature , if the objective value is less than the previous best, , then is replaced by the new solution ; otherwise, metropolis criterion is used as follows: (40) where . A random value following the continuous uniform distribution is generated and compared with p. , will replace leading to the acceptance of an If uphill move. C. Annealing Schedule of Temperatures The annealing schedule controls the descending speed of the annealing temperature. A good annealing schedule can help find the global optimum. Several cooling methods exist, e.g., , , , , where is the initial temperature and is the th step of annealing. Usually, and or 2. Further, a proper value of the initial temperature can effecis tively reduce the computing time. The initial temperature estimated by an average acceptance probability which tends to worsen the objective function, for example, . Based is derived as on the Metropolis criterion,
Fig. 3. IEEE 30-bus system.
Similarly, the final temperature, , is estimated to make the acceptance probability of a worse solution to be no more than , for example, 5%. D. Termination Conditions The inner loop termination condition: If , or the inner loop cycle counter, , reaches the predefined number , the inner loop terminates. The outer loop termination condition: If the temperature is lower than a predefined termination temperature , or the outer loop cycle reaches the predefined number , or the entropy of the system is stable, the outer loop terminates. E. Local Search A local search is performed to ensure that the final solution is the optimum in the neighborhood of the solution after the above SA algorithm is terminated. VI. CASE STUDY The IEEE 30-bus system [30], [31] is used for case study, as shown in Fig. 3. The system is modified with a decreased maximum generator reactive power output and increased reactive load, as shown in Tables II and III. The modification is used to make the system stressed enough such that reactive power compensation is necessary. For instance, the voltage magnitude at bus 30 in the modified system is lower than 0.95 p.u. in the heavily loaded case. The modified system data are used as the “heavy-load” case. Then, loads are scaled down by 0.8 to construct the “medium-load” case, and further scaled down by 0.8 to construct the “light-load” case. In the total 8760 h per year, heavy-load and light-load cases are assumed to be 1000 h each, and hence, the medium-load case takes 6760 h. The energy cost is $40/MWh; and the costs is assumed to be $3600/year for each VAr device.
(41) A. Selection of Candidate VAr Locations where change.
is the estimated maximum objective
The fuzzy clustering method is first carried out for the heavyindex, load case using three different types of indices:
WANG et al.: REACTIVE POWER PLANNING BASED ON FUZZY CLUSTERING, GRAY CODE, AND SIMULATED ANNEALING
TABLE II MODIFIED REACTIVE LOAD DEMAND IN THE IEEE 30-BUS SYSTEM
TABLE III MODIFIED GENERATOR MAXIMUM REACTIVE POWER OUTPUT
TABLE IV THREE INDICES USED FOR FUZZY CLUSTERING ALGORITHM
2253
lowest four values of each index are examined. The four weakest index, buses {30, 19, buses are {30, 8, 7, 19} based on 8, 18} based on index, and buses {30, 19, 20, 18} using the voltage fluctuation index. Apparently, the indices do not generate the same evaluation for all buses, which can also be seen from Fig. 4. To find a comprehensive utilization of all the indices, it is necessary to bring in the fuzzy theory to cluster the weak load buses. All the PQ buses in the test system are included in the fuzzy . clustering process. The Fuzzy Equivalent Matrix is The fuzzy clustering method classifies all the load buses into three groups which are: {30}; {7, 8}; {other PQ buses} when , evaluated by the F test. From the viewpoint of voltage magnitudes, Bus 30 has both the lowest base-case voltage magnitude and the maximal voltage fluctuation, so it eventually distinguishes itself from all other buses. Also, Buses 7 and 8 are weak buses possessing similar characteristics classified in the second cluster. From the results of the fuzzy clustering algorithm, Buses 30, 7, and 8 are chosen as candidate buses for new VAr devices. function under the The linear formation of the modified Gray code, and the solution to reactive power optimization using SA, will be performed next. B. Benchmark Solution to VAr Optimization Using Exhaustive Search
Fig. 4. Values of the three indices after standardization.
index, and the voltage fluctuation index. Specifically, the voltage fluctuation represents the relative deviation of the voltage magnitude at the maximum TTC between Areas 1 and 3 from the voltage magnitude at the base operation case. Table IV shows the value of the indices at PQ buses, and Fig. 4 illustrates the indices after standardization. Since usually more than one candidate location exists for VAr installation (especially in large-scale power system), the
In the VAr optimization model (1)–(10), three different load levels are taken into account: heavy load, medium load, and light load. Benchmark result is given below to examine the proposed SA result. First, the RPP optimization (1)–(9) is carried out considering that only one new VAr device is installed at each candidate bus, respectively. This is to find an appropriate maximum VAr capacity at each candidate bus. The maximum VAr capacities needed at Buses 7, 8, and 30 are {8.26, 8.56, 5.79} MVar at heavy-load condition, {8.25, 8.56, 5.79} MVar at medium-load condition, and {7.75, 8.49, 5.79} MVar at light-load condition, respectively. Hence, the maximum VAr capacity is set to {9, 9, 6} MVar, respectively. As a benchmark, the exhaustive enumeration method is used to verify the proposed method. The VAr capacities at all three candidate buses are first tested with 0.5 MVar as the capacity variation size. Thus, this requires capacity combinations, each of which is solved by calculating the TTC under the capacity combination and then by applying the TTC value in (10) to solve the RPP optimization using the interior point method. Although extremely time consuming, this exhaustive search does give true optimal solution. The optimal solution is {6.0, 3.5, 6.0} MVar compensation at Buses 7, 8, and 30, respectively, with minimum total annual cost of $544 609.20. Further, another test with 0.1 MVAr as the step size is performed, which requires even much more simulation runs and gives more fine-tuned global optimal. The solution is {6.1, 3.3, 5.8} MVar compensation at Buses 7, 8, and 30, respectively, with minimum total annual cost of $544 570.50.
2254
IEEE TRANSACTIONS ON POWER SYSTEMS, VOL. 26, NO. 4, NOVEMBER 2011
at Bus 30, with a total annual cost of $544 609.20. The results are shown in the third column in Table V. Also listed in Table V are the benchmark results from the exhaustive search discussed in Section VI-B. As validated in Table V, the proposed algorithm works very well. VII. CONCLUSIONS
Fig. 5. TTC values versus different ordering methods of VAr interval combinations.
TABLE V COMPARISON OF THE RESULTS FROM THE PROPOSED SA-BASED ALGORITHM AND THE EXHAUSTIVE SEARCH
C. SA Solutions to VAr Optimization Function: Based on 1) Formation of TTC Versus the maximum capacity set , the step size for discretization is set to , 1.5 MVar. Therefore, . The (7, 7, 5; 3)-modified Gray code is generated. The (7, 7, 5; 3)-modified Gray code is applied to form the vector, which is a series of . The TTC optimization using (11)–(19) is performed at various discretized capacities of , , and combinations. N-1 contingency constraints are considered. Based on the derived pair data, with a piecewise linear interpolation, Fig. 5 shows the comparison of the curve at the boundary VAr capacities based on the Traditional -ary sequence and the sequence by the modified Gray code. Evidently, the based on the modified Gray code has less “peak” or “valley” values, which facilitates the implementation of SA. 2) SA Results for VAr Optimization: In the improved SA algorithm, the initial temperature and the final temperature are set at and . Also, the annealing schedule is , where , , the inner loop cycles , and the outer loop cycle . Then, a local search is performed when SA solution is obtained. The optimal VAr capacity from the proposed algorithm is 6.10 MVAr compensation at Bus 7, 3.27 MVAR at Bus 8, and 5.77 MVAr at Bus 30. The corresponding annual cost is $544 569.70. This is shown in the second column in Table V. Since it may not be practical to have 0.01 MVar compensator, the solution can be rounded to every 0.5 MVAr. Then, the final solution is 6.0 MVAr at Bus 7, 3.5 MVAr at Bus 8, and 6.0 MVAr
Voltage stability constrained VAr planning model considering contingency and different load levels is formulated and solved in this paper. Contributions are summarized below. First, the fuzzy clustering method is employed to reduce candidate locations for new VAr compensators to a manageable size. The fuzzy clustering method can integrate multiple voltages stability related indices and differentiate the weakest group of buses from the other buses. Second, the modified Gray code is proposed to fit different VAr capacity limits at the candidate buses, and is further utilized problem to one dimento convert a multidimensional sion. This can sharply reduce the complexity of the formation of function. A piecewise linear interpolation is emthe curve with the modified Gray ployed hereafter. The code is smoother than the conventional -ary code, as shown in the case study. Finally, an improved SA algorithm is applied to solve the problem. Case study results show that the proposed approach is a feasible simplified and effective method for static voltage stability constrained RPP. Further study may include the investigation of mixed-VAr devices planning considering transient voltage stability constraints and dynamic characteristics of power system elements. REFERENCES [1] V. Ajjarapu, P. L. Lau, and S. Battula, “An optimal reactive power planning strategy against voltage collapse,” IEEE Trans. Power Syst., vol. 9, no. 2, pp. 906–917, May 1994. [2] Y. Chen, “Weak bus-oriented optimal multi-objective VAR planning,” IEEE Trans. Power Syst., vol. 11, no. 2, pp. 1885–1890, May 1996. [3] H. Liu, L. Jin, J. D. McCalley, R. Kumar, V. Ajjarapu, and N. Elia, “Planning reconfigurable reactive control for voltage stability limited power systems,” IEEE Trans. Power Syst., vol. 24, no. 2, pp. 1029–1038, May 2009. [4] H. Liu, “Planning reactive power control for transmission enhancement,” Ph.D. dissertation, Iowa State University, Ames, IA, 2007. [5] F. Li, J. D. Kueck, D. T. Rizy, and T. King, A Preliminary Analysis of the Economics of Using Distributed Energy as a Source of Reactive Power Supply, Oak Ridge National Laboratory, Oak Ridge, TN, Tech. Rep. (ORNL/TM-2006/14), Apr. 2006. [6] J. D. Kueck, B. Kirby, D. T. Rizy, F. Li, and N. Fall, “Reactive power from distributed energy,” Electricity J., vol. 19, no. 10, pp. 27–38, Dec. 2006. [7] W. Zhang, F. Li, and L. M. Tolbert, “Review of reactive power planning: Objectives, constraints, and algorithms,” IEEE Trans. Power Syst., vol. 22, no. 4, pp. 2177–2186, Nov. 2007. [8] V. Krishnan, H. Liu, and J. D. McCalley, “Coordinated reactive power planning against power system voltage instability,” in Proc. IEEE/PES Power Systems Conf. Expo., Mar. 2009, pp. 1–8. [9] N. Yorino, M. Eghbal, E. E. El-Araby, and Y. Zoka, “Voltage security constrained reactive power planning considering the costs and performance of VAR devices,” in Proc. iREP Symp. Bulk Power System Dynamics and Control—VII, Aug. 2007, pp. 1–11. [10] A. Tiwari and V. Ajjarapu, “Optimal allocation of dynamic VAR support using mixed integer dynamic optimization,” IEEE Trans. Power Syst., vol. 26, no. 1, pp. 305–314, Feb. 2011.
WANG et al.: REACTIVE POWER PLANNING BASED ON FUZZY CLUSTERING, GRAY CODE, AND SIMULATED ANNEALING
[11] D. Chattopadhyay and B. B. Chakrabarti, “Reactive power planning incorporating voltage stability,” Int. J. Elect. Power Energy Syst., vol. 24, no. 3, pp. 185–200, 2002. [12] D. Pudjianto, S. Ahmed, and G. Strbac, “Allocation of VAR support using LP and NLP based optimal power flows,” Proc. Inst. Elect. Eng., Gen., Transm., Distrib., vol. 149, no. 4, pp. 377–383, Jul. 2002. [13] J. Z. Zhu, C. S. Chang, W. Yan, and G. Y. Xu, “Reactive power optimization using an analytic hierarchical process and a nonlinear optimization neural network approach,” Proc. Inst. Elect. Eng., Gen., Transm., Distrib., vol. 145, no. 1, pp. 89–97, Jan. 1998. [14] R. Ramos, J. Vallejos, and B. Barán, “Multi-objective reactive power compensation with voltage security,” in Proc. 2004 IEEE/PES T&D Conf. Expo.: Latin America, Brazil, Nov. 2004, pp. 302–307. [15] Y. L. Chen and Y. L. Ke, “Multi-objective Var planning for large-scale power systems using projection-based two-layer simulated annealing algorithms,” Proc. Inst. Elect. Eng., Gen., Transm., Distrib., vol. 151, no. 4, pp. 555–560, Jul. 2004. [16] D. Chattopadhyay and B. B. Chakrabarti, “Voltage stability constrained Var planning: Model simplification using statistical approximation,” Int. J. Elect. Power Energy Syst., vol. 23, no. 5, pp. 349–358, 2001. [17] W. Zhang, F. Li, and L. M. Tolbert, “Interpolation approximation of Voltage Stability Constrained OPF (VSCOPF) for reactive power planning,” Eur. Trans. Elect. Power, vol. 21, no. 1, pp. 155–164, Jan. 2011. [18] L.-J. Cai and L. Erlich, “Power system static voltage stability analysis considering all active and reactive power controls—Singular value approach,” in Proc. Power Tech 2007, Jul. 2007, pp. 367–373. [19] P. Kessel and H. Glavitsch, “Estimating the voltage stability of a power system,” IEEE Trans. Power Del., vol. 1, no. 3, pp. 346–354, Jul. 1986. [20] S. Zhou, Power System Voltage Stability and Its Control. Beijing, China: China Electric Power, 2001. [21] H. Chen, J. Wu, and S. Gao, “Application of fuzzy clustering in subarea load forecasting,” Power Demand Side Manage., vol. 8, no. 3, pp. 12–18, May 2006. [22] Y. Wang, C. Li, and Y. Zuo, “A selection model for optimal fuzzy clustering algorithm and number of clusters based on competitive comprehensive fuzzy evaluation,” IEEE Trans. Fuzzy Syst., vol. 17, no. 3, pp. 568–577, Jun. 2009. [23] F. Höppner, F. Klawonn, R. Kruse, and T. Runkler, Fuzzy Cluster Analysis. Chichester, U.K.: Wiley, 1999. [24] Y. Wang, F. Li, and Q. Wan, “Reactive power planning based on fuzzy clustering and multivariate linear regression,” in Proc. IEEE PES General Meeting, Minneapolis, MN, Jul. 25–29, 2010. [25] S. Kim, T. Y. Song, M. H. Jeong, M.-H. Jeong, B. Lee, Y.-H. Moon, J.-Y. Namkung, and G. Jang, “Development of Voltage Stability Constrained Optimal Power Flow (VSCOPF),” in Proc. IEEE Power Eng. Soc. Summer Meeting, Vancouver, BC, Canada, Mar. 2001, pp. 1664–1669. [26] G. Dah-Jyh, “Generalized gray codes with applications,” Proc. Nat. Sci. Council Rep. China (A), vol. 22, pp. 841–848, 1998. [27] R. W. Doran, “The gray code,” J. Universal Comput. Sci., vol. 13, no. 11, pp. 1573–1597, 2007. [28] F. Li, “Distributed processing of reliability index assessment and reliability-based network reconfiguration in power distribution systems,” IEEE Trans. Power Syst., vol. 20, no. 1, pp. 230–238, Feb. 2005. [29] L. Ingber, “Very fast simulated re-annealing,” Math. Comput. Model., vol. 12, no. 8, pp. 967–973, 1989. [30] R. D. Zimmerman, C. E. Murillo-Sánchez, and R. J. Thomas, “MATPOWER’s extensible optimal power flow architecture,” in Proc. IEEE Power and Energy Soc. General Meeting, 2009, Jul. 26–30, 2009, pp. 1–7.
2255
[31] Univ. Washington, Power System Test Case Archive. [Online]. Available: http://www.ee.washington.edu/research/pstca/.
Yurong Wang (S’08) received the B.S. and M.S. degrees from Southeast University, Nanjing, China, in 2005 and 2008, respectively. She is presently pursuing the Ph.D. degree in School of Electrical Engineering, Southeast University. She was a visiting scholar, supported by China Scholarship Council (CSC), in the Department of Electrical Engineering and Computer Science, The University of Tennessee at Knoxville (UTK), Knoxville, TN, from 2009–2010. Her research interests include reactive power planning, voltage stability, and optimization.
Fangxing (Fran) Li (M’01–SM’05) received the B.S. and M.S. degrees from Southeast University, Nanjing, China, in 1994 and 1997, respectively, and the Ph.D. degree from Virginia Tech, Blacksburg, in 2001. He has been an Assistant Professor at The University of Tennessee at Knoxville (UTK), Knoxville, TN, since August 2005. Prior to joining UTK, he was a principal R&D engineer at ABB Electrical System Consulting (ESC) in Raleigh, NC. His current interests include reactive power, energy market, distributed energy resources, renewable energy integration, and computational methods. Dr. Li is a registered Professional Engineer (PE) in the state of North Carolina.
Qiulan Wan received the M.S. and Ph.D. degrees from Southeast University, Nanjing, China, in 1985 and 2002, respectively. Currently, she is a Professor in the School of Electrical Engineering, Southeast University, where she has been since 1977. Her research interests include power system operation, control, and electricity market.
Hao Chen received the B.S. and M.S. degrees from Southeast University, Nanjing, China, in 2002 and 2005, respectively, where he is pursuing the Ph.D. degree. He received the qualification of a registered statistician in China in 2006. He is currently working in Nanjing Power Supply Company, Nanjing, China. His main research interest is time series analysis.