Australian Journal of Psychology, Vol. 62, No. 4, December 2010, pp. 216–226.
Readiness to adaptively change under three conditions: Clinical, careers, and natural change situations
TERRY BOWLES School of Behavioural and Social Sciences, University of Ballarat, Victoria, Australia
Abstract The Adaptive Change Model (ACM) was developed as an alternative form of the Transtheoretical Model of Change to address some of the criticisms of early operationalisation. Both models provide a framework for measuring the potentialities of change and to facilitate targeted behaviour change in general and clinical settings. In this research, the eight factors of the Adaptive Change Questionnaire (ACQ) operationalising the ACM were validated using confirmatory factor analysis, involving 238 respondents. The findings indicated a good fit between the model and data. A comparison of the mean scores of the factors of the ACM showed respondents seeking clinical therapy (n ¼ 85) were lower on self-rating of factors related to adaptive change than a group receiving career counselling (n ¼ 88) and a non-therapy group (n ¼ 65). The ACQ factors correctly predicted the allocation of 79.3% of the clinical and non-therapy respondents which confirmed previous research. The relevance of the findings for therapeutic interventions and future research are discussed.
Keywords: Adaptive change, therapeutic change, vocational change
Psychological change Adaptive change is an effective method to facilitate change as individuals seek to construct and control elements of their future. Adaptive change is a means of describing and facilitating desired end states by attention to, and application of, strategic processes while scaffolding the Process with a secondary set of factors that Support the change process (Bowles, 2006). Like the Transtheoretical Model (TTM) the Adaptive Change Model (ACM) can be applied to therapeutic change situations which are different to volitional and self-managed change processes (Klingemann & Sobell, 2007) and other natural change processes (Sobell, 2007). In therapy the natural change processes that individuals control (to at least some degree) such as, self-management, the timing of change, motivational themes, processes used to change, rate of change, and environmental factors (Nelson, 2004) are managed with the therapist. The process and outcomes of such interventions of changes are qualitatively different to natural change. (Heather, Kissoon-Singh, & Fenton, 1990; Klingemann & Sobell, 2007).
Individuals who enter therapy are typically attempting to facilitate change with the assistance of a therapist and typically expect to return to normal functioning (Jacobson, Follette, & Revenstorf, 1984) or improve (diminish unwanted behaviours, emotions, and values and increase desirable behaviours, emotions, and values) based on assumptions or measures about functionality at the entry to therapy (Jacobson & Truax, 1991). The expectation that therapy can rectify their deficit or decrement is appropriate for a client entering clinical therapy, particularly in reference to a specific, diagnosed disorder where therapy has been shown to facilitate change (e.g., depression, anxiety, addictive behaviours; Prochaska, DiClemente, Velicer, & Rossi, 1993). The primary reason for assessing the client’s stage of change at entry to therapy is to develop a strategic formulation of targeted remediation for the presenting and diagnosed problem(s) (Prochaska, DiClemente, & Norcross, 1992). A second reason for such assessment is to gauge the individual’s propensity or readiness to change generally or within the context of the specifically desired change. The intervention can be tailored following a model of
Correspondence: Terry Bowles, School of Behavioural and Social Sciences, University of Ballarat, University Drive, Mt Helen VIC 3350. E-mail:
[email protected] ISSN 0004-9530 print/ISSN 1742-9536 online ª The Australian Psychological Society Ltd Published by Taylor & Francis DOI: 10.1080/00049531003667372
Model of adaptive change; change readiness; clinical status change and in relation to the specific factors identified as high or low facilitators of change by the client (Pantalon & Swanson, 2003; Prochaska et al., 1993). Although the experience of change for the client may accompany relapse and may not follow the hypothetically linear pattern of the model, the therapist may still seek to explicitly use the change model as a therapeutic guide (Gerwe, 2000). This research is important as understanding the client’s adaptive functionality to inform the therapeutic intervention at the client’s entry to therapy allows for a more precise targeting of interventions and promotes therapeutic efficacy. There are a number of models that explain change within therapeutic and non-therapeutic contexts (Bowles, 2001, 2006). Among the most common examples of such models are Motivational Interviewing (Miller & Rollnick, 2002), the tripartite model of therapeutic change (Hill, 2004) and the TTM (Prochaska & DiClemente, 1983). Motivational Interviewing is a model with three factors that have been shown to be relevant to therapeutic change. These are, the importance of the change to the individual, the readiness of the individual to change, and the confidence that the individual has that they can change (Miller & Rollnick, 2002). Another tripartite model that describes therapeutic change identifies the factors of exploration, insight, and action as instrumental in affecting change in the client (Hill, 2004). Of the various models the TTMs have been extensively used in research and applied settings. TTMs explain how people change in therapy, general psychology, and many healthrelated change activities (e.g., Salmela, Poskiparta, Kasila, Vahasarja, & Vanhala, 2008). TTMs have also been applied in therapy to identify the client’s use of factors of the model and create interventions to specifically redress deficits. The factors typically represented in the TTM stages of change are precontemplation, contemplation, preparation, action, and maintenance which are used clinically to identify the stage of change of the client in therapy (Grimley, Prochaska, Velicer, Blais, & DiClemente, 1994; Prochaska & DiClemente, 1983; Prochaska & Velicer, 1997). Criticism of the TTM Despite the extensive use of the original and subsequent forms of the TTM (Prochaska & DiClemente, 1983), it has drawn criticism that deserves attention. Researchers have noted that there is insufficient research providing evidence for the effectiveness of targeting specific stages of the TTM in therapy and insufficient evidence that using the TTM in this manner assists clients to transit from stage to stage in the model (Armitage & Arden 2002;
217
Bridle et al., 2005). The factor structure, independence of the factors and items, and the operationalisation of the commonly used questionnaire that measures the TTM (Grimley et al., 1994; Prochaska & DiClemente, 1983; Prochaska & Velicer, 1997) have also drawn criticism (West, 2005). Similarly, researchers have noted the instability of TTM factor constructs of the questionnaire (Etter & Sutton, 2002). The absence of evidence of the independence of the stages of change and the emphasis on the sequencing of the stages of change as well as allocating clients to specific stages to facilitate client’s progress in therapy has been questioned (Herzog, Abrams, Emmons, Linnan, & Shadel, 1999; Segan, Borland, & Greenwood, 2004). Some of these concerns can be understood given that the model evolved in a descriptive rather than an experimentally or statistically systematic means of development (Herzog, 2005; Little & Girvin, 2002). Despite this some researchers have argued for the replacement of the original TTM with a more comprehensive explanations and models of change (Etter & Sutton, 2002). After reviewing 150 studies involving the use of TTM measures in physical exercise it was concluded that improved construct validity, that was context-specific and employed all TTM factors not categorisation to a single-stage membership, was recommended (Spencer, Adams, Malone, Roy, & Yost, 2006). The general aim of this research is to redress some of these concerns. One recently developed model of transtheoretical change that extends the previous TTM and is designed to employ all factors of the model is the ACM (Bowles, 2006). The model was developed to reflect the factors facilitating change from a range of models and theories of psychology that facilitate change as well as incorporating respondent’s descriptions of how they manage change and is therefore genuinely transtheoretical in nature (Bowles, 2001). Interpreting client’s profiles on the Adaptive Change Questionnaire (ACQ) can identify when attention is to be paid to facilitate change. The five Process Factors are: Openness to Opportunity, Visualization, Planning, Action and Closure. Planned Action should be timetabled, achieved, practiced, and habituated to ensure the successful completion of the stage. As well as the five Process factors there are three factors important to Support the Process of change. The three Support factors that can be applied with each Process factor are being able to maintain and manage motivation or Inner Drive, managing Negative Emotions, and gaining Social Support. While it is possible to achieve change towards a new state by using an individual or minimum contribution of these factors, using all the Process and Support factors will result in optimal outcomes.
218
T. Bowles
By addressing the issue requiring change coincident with the theoretically defined Process factors, particularly those factors that the client would not employ and would score low, the therapist can facilitate change. Aligning the three Support factors with each stage of the Process factors facilitates the transition from one stage to the next. In many instances the therapist may need to only remind the client to initiate entry to the stage or strategically integrate it into therapy. For example, to quell social anxiety a client may be asked at the Visualization stage to ask friends what it is like and how they approach previously unknown people and imagine doing so during guided meditation (Openness to Opportunity). To facilitate this stage the therapist (Social Support) may also need to assist the client with anxiety associated with previously experienced and powerful fear of rejection, frustration, and embarrassment (Negative Emotion(s)), identify trusted others who will respond genuinely and appropriately, including the therapist (Social Support), who may be drawn on to help to talk through issues such as anxiety attacks. Social Supports may also assist in maintaining motivation while inhibiting procrastination and unhelpful patterns of behaviour (Inner drive). The factor structure of the five Process factors and the three Support factors of the ACQ was shown through exploratory research (Bowles, 2006). The research involved therapeutic and non-therapeutic respondents completing a questionnaire about the eight factors of the ACM. The results showed that five Process factors and three Support factors had very good structure and high internal consistency (Boyle, 1991; Nunnally, 1978). The research involving the eight factors of the ACQ and the clinical status (clinical and non-therapy) and gender (male and female) as IVs showed consistent effects at the univariate level. There were no interactions involving gender and clinical status. Based on Cohen’s (1988) description of the strength of the magnitude of difference between groups of respondents a small partial eta squared (Zp2) is .010 (1%); medium is approximately .060 (6%), and large is approximately .138 (13.8%) or greater. The results showed that the magnitude of difference between the non-therapy group and clinical groups for both the Process and Support factors was consistently large or greater with the non-therapy group reporting higher scores. The difference between the males and females from the previous research (Bowles, 2006) showed that males reported higher scores, of weak magnitude, on Openness to Opportunity and Visualization for the Process factors. The effect of gender was significant for each Support factor with females higher on Social Support, and males higher on Negative Emotions and Inner Drive.
The capacity of the eight factors of the ACM to predict group membership based on clinical status (clinical/non-therapy) was also tested (Bowles, 2006). The results showed that a discriminant function analysis correctly allocated 80.06% of the clinical respondents and 79.40% of the non-therapy respondents. The factors that contributed most powerfully to the discrimination were Inner Drive, Closure, Social Support, Visualization, Action, Openness to Opportunity, Negative Emotions, and Planning. One aim of this research is to replicate previous research investigating the predictive power of the ACM to discriminate respondents on the basis of clinical status (clinical and non-therapy respondents). To advance the previous findings the analysis will also involve a third group of respondents seeking counselling for career change. Although there is no known research comparing the three groups on the factors of the ACM or other form of the TTM it is anticipated that the career group means will consistently fall between mean scores of the other two groups. This is expected as the career group would be considered to be more functional than the clinical group but not as functional as the non-therapy group in applying the ACM factors, at the entry to therapy and counselling. The general aim of the current research is to confirm the improvement to the structure of the TTM by validating the ACM. The specific research questions relevant to this study are: .
.
.
.
Can the exploratory factor structure of the Process factors of the ACQ be replicated with confirmatory factor analysis? Does the adaptability of respondents approaching clinical care vary from those seeking career counselling and those changing under natural circumstances? Are there differences between three groups on the basis of gender and clinical status of respondents on all eight ACM factors? Can the factors of the ACM be used to correctly allocate respondents on the basis of clinical status (clinical, careers, and non-therapy)?
Method Participants A convenience sample involving three groups with a total of 238 respondents participated in this research. Of the 85 clinical respondents, 39 were female with an average age of 38.62 (SD ¼ 9.42). One of these respondents was a manager, 20 were in professional occupations, three were tradespeople, nine were in sales and service industries, three were home carers, and three were students. The average age of the 46 male, clinical respondents was 38.28 (SD ¼ 13.17).
Model of adaptive change; change readiness; clinical status Seven of these respondents were managers, 12 were professionals, nine were tradespeople, five worked in service and sales industries, two were involved in production, one worked in a clerical occupation, six were students and four were unemployed. Of the 88 career counselling group members, 45 were female with an average age of 32.89 (SD ¼ 9.42). Three of these respondents were managers, 23 were in professional occupations, one was a tradesperson, nine were in sales and service industries, one was involved in production, one was a home carer, six were students and one was unemployed. The average age of the 43 male, career counselling group members was 32.95 (SD ¼ 8.64). Three of these respondents were managers, 18 were professionals, four were tradespeople, 10 worked in service and sales industries, one was involved in production, three were home carers, three were students and one was unemployed. There were 65 participants in the non-therapeutic group, 38 were female with an average age of 37.00 (SD ¼ 11.04). Two of these respondents were managers, 19 were in professional occupations, three were tradespersons, four were in sales and service industries, one was involved in home carer, eight were students and one was unemployed. The average age of the 27 male, career counselling group members was 41.41 (SD ¼ 10.02). Four of these respondents were managers, 19 were professionals, one was a tradesperson, two worked in service and sales industries, and one was a student. To ensure that there were equivalent numbers of males and females in occupational categories respondents were grouped into three categories, in each level of the clinical status variable with a 2 (gender) 6 3 (clinical status) crosstabulation. There was no significant association between gender and clinical status, w2 (2, n ¼ 238) ¼ .233, p ¼ .311 indicating there was no significant difference in the frequency of the respondents in groups. To establish that there was equivalence between occupation and clinical status three groups of occupations were generated. The first was composed of managers and professionals, the second was composed of all others involved in paid work, including trades, services and sales, production, and clerical. The third group of respondents was unpaid and composed of home carers, retired people, students, and the unemployed. Comparison of the frequency within three career and three clinical groups showed there was no significant association, w2(4, n ¼ 238) ¼ 9.11, p ¼ .59). An ANOVA testing whether age differences were present between members of groups based on clinical status showed significant differences, (F(2,237) ¼ 8.24, p ¼ .001, Zp2 ¼ .07). Bonferroni’s post hoc test indicated that the career counselling group was significantly younger than the other two groups, so age was entered as a covariate in relevant, future analyses.
219
Procedure The clinical participants were approached while they attended one of two clinics in metropolitan Melbourne to receive psychological therapy. Respondents were either self- referred or were diagnosed by a medical practitioner and referred to the clinic. Typically, the clinical respondents met the criteria for a diagnosed disorder. At the first session of therapy, each clinical respondent was approached with a written explanation of the research, a consent form, and a verbal invitation to participate (as were all respondents at first contact). After respondents agreed to participate the questionnaires were provided, completed, and returned to the therapist/ researcher typically before the second session of therapy. Data from respondents who indicated that they had previously received medical or therapeutic assistance for the same problem or other psychological issues were excluded from the research. At subsequent sessions the respondent’s results were reported back and informed the plan of therapy. The questionnaires were de-identified and combined into a large data set ready for data entry. The second group of participants sought career counselling from one of two career counselling facilities in Metropolitan Melbourne. The career counselling was either for assessment and feedback, or assessment and feedback followed by counselling and the procedure for inclusion of the data followed processes similar to that of the clinical group. Data from respondents who indicated that they had previously received counselling for the same problem or other psychological problem were excluded from the research. For the clinical and career group member’s data were de-identified and entered into a database. A third group of respondents were obtained through invitations to participate from the researcher or through promotional information posted in libraries, doctor’s surgeries, tertiary educational facilities, and public facilities that would promote the research. For the non-therapeutic participants, at the invitation to participate, the researcher asked the participant to take the questionnaire and complete it only if they had not previously attended a medical, psychologist, or career counsellor for the problem. If they had they were asked to return the questionnaire without completion. All data were entered on an SPSS database and analysed using SPSS 14 for windows and screened using recommended procedures (Hair, Black, Babin, Anderson, & Tatham, 2006; Tabachnick & Fidell, 2007). Questionnaire The 35 items of the ACQ form eight factors that have been previously described (Bowles, under review).
220
T. Bowles
Each items is rated in regard to the stem, ‘‘WHEN I THINK OF CHANGE OCCURRING I . . . .’’ Following is a sample item associated with each factor and the Cronbach’s alpha (in parantheses) referring to the internal consistency of factors from Bowles (2006). Of the 35 items, four items define the each of the factor of Openness to Opportunity (a ¼ .76; Stay open to change), Visualization (a ¼ .83; Can imagine the outcome of change), and Planning (a ¼ .79; Get organised to change). There are three items defining Action (a ¼ .68; Take action easily) and Closure (a ¼ .78; Find completing things enjoyable). There are three non-sequential factors that together form the factors of Social Support. The first of these three factors is Social Support which has five items (a ¼ .91; Know there are people that can give me the support I need). Inner Drive also has five factors (a ¼ .81; Have an inner drive that keeps me going), and the factor of Negative Emotions has seven items (a ¼ .83; Feel despaired). Each item is aligned with the same six-point Likert scale. The scale ranges from 1 ¼ ‘‘Very Strongly Disagree,’’ to 6 ¼ ‘‘Very Strongly Agree.’’ Results The data were screened prior to the planned analyses (Hair, Black, Babin, Anderson, & Tatham, 2006; Tabachnick & Fidell, 2001). For both the univariate and multivariate analyses the preliminary screening revealed that the cell sizes were satisfactory and the scale scores were normally distributed to acceptable levels in all but a small number of cases. Variables that deviated from the norm underwent transformations. Investigation of the transformed scale scores differed little from the results obtained using the untransformed data. As the transformation of items had no real impact on the results of analyses, the untransformed data were used in the subsequent analyses. Confirmatory factor analysis (CFA) was performed using the analysis of moment structures with estimation by the method of maximum likelihood to test the item to factor structure of the ACQ. First, the five Process factors were analysed followed by a second analysis investigating the structure of the three Support factors. The application and procedure for CFA has been described previously (e.g., Arbuckle, 2003; Byrne, 1998, 2001; Joreskog & Sorbom, 1993). The CFA analysis was conducted using AMOS 6, the SPSS version comparable with PRELIS and LISREL (Joreskog & Sorbom, 1988). The goodness of fit of the proposed models of Process and Support factors were evaluated in line with the recommendations of Byrne (2001) and Marsh, Balla, and Hau (1996). A number of fitindices were employed to assess the overall fit of the proposed models. The ratio of chi-square to degrees
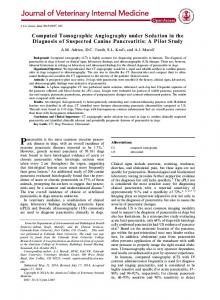
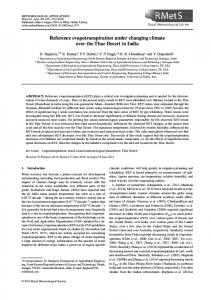
of freedom (w2/df) was calculated, with ratios of less than 2.0 indicating a good fit. As the sample size was relatively small and sample size can adversely influence the quality of the analyses four relative indices have been included to provide a comprehensive analysis (Loehlin, 1992). The analyses included the goodness-of-fit index (GFI), the adjusted goodness-of-fit index (AGFI), the comparative fit index (CFI), and the Tucker and Lewis index (TLI) to comprehensively evaluate the fit of the model (Tanaka, 1987; Tucker & Lewis, 1973). For GFI, AGFI, CFI, and TLI, coefficients closer to unity indicate a good fit, with acceptable levels of fit being above.90 (Marsh, Balla, & McDonald, 1988). For root mean square residual (RMR), and root mean square error approximation (RMSEA), evidence of good fit is considered to be values less than.05; values from.05 to.10 are indicative of moderate fit and values greater than.10 are taken to be evidence of a poorly fitting model (Browne & Cudeck, 1993). For the five Process factors, the most parsimonious item to factor structure that was confirmed was composed of 18 items contributing to five factors. The ratio of chi-square to degrees of freedom was equal to 1.78. The item to factor arrangement defined by the CFA fitted the data well with an (w2(125, N ¼ 238) ¼ 223.47, p ¼ .001), the GFI ¼ .906, the AGFI ¼ .872; the CFI ¼ .936, the TLI ¼ .922; the RMSEA ¼ .058; and the RMR ¼ .049, indicating a relatively good model fit. The coefficients and factor structure of the ACQ are shown in Table I and the path diagram in Figure 1. The three Support factors of the model were entered into the CFA in line with the factor analysis from previous research (Bowles, 2006). The most parsimonious item to factor arrangement confirmed the previous structure and was composed of 16 items contributing to three factors. The chi-square to degrees of freedom ratio was equal to 1.74. The item to factor arrangement defined by the CFA fitted the data well with a w2(101, N ¼ 238) ¼ 175.70, p ¼ .001, the GFI ¼ .920, the AGFI ¼ .892; the CFI ¼ .954, the TLI ¼ .946; the RMSEA ¼ .056; and the RMR ¼ .053, indicating a relatively good model fit for these three Support factors of change. The coefficients and factor structure of the FOCQ are shown in Table II. The correlation of the factors showed that there was a weak-to-moderate relationship between the factors, ranging from .32 to .68 (Table III). The association between Openness to Opportunity and Inner Drive was highest (r ¼ .68) indicating that these factors were conceptually similar. The Cronbach’s alpha coefficients were satisfactory as they ranged from .69 to .90 (Kaplan & Saccuzzo, 2005). To address the differences between three groups on the basis of clinical status and gender of respondents on ACM factors, a 2 (gender) 6 3
221
Model of adaptive change; change readiness; clinical status Table I. Regression weights relevant from the confirmatory factor analysis (CFA) of the five process factors of the Adaptive Change Questionnaire (ACQ)
Parameter estimate Openness 49 1.00 41 .99 19 .83 11 .72 Visualization 55 1.00 25 1.05 45 1.03 15 1.13 Planning 34 1.00 54 1.03 44 1.17 4 1.03 Action 46 1.00 53 .98 6 .74 Closure 17 1.00 37 1.12 7 1.05
Standard error
Estim/S.E critical ratio for regression weight
Standardized coefficients
.10 .10 .09
9.77 8.18 8.08
.77 .70 .58 .57
.11 .11 .13
9.51 9.00 8.54
.73 .69 .66 .62
.09 .11 .12
11.22 10.88 8.99
.73 .80 .77 .63
.13 .11
.10 .11
7.45 7.10
.64 .71 .63
10.98 9.62
.78 .81 .65
Table II. Regression weights relevant from the CFA of the three support factors of the ACQ
Parameter estimate Negative emotions 50 1.00 60 1.02 20 .78 40 .83 10 .83 3 .87 30 1.10 Social support 38 1.00 8 .68 58 .80 28 .85 48 .98 Inner drive 42 1.00 32 1.16 22 1.09 2 1.23
Standard error
Estim/SE critical ratio for regression weight
Standardized coefficients
.12 .11 .11 .11 .11 .12
8.80 7.02 7.50 7.89 7.60 9.18
.62 .73 .54 .59 .63 .60 .78
.06 .06 .06 .06
12.46 13.89 15.01 17.72
.90 .69 .74 .78 .86
.14 .14 .16
8.35 7.78 7.81
.59 .77 .68 .68
Note: Note the item c52 has been removed from the Inner Drive factor.
Figure 2. Path diagram of the items contributing to the Support factors of the ACQ
Figure 1. Path diagram of the items contributing to the Process factors of the Adaptive Change Questionnaire (ACQ)
(clinical status) MANCOVA with age the covariate, was conducted with the eight ACQ factors as the dependent variables. The Wilks criterion indicated
that the combined dependent variables were significantly related to gender (F(8,226) ¼ 3.31, p ¼ .003, Zp2 ¼ .09, Wilks’ l ¼ .90), clinical status (F(16,454) ¼ 4.18, p ¼ .001, Zp2 ¼ .13, Wilks’ l ¼ .76), and a significant covariate (F(8,226) ¼ 2.87, p ¼ .05, Zp2 ¼ .09, Wilks’ l ¼ .90). Univariate tests conducted with the eight ACQ factors as the DVs and the gender and clinical status
222
T. Bowles
as the IVs with age as a covariate showed that there were no significant interaction effects and no effect for age. There was an effect of gender in which females (mean ¼ 4.53) were higher scoring than males (mean ¼ 4.04) on Social Support, (F(1,233) ¼ 16.05, p ¼ .01, Zp2 ¼ .06. After Bonferroni post hoc adjustment significant differences were found between groups with all three groups being significantly different on ratings for Visualization, and Planning. The clinical group rating was significantly lower than the career counselling and non-therapeutic groups’ ratings for the factors of Openness to Opportunity, Closure, Negative Emotions, and Inner Drive. The clinical and nontherapeutic groups were significantly different on Social Support. The clinical and the career counselling group means were significantly different to the non-therapy group mean score on Action (Table IV).
Predictive capability of the ACQ To test whether the factors defining the ACM predict group membership based on the three levels of clinical status, a direct discriminant function analysis was performed (Tabachnick & Fidell, 2007). The eight factors were loaded as the predictor variables. Clinical status of respondents (i.e., clinical, careers, and nontherapy) was the discriminating factor in the analysis. Two discriminant function were calculated with a combined w2(16, n ¼ 233) ¼ 61.43, p 5 .001 indicating that a good association existed between predictors and groups. After removal of the first function, the second analysis indicated that there was no significant association between groups and predictors (w2(7, n ¼ 233) ¼ 10.69, p 5 .158). The first discriminant function accounted for 83% of the between-group variability and the structure matrix indicated that all
Table III. Correlations, reliabilities, and descriptive details of the ACQ 1 Process factors (1) Openness (2) Visualization (3) Planning (4) Action (5) Closure Support factors (6) Negative emotions* (7) Social support (8) Inner drive Scale mean Scale SD Cronbach’s alpha
4.28 .60 .76
2
3
4
5
6
7
8
.58
.41 .53
.41 .36 .41
.49 .49 .35 .38
.48 .46 .37 .56 .39
.40 .41 .39 .32 .49
.68 .65 .55 .62 .48
.35
.56 .46
4.29 .89 .90
4.11 .69 .77
4.07 .73 .75
4.09 .70 .82
3.73 .83 .69
4.63 .76 .78
3.85 .75 .83
Note: All correlations are significant to the 0.01 level (2-tailed). *Negative Emotions has been reversed for the correlation and mean.
Table IV. Descriptive statistics of the factors of the ACM by clinical status Change condition Clinical (n ¼ 85)
Process factors Openness Visualization Planning Action Closure Support factors Negative emotions* Social support Inner drive
Career (n ¼ 88)
Non-therapy (n ¼ 65)
Mean
SD
Mean
SD
Mean
SD
F
Zp2
3.99ab 3.77a 3.84a 3.51a 4.35ab
.62 .77 .70 .78 .69
4.39a 4.07a 4.10a 3.72b 4.73a
.55 .63 .68 .80 .73
4.52b 4.46a 4.40a 4.05ab 4. 87b
.49 .62 .58 .84 .77
18.90 18.43 12.93 8.10 9.88
.14 .14 .10 .07 .08
3.44ab 4.05a 3.81ab
.78 .85 .72
3.08a 4.34 4.19a
.75 .89 .67
2.87b 4.54a 4.38b
.56 .89 .56
12.72 5.23 14.82
.10 .04 .11
Note. Means in the same row that have the same superscripts differ at p 5 .001 minimally. *Items have not been reversed.
Model of adaptive change; change readiness; clinical status ACM factors contributed significantly to the discriminant function. The factors contributing most powerfully to the discrimination, in order, were Openness to Opportunity, Visualization, Inner Drive, Planning, Negative Emotions, Closure, Action, and Social Support. Examination of the graphic representation of the groups showed that the first discriminant function maximally separated clinical and non-therapy respondents. A three-way classification tabulation of respondents indicated that the analysis correctly classified 53.40% of respondents. and the structure matrix indicated that all ACM factors contributed significantly to the discriminant function The correct allocation of respondents corresponded to 69.4% (n ¼ 59) of the clinical group, 44.3% (n ¼ 39) of the careers group, and 44.6% (n ¼ 29) of the non-therapy group (Table V). The discriminant analysis showed that the model as a whole, involving two underlying dimensions, provided the best explanation w2(16, n ¼ 238) ¼ 61.43, p 5 .001. As the career group scores consistently fell between the other two groups and to replicate the previous comparison between the clinical and non-therapy groups, the careers group was removed from the subsequent discriminant function analysis. The analysis involving the clinical and non-therapy respondents indicated a moderate association between predictors and groups existed, w2(8, n ¼ 238) ¼ 43.81, p 5 .001. The two-way classification tabulation of respondents indicated that the analysis correctly classified 79.3% of respondents. The correct allocation of clinical respondents corresponded to 83.5% (n ¼ 71) of the clinical group and 73.8% (n ¼ 48) of the non-therapy group. This discrimination provided a considerably better allocation of respondents than the previous analysis which included the careers group. The structure matrix indicated that the factors contributing most powerfully to the discrimination, in order, were Visualization, Openness to Opportunity, Inner Drive, Planning, Negative Emotions, Closure, Action, and Social Support.
Table V. Classification of respondents by clinical status based on their scores on the eight ACQ factors Predicted group membership Respondents Actual Clinical Career Non-therapy Percentage Clinical Career Non-therapy
Clinical
Career
Non-therapy
59 33 14
19 39 22
7 16 29
69.4 37.5 21.5
22.4 44.3 33.8
8.2 18.2 44.6
Total
85 88 65 100.0 100.0 100.0
223
Discussion The results show that a promising alternative form of the TTM has been developed that provides a possible improvement to the structure of the previous operationalisation of the TTM. The findings satisfy some of the recent criticisms of the TTM. The confirmatory factor analyses validated the findings of the earlier exploratory factor analysis. The analyses also showed that there were significant differences between respondents beginning clinical therapy, those beginning career counselling, and those having no therapeutic assistance to change. An analysis of the allocation of respondents based their clinical status correctly allocated 69% of all respondents. Each of these findings will be discussed below. The findings from the CFA showed consistency with previous research (Bowles, 2006) and attended to some of the criticisms of the questionable factor structure of the early version (Etter & Sutton, 2002; West, 2005). The ACM, defined by the confirmatory factor analysis, is composed of a set of five factors describing the process through which change may be achieved. It also has a second set of three factors that inform and scaffold the process of change. All except one item loaded on factors as previously defined by exploratory analyses (Bowles, 2006). The CFA provided evidence of the independence of the factors of a new model of the change process (Herzog et al., 1999; Segan et al., 2004) The new measure provides an alternative, comprehensive explanation of a model of change (Etter & Sutton, 2002). The Cronbach’s alpha coefficients of the ACQ factors were satisfactory (Kaplan & Saccuzzo, 2005) and equivalent to or better than the alpha coefficients presented in previous research by Bowles. Due to its origins, the model provides a means of generating a set of factors applicable to change processes ranging from therapeutic change or natural recovery (Heather et al., 1990; Klingemann & Sobell, 2007) to natural change processes (Nelson, 2004). The analysis of the mean ratings of the three groups of respondents showed that there were significant differences between all three groups on Visualization and Planning. In all the other comparisons the clinical group was significantly lower than the non-therapy group Action was the only other factor where there was a significant difference between careers and nontherapy groups. For every factor the pattern of scores showed that the clinical respondents scored lowest, followed by the career group, and then the non-therapy group. The magnitude of the difference between the clinical and non-therapy groups was consistent with previous research (Bowles, 2006). The findings indicate that respondents’ readiness to change or adaptability varied with those beginning clinical therapy considering themselves less adaptable than
224
T. Bowles
those seeking career counselling and both groups are less adaptable than the non-therapy group of respondents. These results are consistent with the previous arguments of Jacobson and Truax (1991) that those entering therapy expect to return to normal functioning through therapy (Jacobson et al., 1984). The differences between males and females on the eight factors of the Process and Support dimensions of the ACM were significant at the multivariate level and Social Support at the univariate level. In the current research they were both weak effects (Cohen, 1988). The univariate difference showed that females were higher self-rating on Social Support than males. Such a finding is consistent with previous research (Bowles, 2006) and relevant as enhancing Social Support is a salient means of enhancing adaptability in clinical clients, particularly for males with few significant others. The magnitude and direction of scores is important and indicates that the greater the psychological issue, the lower is the likelihood of adaptively changing, not the reverse, which may have been intuitively expected. That is, clinical clients were less naturally disposed to change (Nelson, 2004) and/or may have exhausted the reserves used by individuals to change naturally (Klingemann & Sobell, 2007; Sobell, 2007). Two other explanations are worth considering. First, it is possible that reduced adaptability may be synonymous with the experience of a pathological disorder. Alternatively, it is possible that pathology creates the condition for, or causes a reduction in adaptability. Given the difference between groups it is reasonable that specialist assistance in the form of clinical intervention and career counselling is sought by members of these groups. The intention would be that therapists and counsellors provide guidance and support to address this shortfall. Psycho-educational information and training could accompany the therapy to habituate or rehabituate the capacity to effectively re-apply the change factors when addressing the presenting diagnosed problem or career problem in future. Future research demonstrating that such therapeutic interventions are more efficacious than natural recovery is necessary to validate such interventions (Heather, Kissoon-Singh, & Fenton, 1990; Klingemann & Sobell, 2007). The findings regarding the classification of members of the two groups (clinical and non-clinical), on the basis of the discriminant function analysis was consistent with previous research (Bowles, 2006). Importantly, the analysis showed that 22.4% of clinical respondents were misclassified into the career group, and only 8.2% into the non-therapeutic group. There were 37.5% of the career group misclassified into the clinical group, and 18.2% into the nontherapeutic group. A majority of the misclassified non-therapeutic group members (33.8%) were allo-
cated into the careers group, followed by the clinical group, (21.5%). Most importantly, from the practice perspective is the fact that the career group’s mean score was consistently between the clinical and nontherapeutic group’s score. This profile suggests that completion of a clinical screen, including assessment of adaptability when client’s present for career counselling, may assist in more effective treatment of co-occurring psychological issues by referral to a clinical or psychologist from another specialty. There are many future applications to this research. While this research goes some way to addressing the criticisms previously made by Herzog et al. (1999), and Segan et al. (2004) improvement to the model and evidence of its applicability and efficacy is necessary. Future research charting the progress of an individual’s readiness to change as they enter and progress through therapy would be advantageous. Information about the operation of individual factors of the ACM, and how they interact, to facilitate therapeutic outcomes is also necessary (Spencer et al., 2006). Further research investigating whether different diagnoses and reasons for seeking therapy result in different profiles of adaptability would refine understanding of clients at entry to therapy. There are a number of caveats and limitations on the conclusions from this research. Although the number of respondents in each category was satisfactory in this research a larger sample of respondents would provide more confidence for the findings. Studies of similar constructs applying a randomised design would strengthen the findings and conclusions from this research. Similarly, the presence and magnitude of co-occurring psychological issues in the career and non-therapeutic group could be assessed more precisely in future. Research into the best presentation and use of the model to clients in therapy is necessary. Research comparing the efficacy of the ACM and other therapeutic change models used in therapy, such as Motivational Interviewing (Miller & Rollnick, 2002), the tripartite model of therapeutic change (Hill, 2004) and the TTM (Prochaska & DiClemente, 1983) would advance the understanding of the utility of such models. Investigating whether reduced adaptability is synonymous with pathology or generates the condition for, or causes a reduction in, adaptability is worthy of further research. In conclusion, the findings from this research suggest that it is appropriate for therapists to understand and apply a strategic model of change alongside any specific interventions aimed at therapeutically ameliorating any presenting problem. As well as defining the process and supports for change that clients bring to the beginning of therapy, analysis of the client’s profile as a whole and in the context of: (1) volitional (2) motivated (Schwarzer,
Model of adaptive change; change readiness; clinical status 2008), (3) habituated processes and, (4) embedding the change as an automatic response. Further, therapists typically focus on remediating the diagnosed problem, which is appropriate, but the facility of the client or patient to deal with repeat occurrences of the issue or presenting problem requires that therapists teach the means by which the client or patient can attend to the problem in future. The findings from this research suggest that explaining and applying strategies associated with each of the stages of change would facilitate management of problems in future. The initial plan of therapy may be designed to assist the client to (1) understand and manage the presenting or diagnosed problem, (2) understand and manage the factors that facilitate change, particularly those factors on which the client scored lowest, and (3) progress from one factor to another using the model to build change alongside addressing the presenting problem. While the therapist may intend to present a systematic progression through the stages of change it is important to accept that clients do not always follow this trajectory, especially when clients are being encouraged to take greater control, be more independent, and function with greater self-regulation which may result in restricted use of factors, regression of behaviour or minor relapse before stabilising and improving.
References Arbuckle, J. L. (2003). Analysis of moment structures (AMOS), user’s guide version 5.0. Chicago, IL: SmallWaters Corporation. Armitage, C. J., & Arden, M. A. (2002). Exploring discontinuity patterns in the transtheoretical model of planned behaviour. British Journal of Health Psychology, 7, 89–103. Bowles, T. (April, 2001). A model and measure of adaptive change. Unpublished doctoral dissertation, University of Melbourne, Victoria. Bowles, T. (2006). The adaptive change model: An advance on the transtheoretical model of change. The Journal of Psychology: Interdisciplinary and Applied, 140(5), 439–457. Bowles, T. (under review). The stability of the adaptive change questionnaire for clinical and nonclinical groups. Boyle, G. J. (1991). Does item homogeneity indicate internal consistency or item redundancy in psychometric scales? Personality and Individual Differences, 12, 291–294. Bridle, C., Riemsma, R. P., Pattenden, J., Sowden, A. J., Mather, L., Watt, I. S., et al. (2005). Systematic review of the effectiveness of health behaviour interventions based on the transtheoretical model. Psychology and Health, 20, 283–301. Browne, M. W., & Cudeck. R. (1993). Alternative ways of assessing model fit. In K. A. Bollen & J. S. Long (Eds), Testing structural equations models (pp. 36–62). Newbury Park, CA: Sage. Byrne, B. M. (1998). Structural equation modeling with LISREL, PRELIS, and SIMPLIS: Basic concepts, applications, and programming. Mahwah, NJ: Lawrence Erlbaum. Byrne, B. M. (2001). Structural equation modeling with AMOS: Basic concepts, applications, and programming. London: Lawrence Erlbaum.
225
Cohen, J. (1988). Statistical power analysis for the behavioral sciences (2nd ed.). Hillsdale, NJ: Lawrence Erlbaum. Etter J. F., & Sutton, S. (2002). Assessing ‘stages of change’ in current and former smokers. Addiction, 97, 1171–1182. Gerwe, C. F. (2000). Chronic addiction relapse treatment: A study of the effectiveness of the high-risk identification and prediction treatment model: Part III. Conclusion and future implications of HRIPTM research. Journal of Substance Abuse Treatment, 19, 439–444. Grimley, D., Prochaska, J., Velicer, W., Blais, M., & DiClemente, C. (1994). The Transtheoretical Model of change. In T. Brinthaupt & R. Lipka (Eds.), Changing the self: Philosophies, techniques, and experiences (pp. 201–228). New York: State University of New York Press. Hair, J. F., Black, B., Babin, B., Anderson, R. E., & Tatham, R. L. (2006). Multivariate data analysis (6th ed.). Englewood Cliffs, NJ: Prentice-Hall. Heather, N., Kissoon-Singh, J., & Fenton, G. W. (1990). Assisted natural recovery from alcohol problems: Effects of a self-help manual with and without supplementary telephone contact. British Journal of Addiction, 85, 1177–1185. Herzog, T. A. (2005). When popularity outstrips the evidence: Comment on West (2005). Addiction, 100, 1040–1050. Herzog, T. A., Abrams, D. B., Emmons, K. M., Linnan, L. A., & Shadel, W. G. (1999). Do processes of change predict smoking stage movements? A prospective analysis of the transtheoretical model. Health Psychology, 18, 223–375. Hill, C. E. (2004). Helping skills: Facilitating exploration, insight, and action (2nd ed.). Washington, DC: APA Publishing. Jacobson, N. S., & Truax, P. (1991). Clinical significance: A statistical approach to defining meaningful change in psychotherapy research. Journal of Consulting and Clinical Psychology, 59, 12–19. Jacobson, N. S., Follette, W C., & Revenstorf, D. (1986). Toward a standard definition of clinically significant change. Behavior Therapy, 17, 308–311. Joreskog, K. G., & Sorbom, D. (1988). LISREL 7: A guide to the program and application. Chicago: SPSS. Joreskog, K. G., & Sorbom, D. (1993). LISREL 8: Structural equation modeling with SIMPLIS command language. Chicago: Scientific Software International. Kaplan, R. M., & Saccuzzo, D. P. (2005). Psychological testing: Principles, applications, and issues (6th ed.). Belmont, CA: Wadsworth/Thomson. Klingemann, H., & Sobell, L. C. (Eds.). (2007). Promoting self change from addictive behaviors: Practical implications for policy, prevention, and treatment. New York: Springer. Little, J. H., & Girvin, H. (2002). Stages of change. A critique. Behavior Modification, 26, 223–273. Loehlin, J. (1992). Latent variables models. Hillside, NJ: Lawrence Erlbaum. Marsh, H. W., Balla, J. R., & Hau, K. T. (1996). An evaluation of incremental fit indices: A clarification of mathematical and empirical process. In G. A. Marcoulides & R. E. Schumacker (Eds.), Advanced structural equation modeling techniques (pp. 315–353). Hillsdale, NJ: Lawrence Erlbaum. Marsh, H. W. Balla, J. R., & McDonald, R. P. (1988). Goodnessoffit indexes in confirmatory factor analysis: The effect of sample size. Psychological Bulletin, 103, 391–410. Miller, W. R., & Rollnick, S. (2002). Motivational interviewing: Preparing people to change addictive behavior. New York: The Guilford Press. Nunnally, J. C. (1978). Psychometric theory (2nd ed.). New York: McGraw-Hill. Nelson, C. (2004). Natural recovery from alcohol problems and its implications on the disease model of addiction and the DSMIV diagnostic criteria for her alcohol dependence. Graduate Faculty Psychology Bulletin, 2, 115–127.
226
T. Bowles
Pantalon, M. V., & Swanson, A. J. (2003). Use of the University of Rhode Island change assessment to measure motivational readiness to change in psychiatric and dually diagnosed individuals. Psychology of Addictive Behaviors, 17, 91–97. Prochaska, J., & DiClemente, C. (1983). Stages and processes of self-change of smoking: Toward an integrative model of change. Journal of Consulting and Clinical Psychology, 51, 390–395. Prochaska, J. O., DiClemente, C. C., & Norcross, J. (1992). In search of how people change. American Psychologist, 47, 1102– 1114. Prochaska, J. O., DiClemente, C. C., Velicer, W. F., & Rossi, J. S. (1993). Standardized, individualized, interactive and personalized self-help programs for smoking cessation. Health Psychology, 12, 399–405. Prochaska, J. O., & Velicer, W.F. (1997). The Transtheoretical Model of health behavior change. American Journal of Health Promotion, 12, 38–48. Salmela, S., Poskiparta, M., Kasila, K., Vahasarja, K., & Vanhala, M. (2008). Transtheoretical Model-based dietary interventions in primary care: A review of the evidence in diabetes. Health Education Research. Retrieved April 11, 2008, from on-line serial http://her.oxfordjournals.org/cgi/content/abstract/cyn015 Schwarzer, R. (2008). Some burning issues in research on health behavior change. Applied Psychology, 57, 85–93.
Segan, C. J., Borland, R., & Greenwood, K. M. (2004). What is the right thing at the right time? Interactions between stages and processes of change among smokers who make a quit attempt. Health Psychology, 23, 86–93. Sobell, L. C. (2007). The phenomenon of self-change: Overview and key issues. In H. Klingemann & L. C. Sobell (Eds.), Promoting self change from addictive behaviors: Practical implications for policy, prevention, and treatment (pp. 1–31). New York: Springer. Spencer, L., Adams, T., Malone, S., Roy, L., & Yost, E. (2006). Applying the transtheoretical model to exercise: A systematic and comprehensive review of the literature. Health Promotion Practice, 7(4), 428–443. Tabachnick, B. G., & Fidell, L. S. (2007). Using multivariate statistics (5th ed.). Boston: Allyn and Bacon. Tanaka, J. S. (1987). ‘‘How big is enough?’’ Sample size and goodness of fit in structural equation models with latent variables. Child Development, 58, 134–146. Tucker, L., & Lewis, C. (1973). The reliability coefficient for maximum likelihood factor analysis. Psychometrika, 38, 1– 10. West, R. (2005). Time for a change: Putting the transtheoretical (Stages of Change) model to rest. Addiction, 100, 1036– 1039.