Dixon (n. 102), R. Sinnatamby (n. 5),. R. M. L. Warren (n. 521). Dundee: J. M.. Rehman (n ..... Liberman L, Morris EA, Benton CL, Abram- son AF, Dershaw DD.
Radiology
Breast Imaging Ruth M. L. Warren, MD Linda Pointon, MPhil Deborah Thompson, PhD Rebecca Hoff, BSc Fiona J. Gilbert, FRCR Anwar Padhani, FRCR Doug Easton, PhD Sunil R. Lakhani, MD Martin O. Leach, PhD For the UK Magnetic Resonance Imaging in Breast Screening (MARIBS) Study Group2 Published online 10.1148/radiol.2363040735 Radiology 2005; 236:779 –788 Abbreviations: CI ⫽ confidence interval MARIBS ⫽ Magnetic Resonance Imaging in Breast Screening ROI ⫽ region of interest From the Department of Radiology, Addenbrooke’s Hospital, Cambridge, England (R.M.L.W.); Study Coordinating Office, Section of Magnetic Resonance, Institute of Cancer Research, Royal Marsden Hospital, Downs Rd, Sutton, Surrey SM2 5PT, England (L.P., R.H., M.O.L.); Department of Radiology, University of Aberdeen, Scotland (F.J.G.); CR-UK Genetic Epidemiology Unit, Cambridge, England (D.T., D.E.); Breakthrough Breast Cancer Research Centre, Institute of Cancer Research, Royal Marsden Hospital, London, England (S.R.L.); and Paul Strickland Scanner Centre, Mount Vernon Hospital, Northwood, Middlesex, England (A.P.). Received April 23, 2004; revision requested July 1; revision received October 19; accepted December 10. Supported by a project grant from the UK Medical Research Council. Address correspondence to M.O.L. (e-mail: martin.leach @icr.ac.uk). See Materials and Methods for pertinent disclosures. 2 Clinical contributors of the MARIBS study group are listed in Appendix A.
Reading Protocol for Dynamic Contrast-enhanced MR Images of the Breast: Sensitivity and Specificity Analysis1 PURPOSE: To prospectively determine sensitivity and specificity of breast magnetic resonance (MR) imaging in a screening and symptomatic population by using independent double reading, with histologic or cytologic results or a minimum 18-month follow-up as the standard. MATERIALS AND METHODS: Informed consent and ethical approval were obtained. Reader performance was analyzed in 44 radiologists at 18 centers from 1541 examinations, including 1441 screening examinations in 638 high-risk women aged 24 –51 years (mean, 40.5 years) and 100 examinations in symptomatic women aged 23– 81 years (mean, 49.2 years). A screening protocol of dynamic T1-weighted three-dimensional imaging and 0.2 mmol/kg gadolinium-based intravenous contrast agent was used. Logistic and Poisson regressions were used to analyze reader performance in relation to experience. Correlation between readers was determined with statistics. Sensitivity and specificity were analyzed according to reader, field strength, machine type, and histologic results. RESULTS: The proportion of studies with lesions analyzed reduced significantly with reader experience (odds ratio, 0.84 per 6 months; P ⬍ .001), and number of regions per lesion analyzed also diminished (incidence rate ratio, 0.98 per 6 months; P ⫽ .047). The two readers for each study agreed 87% of the time, with a moderately good statistic of 0.52 (95% confidence interval [CI]: 0.45, 0.58). By taking the reading with the highest score (most likely to be malignant) from each double-read study, sensitivity was 91% (95% CI: 83%, 96%) and specificity was 81% (95% CI: 79%, 83%). Single readings had 7% lower sensitivity (95% CI: 4%, 11%) and 7% higher specificity (95% CI: 6%, 7%). Sensitivity did not differ between MR imager manufacturers or between 1.0- and 1.5-T field strength, but there were significant differences in specificity for machine type (P ⫽ .001) and for field strength adjusted for manufacturer (P ⫽ .001). Specificity, but not sensitivity, was higher in women younger than 50 years (P ⫽ .02). CONCLUSION: Independent double reading by 44 radiologists blinded to mammography results showed sensitivity and specificity acceptable for screening; sensitivity was higher when two readings were used, at the cost of specificity. Interreader correlation was moderately good, and evidence of learning was seen. Equipment manufacturer, field strength, and age affected specificity but not sensitivity. ©
Author contributions Guarantor of integrity of entire study, M.O.L.; study concepts and design, M.O.L., A.P., D.E., F.J.G., L.P., R.M.L.W., D.T.; literature research, R.M.L.W., L.P.; clinical studies, A.P., F.J.G., R.M.L.W.; data acquisition, R.H., L.P., S.R.L.; data analysis/ interpretation, D.T., R.M.L.W., L.P., M.O.L., D.E.; statistical analysis, D.T., D.E.; manuscript preparation, R.M.L.W., L.P., D.T.; manuscript definition of intellectual content, R.M.L.W., M.O.L., L.P., D.T., F.J.G., S.R.L.; manuscript editing, R.M.L.W., L.P., D.T., A.P.; manuscript revision/review and final version approval, all authors ©
RSNA, 2005
RSNA, 2005
The UK study of magnetic resonance (MR) screening for breast cancer in women at high risk (the Magnetic Resonance Imaging in Breast Screening [MARIBS] study) is a prospective, multicenter, pragmatic-effectiveness study (1). It is being undertaken in 18 UK radiology centers with a wide range of equipment and expertise in breast MR imaging. This contrasts with explanatory-efficacy studies, which have been undertaken in single centers with only a few readers. Examples of such explanatory-efficacy studies (2) are those of Kuhl et al (3) and Kinkel et al (4). Details of published data with the sensitivities and specificities in the literature to date are shown in Table 1. However, if MR imaging for breast screening were to be implemented, it would be undertaken in 779
Radiology
TABLE 1 Results from Studies of MR Screening for Breast Cancer in Women at Elevated Risk
Investigators
Country, City
MR Results
No. of Women Reported
No. of BRCA1 or BRCA2 Carriers
No. of Cancers Detected
Sensitivity (%)
Specificity (%)
236
22
77†
95.4
Warner et al (5)
Canada, Toronto
236
Kuhl et al (3, 6) Podo et al (7)
Germany, Bonn Italy, Rome
192 105
15 8
100 100
95 99
Stoutjesdijk et al (8) Tilanus-Linthorst et al (9) Kriege et al (10)
Netherlands, Nijmegen
179
13
100
89.3
Netherlands, Rotterdam
109
3
100
Netherlands (national study) UK (national study)
Leach et al (11)
1909
358
51
79.5
89.9
669
120
35
77
81
Other Modalities Tested* Mammography, examination Mammography, Mammography, examination Mammography, examination Mammography, examination Mammography, examination Mammography
US, physical US US, physical physical physical physical
* US ⫽ ultrasonography. † One case of ductal carcinoma in situ was found at mammography.
many places with radiologists of all levels of experience and so it must be robust enough for this environment (12). At the start of the MARIBS study, a symptomatic cohort was examined in each center by using the study’s MR imaging protocol to familiarize the radiologists with the reading protocol and to validate the diagnostic scoring system. Most centers also screened women at high risk for breast cancer in parallel with these cases. It should be noted that at the start of the study in 1997, the coronal plane and the method of dynamic analysis were new to many of the radiologists. In conformity with practice widespread in the UK National Health Service Breast Screening Programme, a decision was made to have all study results for both symptomatic and screening cases double reported. Thus, the purpose of our study was to determine prospectively the sensitivity and specificity of MR imaging for detection of breast cancer in a screening and in a symptomatic population by using independent double reading, with histologic or cytologic evaluation or a minimum of 1 year of follow-up as the reference standard.
MATERIALS AND METHODS The national study was supported by a grant from the UK Medical Research Council. The cost of the MR examinations was paid for from subvention funding for research from the UK National Health Service. The protocol is based in part on developments supported by Cancer Research UK and by Yorkshire Cancer Research. Contributions toward training 780
䡠
Radiology
䡠
September 2005
and education have been made by Schering Healthcare and Oracle Education. D.E. and D.T. are supported by Cancer Research UK. M.O.L. is a director at Specialty Magnetics. None of the authors have any financial interest in the companies associated with this research, and the authors alone had full control of the data used. Clinical contributors of the MARIBS study group are listed in Appendix A.
Study Population All participating patients provided written informed consent. Ethical approval was given by the North Thames Multicenter Research Ethics Committee and by the local research ethical committees for the 18 centers. Interpretations of studies from 1541 examinations were used in the reader performance analysis. Each MR study was read by two independent blinded radiologists, for a total of 3082 readings. Fortyfour radiologists contributed to this analysis by reading studies from between one and 509 examinations each (median, 37; interquartile range, 8.0 –95.5). The mean patient age at the time of the MR imaging was 42.2 years (range, 23– 81 years). This comprised 1441 examinations in 638 high-risk women aged 24 –51 years (mean age, 40.5 years) and 100 examinations in symptomatic women aged 23– 81 years (mean age, 49.2 years). The symptomatic women were recruited when the study began at each center. It had been intended that each center recruit seven women from the symptomatic clinics who were thought to have breast cancer and seven with an
indeterminate lesion in whom a histologic diagnosis would be obtained by means of excision biopsy, core biopsy, or fine-needle aspiration cytologic analysis. These women’s cases were called “symptomatic” because they were recruited through the symptomatic clinics. To this would be added the first screening MR examinations of each center (13). Centers varied in their ability to recruit such patients and in the timing at which they entered the main study. Women were not excluded from the study if they had undergone core biopsy or fine-needle aspiration cytologic analysis prior to MR imaging because evidence from the literature showed that these techniques did not interfere with MR image interpretation (14). High-risk women were defined as women known to be BRCA1 or BRCA2 or TP53 gene mutation carriers, women from carrier families, and women whose family history indicated at least a one in two risk of carrying a gene mutation. The detailed family history criteria have been published for our protocol (13). Family histories of women outside of carrier families were reviewed by a genetic panel, and only those who met the minimum criteria participated. Women who underwent genetic testing during the period of the study and received a negative result were excluded from further participation. High-risk women presenting initially with a lump were excluded, so this was a pure screening cohort. Our present analysis includes all MR examinations for double-reported symptomatic and high-risk cases undertaken from the start of screening (August 6, Warren et al
TABLE 2 Parameters for Dynamic Breast MR Imaging Techniques from the MARIBS Study
Radiology
Parameter Contrast agent dose (mmol/kg) Sequence type Repetition time (msec) Echo time (1.5 T/1.0 T) (msec) Flip angle (degrees) Field of view (mm) Acquisition plane Section thickness/gap (mm) No. of sections Matrix frequency ⫻ phase Pixel size (in plane) No. of signals acquired Fat suppression method Imaging time per repetition (sec) Total acquisition time (min) No. of repetitions Before contrast agent After contrast agent
Protocol A*
Protocol B†
0.2 Fast spoiled gradient echo, fast low-angle shot, fast field echo 10–16 4.2–5/7‡ 35 340 Coronal 2.5/0 60–64 256 ⫻ 256 and 1/2 field-ofview option§ 1.33 ⫻ 1.33§ 1 Temporal subtraction 90 10.5
0.1 Spoiled gradient echo, fast low-angle shot, fast field echo 9–14 4.2–5/7‡ 35 220 Sagittal 5.0/0 4 256 ⫻ 256
2 5
5 45
0.86 ⫻ 0.86 1 Temporal subtraction 12 10 (approximate)
* Protocol with volume (three-dimensional) dynamic MR imaging. † Protocol with multisection two-dimensional dynamic MR imaging. ‡ Fat and water in phase. § The matrix and pixel size were not always exactly 256 ⫻ 256 and 1.33 ⫻ 1.33, respectively, since these values were adapted to ensure an imaging time per repetition of 90 seconds.
1997) to before February 25, 2003. Because of the data monitoring requirements of the study, it was not possible to identify the cancers detected from highrisk screening separately from those of the symptomatic cohort prior to completion of the MARIBS study. To allow time for false-negative findings to emerge, 18 months have elapsed since the last MR examination included in our study.
MR Imaging Protocol The screening MR examination (protocol A) comprised high-spatial-resolution (512 matrix) T1-weighted sequences performed before and after contrast medium injection, with two three-dimensional coronal acquisitions of lower spatial resolution (256 matrix) before the bolus intravenous injection of 0.2 mmol of gadopentetate dimeglumine (Magnevist; Schering, Burgess Hill, UK) per kilogram of body weight and four to six acquisitions immediately after injection (Table 2) (15). An optional additional fat-suppressed T1weighted high-spatial-resolution sequence at approximately 8 minutes after injection was allowed if the supervising radiologist preferred this to a subtracted high-spatialresolution sequence late after contrast medium injection. This combination of sequences allows analysis of the time–signal intensity characteristics of any region in the imaging volume of either breast and Volume 236
䡠
Number 3
morphologic examination of high-spatialresolution images. Patients who were recalled because of an indeterminate MR study scored as “suspicious” (Appendix B) underwent either a high-temporal-resolution examination with 0.1 mmol of gadopentetate dimeglumine per kilogram of body weight (protocol B), concentrated just on the area of the breast where the abnormality was raised on the initial screening MR study (by preference, the protocol recommends that the second MR examination be performed in the sagittal plane, but the radiologist may opt for the coronal plane if this will give better diagnosis of the query), or a repeat of the initial screening MR imaging (protocol A) with 0.2 mmol of gadopentetate dimeglumine per kilogram of body weight; both of these alternatives were to be undertaken at a different phase of the menstrual cycle from the initial imaging. The choice of diagnostic pathway was made by the supervising radiologist, but, in general, diffuse or multiple abnormalities were handled by repeating protocol A and focal lesions were handled by using the hightemporal-resolution examination (protocol B), which covered only the portion of the breast determined by the supervising radiologist. Biopsy was performed in benign lesions when possible, rather than adopting a policy of surveillance, but the
study allowed for a repeat 6-month examination with protocol A (16). Full details of the MR imaging protocol are given in Table 2 and are further described in reference 15. The recall rate has been studied previously and was 10% for MR imaging (17). All participating centers had previous experience with breast MR imaging in the symptomatic setting. Forty-four radiologists took part in the MARIBS study during the time period to which these data apply. All radiologists had some experience in breast MR imaging prior to participating in the study, but no test of performance or minimum number of MR examinations was applied to individual radiologists before their participation. The only formal estimate of experience that we have is the number of studies each radiologist analyzed within our main study (median, 37; range, 1–509 of 3082 readings in the period up to February 25, 2003). The readings were performed independently by two radiologists who were blinded to clinical information, the other MR imaging findings, and the mammographic reading results and images. The headers of the MR images on computer screen in some instances contained information on patient date of birth or age, so the readers were not fully blinded to age. Dynamic data were used throughout from the console or workstation.
Scoring System A scoring system based on morphologic and dynamic contrast material uptake characteristics was devised from the literature available at the time (Appendix B shows these worksheets) (15). This scoring system had not been previously validated against histologic results, and some users found that their clinical opinion differed from the scoring results. This has been judged from the notes made on the forms or from the subsequent actions taken by the radiologists. Worksheets were also developed to ensure consistency of method in the choice of regions of interest (ROIs) and ROI analysis. The ROI size was selected by the radiologist to encompass as much of the lesion as possible. For heterogeneous lesions, the site showing the most suspicious contrast material uptake was chosen. To ensure consistency, countrywide training of participating radiologists was undertaken to explain the examination and the analysis of images. MR examinations were performed on imagers from four different manufacturers and at two field strengths, 1.0 and 1.5 T.
Dynamic Contrast-enhanced MR Imaging of the Breast
䡠
781
TABLE 3 Pathologically Proved Cancers among Lesions Analyzed
Radiology
Invasive Size (mm)
Nodes
Cancer Grade
1–10
11–20
⬎20
NA*
Negative
Positive
Not Sampled
Total
1 2 3 Not assessable DCIS only† Total
2 9 (3) 7 (1) 0 0 18
4 12 (1) 14 0 0 30
4 (1) 12 14 2 0 32
0 0 0 2 9 (2) 11
8 18 (3) 19 1 2 48
2 (1) 13 (1) 14 (1) 2 0 31
0 2 2 1 7 (2) 12
10 33 35 4 9 91
Note.—Data in parentheses are numbers of cancers not detected at MR imaging. * NA ⫽ not applicable or not known. † DCIS ⫽ ductal carcinoma in situ.
TABLE 4 Missed Cancers Case No.
Cancer Type
Invasive Size (mm)
Invasive Grade
Nodal Status
DCIS Grade; Type
DCIS Size (mm)
1 2 3 4 5 6 7 8
Ductal, NST Ductal, NST Ductal, NST Ductal, NST Lobular Lobular-tubular DCIS only DCIS only
6 16 6 5 10 23 NA NA
2 2 3 2 2 1 NA NA
0/4 0/7 1/7 3/9 0/2 1/10 NK NK
Intermediate, grade 2; solid/cribriform High/intermediate, grade 2/3; solid NA High, grade 3; solid/cribriform NA NA High, grade 3; solid/comedo High, grade 3
7 NK NA NK NA NA 9 4
Note.—DCIS ⫽ ductal carcinoma in situ, NA ⫽ not applicable, NK ⫽ not known, NST ⫽ no special type.
Pathologic Review Pathology reports were reviewed by a pathologist (S.R.L.) to classify lesions as benign or malignant. The pathologists from all 18 centers either participate in the UK breast screening program or operate to equivalent standards and participate in the pathologic and cytologic quality assurance program.
Statistical Analysis In this report we have analyzed the sensitivities and specificities for the combined readings of two radiologists and for readers 1 and 2 individually, for the original scoring system and for the subsequent radiologic opinion. Calculations of contrast material uptake parameters used in this article have been checked automatically by using the Oracle database (version 7; Oracle, Bracknell, UK) and so do not contain arithmetic errors, whereas our readers made some calculation errors on their handwritten forms. The probability that a lesion was assessed as requiring analysis and the number of lesions per analyzed image were tested against differences in the length of radiologists’ MR screening experience by 782
䡠
Radiology
䡠
September 2005
using logistic regression and Poisson regression, respectively. In both cases, the analysis was adjusted for the reading radiologist, and the sandwich variance estimator (18) was used to account for the nonindependence of the two readings of each image. Correlation between readers was determined by using statistics. Exact 95% confidence intervals (CIs) of sensitivities and specificities for malignancy were calculated on the basis of the binomial distribution. The effects of different factors on sensitivity (or specificity) were tested by using multiple logistic regression analysis. The factors included in this analysis were machine manufacturer, magnetic field strength, and patient age group. The sandwich variance estimator (18) was used to allow for the nonindependence of different images in the same woman. Statistical significance was determined at the 5% level. All analyses were carried out by using Stata software (version 8.2; StataCorp, College Station, Tex).
RESULTS Case Material From a total of 1541 MR examinations performed in 738 women, 2310 ROIs un-
derwent ROI analysis, 2268 lesions were analyzed by means of ROI but were not considered to need histologic analysis, and 91 women were found to have a malignant lesion. Details of tumor characteristics and the histologic results and MR image interpretations for the benign lesions are given in Tables 3–5. High-risk women (n ⫽ 638) remain under the care of a genetics clinic, and their disease-free status was confirmed in August 2004. Twenty-six breast cancers were detected in high-risk women during the study period under analysis. Among 352 women who have undergone one subsequent annual screening with MR imaging and/or mammography (311 with both, 32 with MR imaging alone, and nine with mammography alone), five cancers were detected at screening. Thirty-six women have undergone two subsequent annual screenings with MR imaging and/or mammography (33 with both and three with MR imaging alone), and no cancers were detected in this group. Of those who have not undergone a subsequent imaging examination or who withdrew from the study, 67 have undergone 1–2 years of follow-up and 157 have Warren et al
Sensitivity and Specificity of Readers Alone and in Combination
TABLE 5 MR Findings in 86 Lesions Proved to be Benign at Histologic Evaluation
Radiology
MR Finding Malignant (n ⫽ 19)
Histologic Diagnosis
No. of Lesions
Normal/benign at core biopsy Fibroadenoma Normal/benign at fine-needle aspiration Papilloma Phyllodes tumor Periductal mastitis/ductal ectasia Sclerosing lesions (CSL/SA), fibrocystic change Solitary cyst
Equivocal/suspicious (n ⫽ 42) Normal/benign at core biopsy Fibroadenoma, fibrocystic change Fibrocystic change, lymphocytic lobulitis Normal/benign at fine-needle aspiration Foreign body reaction Hamartoma Normal at MR-guided biopsy Papilloma Sclerosing lesions (CSL/SA), fibrocystic change Normal at US-guided biopsy Benign (n ⫽ 18) Normal/benign at core biopsy Fat necrosis Fibroadenoma Fibrocystic change Fibrosis, inflammation, hematoma Normal/benign at fine-needle aspiration Lipoma Papilloma Phyllodes tumor (borderline) Normal (n ⫽ 7) Fibrocystic change sclerosing lymphocytic lobulitis Normal/benign at fine-needle aspiration Normal/benign at fine-needle aspiration and core biopsy Sclerosing lesions (CSL/SA), fibrocystic change Total
1 3 6 1 1 2 4 1 1 11 1 22 1 2 1 1 1 1 1 1 3 1 3 6 1 1 1 1 1 1 4 86
Note.—CSL ⫽ complex sclerosing lesion/radial scar, SA ⫽ sclerosing adenosis.
undergone more than 2 years of followup. Most will have been offered annual mammography examinations outside the study during this time. One of the 91 cancers detected was classified as “suspicious” by the second reader (and as normal by the first), but it was thought that the lesion had not changed since the previous scan, so no further action was taken. The cancer arose symptomatically 9 months later. In other studies looking at the screening process, this has been classified as an interval cancer; however, in this analysis in which we are examining the scoring system, this lesion was correctly identified by the second reader. In another woman, a cancer arose 27 months after a negative scan, after which she had withdrawn from the study, and so this has not been classified as an interval cancer. No other breast cancers have been reported. In the symptomatic group (n ⫽ 100), breast cancer was diagnosed in 65 women. The 35 women whose conditions were considered normal or benign were followed up between July and SepVolume 236
䡠
Number 3
tember 2003 by contacting the breast clinics where they were treated. For all but two women, this follow-up was more than 2 years after their MR imaging assessment (for the other two women, this follow-up was 11 months and 13 months after assessment). No breast cancers have manifested in symptomatic women whose condition was originally diagnosed as normal or benign.
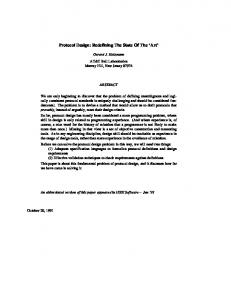
Performance Change with Experience in the Study The Figure shows the probability that a lesion required analysis, according to the reader’s experience, plotted as a 6-month moving average. The probability reduced significantly as readers’ level of experience increased (odds ratio, 0.84 per 6 months of experience; P ⬍ .001). The number of ROIs analyzed for each MR study also decreased with the length of time that the reader had participated in the study (incidence rate ratio, 0.98 per 6 months; P ⫽ .047).
Table 6 shows the sensitivities and specificities for the readings. All results given here are calculated by using the scoring system, since this was essentially the same as for radiologic opinion (data not shown). It is inappropriate to estimate the positive and negative predictive values from these data since the observed prevalence in the cohort is inflated by the inclusion of the 100 symptomatic cases. The last column of Table 6 shows the sensitivity and specificity based on the reading with the higher score (more likely to be malignant, ie, the more conservative reading) of each double-read study. The titles “reader 1” and “reader 2” reflect the order in which the readings were made, and individual radiologists may fulfill either role; they are therefore likely to be equally experienced. The two readers came to the same conclusion 87% of the time, with a moderately good statistic of 0.52 (95% CI: 0.45, 0.58). Sensitivity was on average 7% higher (95% CI: 4%, 11%) when both readers’ reports were used, but specificity was on average 7% lower (95% CI: 6%, 7%) than that for either individual reader. Exclusion of studies read by the radiologist who read 509 examinations led to a double-reader sensitivity of 90% (95% CI: 80%, 96%) and specificity of 80% (95% CI: 77%, 82%), which shows that no bias arose from this reader’s interpretations. There were 205 cases in which the two readers disagreed. One clinician was responsible for the recall decision, but in general this was based on the more conservative (the higher score) of the two readings.
Effect of Manufacturer and Field Strength on Sensitivity and Specificity We analyzed the sensitivities and specificities for MR imagers from different manufacturers and for magnetic field strength (1.0-T compared with 1.5-T equipment). Results are shown in Table 7. Results of examinations performed with MR systems from manufacturers 1 and 3 showed similar sensitivities. The lower sensitivity observed for results with manufacturer 2 was based on only seven cancers and thus had wide confidence limits. The specificity was significantly lower for manufacturer 3 than for the other two (P ⬍ .001). The two magnetic field strengths had almost identical sensitivities. The lower specificity observed
Dynamic Contrast-enhanced MR Imaging of the Breast
䡠
783
Radiology
(a) Graph of proportion of cases in which a lesion was analyzed plotted against the number of months the radiologist had worked for the study. Graph shows that the number of lesions diminished steadily with the amount of time the radiologist participated in the study. This may be due to the radiologists having concerns that enhancing highlights in premenopausal women may be clinically important lesions. With more experience, they were confident to regard these bright lesions as physiologic hormonal contrast enhancement and therefore normal (19). (b) Graph of number of recordings of ROIs in cases in which a lesion was analyzed, plotted against the number of months the radiologist has worked for the study. Graph shows that with more time participating in the study, radiologists became more confident to analyze one ROI than they were initially.
for the 1.5-T machines was significant when adjusted for machine manufacturer (P ⫽ .001). Only three cases, all of malignant lesions, were examined by using equipment from manufacturer 4 (1.5 T), and so no analysis could be undertaken for this model.
Effect of Age on Sensitivity and Specificity We further looked at the sensitivities related to the age of the woman, since any significant difference here would be of clinical importance. The median age at the time of MR imaging was 42 years (range, 23– 81 years). The sensitivity and specificity in the group of patients less than 40 years old were similar to those in the group of patients 40 – 49 years old (Table 8). There was no significant difference in sensitivity between women older than 50 years and women younger than 50 years, but the specificity was higher in women younger than 50 years (P ⫽ .02).
DISCUSSION The sensitivity achieved at MR screening by using this protocol was approximately 90%, and sensitivity was higher, but specificity was lower, when double reading rather than single reading was used. The sensitivity in this study is lower than that in some small studies but is comparable with that of the Netherlands national multicenter study (10,20). This is to be expected when 18 centers and 44 radiologists are involved, and it is probably a much more realistic assessment of the performance that might be achieved if MR screening were to be implemented 784
䡠
Radiology
䡠
September 2005
TABLE 6 Reading Results Calculated with the Scoring System Finding
Reader 1
Reader 2
Both Readers*
True-positive True-negative False-positive False-negative Sensitivity (%) Specificity (%)
73 1272 178 18 80 (71, 88) 88 (86, 89)
81 1275 175 10 89 (81, 95) 88 (86, 90)
83 1177 273 8 91 (83, 96) 81 (79, 83)
Note.—Data in parentheses are 95% CIs. * Sensitivity and specificity are based on the reading with the higher score (ie, more likely to be malignant).
for high-risk women. In breast screening in the UK, there is a preference for concluding the diagnosis of an indeterminate lesion by using biopsy, and so, where possible, this approach was preferred to surveillance for lesions found and determined to be benign but not seen at US or mammography. There was an option, however, for a 6-month follow-up with protocol A to cover the possibility that such a lesion might have a significant chance of actually being malignant (16). The number of ROIs was greater than the number of pathologic diagnoses in women. This is explained by the tendency of readers to record several ROIs by means of dynamic analysis from the enhancing lesions that they found, especially when these lesions were multifocal or heterogeneous. We were concerned that the scoring system might function differently for the numeric analysis on the different MR imager models or on equipment with different magnetic field strengths. However,
we found that neither the difference in equipment manufacturers or the field strength of the magnet materially affected the sensitivity. The specificity for equipment from manufacturer 3 was, however, lower than that for manufacturer 1. The scoring system was devised by a user of equipment from manufacturer 1, and some users of imagers from manufacturer 3 believed that their recall rate was elevated by the tendency of the scoring system to assign a suspicious or malignant score to lesions that they clinically believed to be benign. We therefore had come to suspect that the scoring system might be manufacturer specific. Although this observed difference must be interpreted with caution, given the heterogeneous nature of the case material there are theoretical reasons why the specificity may be different for equipment from different manufacturers. Because of the differences between the imagers, the pulse sequences available on the imagers, and the scaling of the signal intensities, the change in the signal inWarren et al
TABLE 7 Comparison of Performance with MR Imagers of Different Manufacturers and Field Strengths
Radiology
MR Imager Manufacturer Manufacturer Manufacturer Manufacturer 1.0 T 1.5 T
No. of Examinations
No. of Malignant Lesions
True-Positive Results
Sensitivity (%)
True-Negative Results
Specificity (%)
562 308 668 3 540 1001
38 7 43 3 39 52
36 5 39 3 36 47
95 (82, 99) 71 (29, 96) 91 (78, 97) ... 92 (79, 98) 90 (79, 97)
458 255 464 0 417 760
87 (84, 90) 85 (80, 89) 74 (71, 78) ... 83 (80, 87) 80 (77, 83)
1 2 3 4
Note.—Data in parentheses are 95% CIs. Sensitivities and specificities were based on the scoring system from the more conservative reading of the two readers.
TABLE 8 Comparison of Sensitivities and Specificities by Patient Age at MR Examination Age (y)
No. of Examinations
No. of Malignant Lesions
True-Positive Results
Sensitivity (%)
P Value*
True-Negative Results
Specificity (%)
P Value*
⬍40 40–49 ⱖ50
547 862 132
20 40 31
18 36 29
90 (68, 99) 90 (76, 97) 94 (79, 99)
... .80 .70
430 673 74
82 (78, 85) 82 (79, 85) 73 (64, 82)
... .80 .03
Note.—Data in parentheses are 95% CIs. Sensitivities and specificities were based on the scoring system from the more conservative reading of the two readers. * Compared with the patient group less than 40 years old.
tensity seen after contrast medium administration may vary between the imagers. As a result, when contrast medium is administered, the percentage of enhancement (which determines maximum focal enhancement) and maximum signal intensity–time ratio would also differ. This will affect the quantitative scores. Features dependent on quantitative scores may prove to be of limited value for differentiation when material is taken from centers with machines of different manufacturers. In contrast, the other features, such as morphologic features, pattern of enhancement, and pattern of contrast medium washout (the latter two are essentially descriptive features) may be more robust to machine differences. The details within the scoring system have been statistically evaluated in a separate analysis. We found that sensitivity did not vary by age, although the specificity was lower in women aged 50 years or older (P ⫽ .02). However, only 132 MR examinations were performed in women in the older age group, the majority of whom form part of the symptomatic group. These cases therefore may not be representative of the lesions that would be found in a screening study of women of this age. The readers were not fully blinded to the age of the patient, which may have produced a bias. A limitation of this analysis is that we Volume 236
䡠
Number 3
presented reporting performance on a study population from high-risk screening enriched by a cohort of symptomatic patients. This analysis was undertaken to validate the experimental scoring system and to show the range of diagnostic performance of the participating radiologists. A further limitation is that many of the symptomatic patients were outside the age range of the screening population, which was not as intended. The symptomatic cohort was defined as being destined to receive a cellular diagnosis and so the distribution of cases is likely to be subject to verification bias. The screening cohort was included to give sufficient power to the sensitivity calculation. The use of equipment from different manufacturers was both a limitation and a strength. The limitation is in the difficulties in the numerical values of the scoring system; the strength is in that this study represents the range of variation to be expected if high-risk screening were to become generally available. A further potential limitation of the study was the paucity of suitable biopsy equipment in the UK for obtaining a histologic diagnosis in women in whom an abnormality at MR imaging could not be identified at mammography or US. Nevertheless, non-MR imaging methods are very well developed in the UK’s National Health Service Breast Screening Programme; some cases were concluded at
surgical biopsy, and few interval cancers have emerged. There remains the possibility that additional malignant lesions have not yet had time to emerge, some of which may be ductal carcinoma in situ, since this diagnosis is subject to less distinctive MR imaging features and has a longer lead time. It might be of interest to compare the sensitivity and specificity with those achieved for mammography, but we are not able to do this as we do not have prospective readings for mammograms in the symptomatic cases. Since this is the primary end point of the full study we are not able to include those results for the screening population in this report. The results of the main trial (11) detail the sensitivity and specificity for the pure screening population for MR imaging and mammography together with the cancer detection from screening. In conclusion, readers in this study achieved acceptable levels of sensitivity and specificity that were comparable with those of the Netherlands national multicenter study. Higher sensitivity is needed in a screening context, and the double reading policy appears to achieve this. Our readers showed a change in behavior with the amount of time working within the study and recorded fewer lesions per examination and fewer analyses per lesion as level of experience increased. We found no significant differ-
Dynamic Contrast-enhanced MR Imaging of the Breast
䡠
785
Radiology
ence in sensitivity between makes of scanner or between equipment of different field strengths. Differences in specificity may reflect the loading assigned to values in the scoring system. Age had no effect on sensitivity, but for women over 50 years the specificity was not as good as that for younger women.
APPENDIX A Study Advisory Group Past and Present M. O. Leach (chairman and principal investigator), J. Brown (health economist), A. Coulthard (consultant radiologist), A. Dixon (honorary consultant radiologist), J. M. Dixon (consultant surgeon, senior lecturer), D. Easton (genetic epidemiologist), R. Eeles (honorary consultant in cancer genetics and clinical oncology), D. G. Evans (consultant geneticist), F. J. Gilbert (professor of radiology), J. Hawnaur (consultant radiologist), P. Kessar (consultant radiologist), S. R. Lakhani (professor of breast cancer pathology), S. Moss (epidemiologist), A. Padhani (consultant radiologist), A. J. Potterton (consultant radiologist), B. Ponder (professor and head of department of oncology), J. Sloane (pathologist [deceased]), L. Turnbull (clinical senior lecturer, honorary consultant), L. G. Walker (professor of cancer rehabilitation), and R. M. L. Warren (consultant radiologist).
Study Staff Past and Present L. Pointon (study coordinator), R. Hoff (assistant study coordinator), K. Chan (data manager), M. Khazen (image analysis physicist), E. Charles-Edwards (clinical physicist), R. M. L. Warren (study radiologist), J. Anderson (health psychologist), C. Levesley (psychology research assistant), J. Brown (health economist), I. Griebsch (health economist), D. Thompson (statistician), C. Hayes (study physicist), R. Gregory (study physicist), G. Charles-Edwards (MR physicist), M. Sydenham (acting study coordinator), K. Bletcher (data manager), G. P. Liney (study physicist), and B. Browne (data manager).
Data Monitoring and Ethics Committee K. McPherson (chairman and visiting professor of public health epidemiology), R. Blamey (professor emeritus and consultant breast surgeon), and S. Duffy (professor of cancer screening). 786
䡠
Radiology
䡠
September 2005
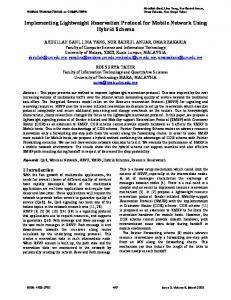
Figure B1. Worksheet 1.
Trial Steering Committee A. Howell (chairman; professor of medical oncology), D. Easton (study statistician; genetic epidemiologist), D. G. Evans (study representative; consultant geneticist), J. Husband (host institution representative; professor of radiology), E. Maher (independent member; professor of medical genetics), M. J. Michell (independent member; consultant radiologist), R. M. L. Warren (study radiologist; consultant radiologist), and W. Watson (consumer representative; founder of the Hereditary Breast Cancer Group).
MR Image Readers Data in parentheses are numbers of images read. Aberdeen: F. J. Gilbert (n ⫽ 95), G. Needham (n ⫽ 76). Barnet: G. R. Kaplan (n ⫽ 9). Belfast: J. G. Crothers (n ⫽ 9). Birmingham: C. P. Walker (n ⫽ 32). Bristol Royal Infirmary: A. Jones (n ⫽ 9).
Cambridge: P. D. Britton (n ⫽ 105), A. K. Dixon (n ⫽ 102), R. Sinnatamby (n ⫽ 5), R. M. L. Warren (n ⫽ 521). Dundee: J. M. Rehman (n ⫽ 14), D. Sheppard (n ⫽ 19). Edinburgh: J. Walsh (n ⫽ 196). Frenchay Hospital, Bristol: I. D. Lyburn (n ⫽ 23), N. F. Slack (n ⫽ 38). Glasgow: L. M. Wilkinson (n ⫽ 14). Guy’s and St Thomas’ Hospitals: S. Rankin (n ⫽ 188). Hillingdon Hospital, Middlesex: K. Raza (n ⫽ 28). Hull: P. Balan (n ⫽ 14), L. Turnbull (n ⫽ 163). Liverpool: G. H. Whitehouse (n ⫽ 47). Manchester-Christie Hospital/Nightingale Centre: C. R. M. Boggis (n ⫽ 76), E. Hurley (n ⫽ 16), A. Jain (n ⫽ 4), S. Reaney (n ⫽ 49), M. Wilson (n ⫽ 60). Manchester Medical School: J. M. Hawnaur (n ⫽ 161). Newcastle: A. Coulthard (n ⫽ 233), A. J. Potterton (n ⫽ 239). Northwick Park: B. Shah (n ⫽ 45), W. Teh (n ⫽ 69). Paul Strickland Scanner Centre, NW London: A. R. Padhani (n ⫽ 233). Royal Hospital Haslar, Gosport: P. J. Warren et al
Radiology
Sutton and St George’s: J. Husband (n ⫽ 6), K. T. Khaw (n ⫽ 1), D. MacVicar (n ⫽ 10), E. Moskovic (n ⫽ 7), J. Murfitt (n ⫽ 23).
Other Radiology and MR Staff Aberdeen: M. L. Muirhead, T. W. Redpath, S. Semple. Barnet: M. Cunningham, S. Turnell. Belfast: C. Reynolds. Birmingham: P. Fergusson, Z. Vegnuti. Bristol Royal Infirmary: S. Cowley, K. Isaacs, P. Richardson. Cambridge: J. Green, J. Pinney, C. Pittock. Dundee: S. J. Gandy, P. Martin, T. McLeay. Edinburgh: T. Lawton, I. Marshall, L. Thomson. Frenchay Hospital, Bristol: H. Albarran, V. Blake, J. Robson. Glasgow: M. Cockburn. Guy’s and St Thomas’ Hospitals: J. Goodey, R. Lund, K. McBride. Hull: S. Hunter, G. Liney. Liverpool: J. Chance, J. Davies, Z. Hussain. Manchester-Christie Hospital/ Nightingale Centre: N. Brown, C. Hammond, W. Johnson. Manchester Medical School: J. E. Adams, Y. Watson. Newcastle: P. English, L. Lewis, M. Myers. Northwick Park: D. Fox, J. Johnson, J. Shah. Paul Strickland Scanner Centre, NW London: L. Culver, R. Sale, J. J. Stirling, N. J. Taylor. Royal Hospital Haslar, Gosport: E. Boyd, J. Evans, W. Johnston, S. Lindsay, R. MacKenzie, B. Tailor, L. Watts. Southampton: A. Darekar, S. King, N. Shepherd. Sutton and St George’s: G. Charles-Edwards, E. Charles-Edwards, E. Scurr (on behalf of all the radiographers, Sutton). Figure B2.
Buxton (n ⫽ 2), J. M. Domjan (n ⫽ 2), P. A. L. Gordon (n ⫽ 6). Southampton: M. Briley (n ⫽ 31), C. Rubin (n ⫽ 35). Royal Marsden and St George’s Hospitals: P. Kessar (n ⫽ 169). University College Hospital: M. A. Hall-Craggs (n ⫽ 8).
Conventional Mammogram Readers Data in parentheses are numbers of images read. Aberdeen: H. E. Deans (n ⫽ 33), K. Duncan (n ⫽ 36), L. Gomersall (n ⫽ 23), G. Iyengar (n ⫽ 3). Barnet: G. R. Kaplan (n ⫽ 3). Belfast: J. G. Crothers (n ⫽ 6), J. McAllister (n ⫽ 9), J. M. Kirby (n ⫽ 1). Birmingham: S. Bradley (n ⫽ 33), M. G. Wallis (n ⫽ 32). Bristol Royal Infirmary: J. E. Basten (n ⫽ 4), E. Kutt (n ⫽ 4). Cambridge: P. D. Britton (n ⫽ 149), R. Davies (n ⫽ 5), C. D. R. Flowers (n ⫽ 9), A. H. Freeman (n ⫽ 148), D. O’Driscoll (n ⫽ 4), R. Sinnatamby (n ⫽ 189), R. M. L. Warren (n ⫽ 246). Dundee: A. M. Cook Volume 236
Lead Geneticists and Recruiters
Worksheet 2.
䡠
Number 3
(n ⫽ 13), C. M. Walker (n ⫽ 13). Edinburgh: A. Buttimer (n ⫽ 41), A. Gilchrist (n ⫽ 28), B. B. Muir (n ⫽ 106), J. Murray (n ⫽ 90), L. Smart (n ⫽ 4), M. Smith (n ⫽ 17). Glasgow: C. Cordiner (n ⫽ 12), J. Litherland (n ⫽ 12). Guy’s and St Thomas’ Hospitals: A. Jones (n ⫽ 34), S. McWilliams (n ⫽ 60). Hull: A. E. Hubbard (n ⫽ 116). Liverpool: A. Ap-Thomas (n ⫽ 1), D. A. Ritchie (n ⫽ 28), F. White (n ⫽ 26). Manchester-Christie Hospital/Nightingale Centre: D. L. Asbury (n ⫽ 46), U. Beetles (n ⫽ 9), C. R. M. Boggis (n ⫽ 178), R. Dobrashian (n ⫽ 3), M. D. J. Harake (n ⫽ 15), E. Hurley (n ⫽ 26), A. Jain (n ⫽ 15), S. Reaney (n ⫽ 72), M. Wilson (n ⫽ 106). Newcastle: B. Kaye (n ⫽ 36), M. McElroy (n ⫽ 145), L. McLean (n ⫽ 107), W. Wotherspoon (n ⫽ 171). Northwick Park: G. Markham (n ⫽ 3). Southampton: A. Bisset (n ⫽ 2), S. Hegarty (n ⫽ 31), G. Michaels (n ⫽ 33), N. Robson (n ⫽ 3).
Aberdeen: N. E. Haites. Belfast: P. J. Morrison. Birmingham: T. Cole. Bristol Royal Infirmary: Z. Rayter. Cambridge: J. Mackay. Dundee: D. Goudie. Edinburgh: M. Steel. Frenchay Hospital, Bristol: S. J. Cawthorn, M. Shere. Glasgow: R. Davidson. Guy’s and St Thomas’ Hospitals: S. V. Hodgson, S. Watts. Leeds: C. Chu, G. Turner. Liverpool: I. Ellis. Manchester Regional Genetics Service: D. G. Evans. Newcastle: F. Douglas. Northwick Park: J. Paterson. Sheffield: O. W. J. Quarrell. Southampton: D. M. Eccles. Sutton and St George’s: R. A. Eeles.
Other Genetics and Clinical Staff Aberdeen: B. Gibbons, H. Gregory, M. McJannett, L. McLennan. Belfast: L. Jeffers. Birmingham: L. Burgess, C. McKeown, J. E. V. Morton. Bristol Royal Infirmary: Z. Rayter. Cambridge: L. G. Bobrow, S. Downing, S. Everest, A. Middleton, B. Newcombe, J. Rankin. Dundee: D. Young. Edinburgh: E. D. C.
Dynamic Contrast-enhanced MR Imaging of the Breast
䡠
787
Radiology
Anderson, J. Campbell, J. M. Dixon, P. Walsh. Frenchay Hospital, Bristol: S. J. Cawthorn, C. Dawe. Glasgow: C. M. Watt. Leeds: E. Hazell, L. Rae. Liverpool: J. Birch, C. Holcombe, S. Holcombe, K. Makinson. Manchester Regional Genetics Service: G. Hall, A. Shenton. Newcastle: G. Seymour. Northwick Park: C. Cummings, L. Jackson. Sheffield: J. A. Cook, D. Kumar. Southampton: G. Crawford, S. Goodman. Sutton and St George’s: A. Ardern-Jones, C. Brewer, C. Chapman, D. L. Christensen, R. C. Coombes, S. Furnell, S. Gray, G. Gui, M. W. Kissin, F. Lennard, A. M. Lucassen, K. McReynolds, M. W. E. Morgan, U. Querci della Rovere, N. Rahman, S. Shanley, N. Sodha, A. Stacey-Clear, C. Webster.
Local Coordinators Aberdeen: B. Gibbons, M. McJannett, M. L. Muirhead. Belfast: L. Jeffers. Birmingham: L. Burgess, T. Cole. Bristol Royal Infirmary: S. Cowley. Cambridge: S. Downing, J. Green, B. Newcombe. Dundee: D. Young. Edinburgh: J. Campbell, P. Walsh. Frenchay Hospital, Bristol: C. Dawe, M. Shere. Glasgow: C. M. Watt, L. M. Wilkinson. Guy’s and St Thomas’ Hospitals: J. Goodey, K. McBride, S. Watts. Hull: S. Hunter. Leeds: E. Hazell. Liverpool: S. Holcombe, K. Makinson. Manchester Regional Genetics Service: G. Hall, A. Shenton. Newcastle: L. Lewis, G. Seymour. Northwick Park: C. Cummings, L. Jackson. Royal Hospital Haslar, Gosport: J. Evans, H. Stansby. Sheffield: O. W. J. Quarrell. Southampton: G. Crawford, S. Goodman. Sutton and St George’s: S. Gray, F. Lennard.
APPENDIX B Worksheets (Figs B1, B2) were devised with procedures for using the scoring system based on morphologic and dynamic contrast material uptake characteristics.
788
䡠
Radiology
䡠
September 2005
Acknowledgments: The MARIBS study is a countrywide collaboration of 18 genetics centers in the UK and their associated MR imaging and mammography departments. Key clinical contributors are listed in Appendix A, and we acknowledge the work of many others—radiographers, nurses, clerical staff, physicists, engineers—whose contribution is important but who have not been named. Special thanks to the women who participated in the study and to the surgeons and oncologists who referred them, without whom the study would not have been possible. References 1. MacRae KD. Pragmatic versus explanatory trials. Int J Technol Assess Health Care 1989; 5(3):333–339. 2. Fuhrer MJ. Overview of clinical trials in medical rehabilitation: impetuses, challenges, and needed future directions. Am J Phys Med Rehabil 2003; 82(10 suppl):S8 – S15. 3. Kuhl CK, Schmutzler RK, Leutner CC, et al. Breast MR imaging screening in 192 women proved or suspected to be carriers of a breast cancer susceptibility gene: preliminary results. Radiology 2000; 215(1): 267–279. 4. Kinkel K, Helbich TH, Esserman LJ, et al. Dynamic high-spatial-resolution MR imaging of suspicious breast lesions: diagnostic criteria and interobserver variability. AJR Am J Roentgenol 2000; 175(1):35– 43. 5. Warner E, Plewes DB, Hill KA, et al. Surveillance of BRCA1 and BRCA2 mutation carriers with magnetic resonance imaging, ultrasound, mammography, and clinical breast examination. JAMA 2004;292:1317– 1325. 6. Kuhl CK. High-risk screening: multi-modality surveillance of women at high risk for breast cancer (proven or suspected carriers of a breast cancer susceptibility gene). J Exp Clin Cancer Res 2002; 21(3 suppl): 103–106. 7. Podo F, Sardanelli F, Canese R, et al. The Italian multi-centre project on evaluation of MRI and other imaging modalities in early detection of breast cancer in subjects at high genetic risk. J Exp Clin Cancer Res 2002; 21(3 suppl):115–124. 8. Stoutjesdijk MJ, Boetes C, Jager GJ, et al. Magnetic resonance imaging and mammography in women with a hereditary risk of breast cancer. J Natl Cancer Inst 2001; 93(14):1095–1102. 9. Tilanus-Linthorst MM, Obdeijn IM, Bartels KC, de Koning HJ, Oudkerk M. First experiences in screening women at high risk for
10.
11.
12. 13.
14.
15.
16.
17.
18.
19.
20.
breast cancer with MR imaging. Breast Cancer Res Treat 2000; 63(1):53– 60. Kriege M, Brekelmans CT, Boetes C, et al. MRI screening for breast cancer in women with high familial and genetic risk: first results of the Dutch MRI screening study (MRISC) (abstr). J Clin Oncol 2003; 21(23 suppl):238. Leach MO, Boggis CR, Dixon AK, et al. Screening with magnetic resonance imaging and mammography of a UK population at high familial risk of breast cancer: a prospective multicentre cohort study (MARIBS). Lancet 2005;365:1769 –1778. Warren R. Is breast MRI mature enough to be recommended for general use? Lancet 2001; 358(9295):1745–1746. Brown J, Coulthard A, Dixon A, et al. Protocol for a national multi-centre study of magnetic resonance imaging screening in women at genetic risk of breast cancer. Breast 2000;9:78 – 82. Kristoffersen Wiberg M, Bone B, Aspelin P. The potential influence of fine-needle aspiration on MR imaging of the breast. Acta Radiol 2000; 41:222–226. Brown J, Buckley D, Coulthard A, et al. Magnetic resonance imaging screening in women at genetic risk of breast cancer: imaging and analysis protocol for the UK multicentre study. Magn Reson Imaging 2000; 18(7):765–776. Liberman L, Morris EA, Benton CL, Abramson AF, Dershaw DD. Probably benign lesions at breast magnetic resonance imaging: preliminary experience in high-risk women. Cancer 2003; 98(2):377–388. Warren RM, Pointon L, Caines R, Hayes C, Thompson D, Leach MO. What is the recall rate of breast MRI when used for screening asymptomatic women at high risk? Magn Reson Imaging 2002; 20(7):557– 565. Huber P. The behavior of maximum likelihood estimates under non-standard conditions. In: Proceedings of the Fifth Berkeley Symposium on Mathematical Statistics and Probability, 1967. Berkeley, Calif: University of California Press, 1967; 221–223. Kuhl C, Bieling H, Gieseke J, et al. Healthy premenopausal breast parenchyma in dynamic contrast-enhanced MR imaging of the breast: normal contrast medium enhancement and cyclical-phase dependency. Radiology 1997;203:137–144. Kriege M, Brekelmans CT, Boetes C, et al. Efficacy of MRI and mammography for breast-cancer screening in women with a familial or genetic predisposition. N Engl J Med 2004; 351(5):427– 437.
Warren et al