13th Computer Control for Water Industry Conference, CCWI 2015 ... significant financial cost to water companies because of the loss of treated water, and repair ... variability in pressure and flow signals returned from online sensors will reflect ...
Available online at www.sciencedirect.com
ScienceDirect Procedia Engineering 119 (2015) 13 – 18
13th Computer Control for Water Industry Conference, CCWI 2015
Real-time burst detection in water distribution systems using a Bayesian demand forecasting methodology Christopher Huttona,b and Zoran Kapelanc a
Water and Environmental Management Research Centre, Queen’s School of Engineering, University of Bristol, UK b School of Geographical Sciences, University of Bristol, UK; cCentre for Water Systems, University of Exeter, UK
Abstract The negative consequences of non-revenue water losses from Water Distribution Systems (WDS) can be reduced through the successful and prompt identification of bursts and abnormal conditions. Here we present a preliminary investigation into the application of a probabilistic demand forecasting approach to identify pipe bursts. The method produces a probabilistic forecast of future demand under normal conditions. This, in turn, quantifies the probability that a future observation is abnormal. The method, when tested using synthetic bursts applied to a demand time-series for a UK WDS, performed well in detecting bursts, particularly those >5% of mean daily flow at night time. © by Elsevier Ltd. This an open access ©2015 2015Published The Authors. Published byisElsevier Ltd. article under the CC BY-NC-ND license (http://creativecommons.org/licenses/by-nc-nd/4.0/). Peer-review under responsibility of the Scientific Committee of CCWI 2015. Peer-review under responsibility of the Scientific Committee of CCWI 2015
Keywords: Pipe Burst, Detection, Demand Forecast, Bayesian Statistics, Anomaly Detection, Probability
1. Introduction Non-revenue water losses in Water Distribution Systems (WDS) resulting from background leakages and pipe burst events come at significant financial cost to water companies because of the loss of treated water, and repair costs. Furthermore, substantial leakages can result in customer service interruptions, resulting in further costs to the water company. As a result of these issues, coupled with additional pressures on water supply resulting from population growth and climatic changes, there is a need to detect pipe bursts as soon as is possible, thereby reducing water loss, associated costs, and service disruption to consumers. Developments in hydraulic sensor technology and on-line data acquisition systems has enabled water companies to collect larger, and more accurate datasets to understand the state of their distribution networks. In turn, a number of methods and algorithms have been developed that attempt to utilize these data to detect bursts [1, 2, 3, 4, 5]. The variability in pressure and flow signals returned from online sensors will reflect changes in both consumer demand
1877-7058 © 2015 Published by Elsevier Ltd. This is an open access article under the CC BY-NC-ND license
(http://creativecommons.org/licenses/by-nc-nd/4.0/). Peer-review under responsibility of the Scientific Committee of CCWI 2015
doi:10.1016/j.proeng.2015.08.847
14
Christopher Hutton and and Zoran Kapelan / Procedia Engineering 119 (2015) 13 – 18
and abnormal demand (e.g. bursts and leaks). Thus, methods for burst detection are often based on analysis of the difference between measured demand and a forecasted water demand, derived under (assumed) normal, non-burst conditions [1]. Such detection methods need to make an appropriate trade-off; they need to differentiate between normal and abnormal demand successfully in order identify real bursts, whilst also avoiding false alarms. The quality of this tradeoff, and therefore the accuracy of burst detection, ultimately depends on the accuracy of the demand forecast. Demand forecasting is, however, highly uncertain, due to a range of socio-economic factors that affect demand, and limited meter penetration in many countries, which limits the accuracy of any forecast. To make appropriate use of demand forecasts to identify bursts, and achieve an appropriate trade-off in burst detection, an understanding of forecast accuracy is beneficial. This paper presents the first stage in the development of a methodology for burst detection based on a probabilistic demand forecasting approach [6]. The approach utilizes the probabilistic forecast of future normal demand to quantify the likelihood of abnormal conditions. We compare the performance of two probabilistic approaches for quantifying demand uncertainty when applied to detect bursts: the first, based on a Gaussian assumption of residual errors in the demand forecast; the second, based on a heavy tailed, heteroscedastic quantification of future demand uncertainty. Section 2 describes the methodology, which in this paper is initially applied to a synthetic case study, based on a District Meter Area (DMA) in the UK (Section 3).
2. Methodology The methodology here is developed for the detection of abnormal conditions (e.g. pipe bursts) from sensor measurements in a DMA, which for narrative purposes are here assumed to be pipe flows. In order to identify abnormal conditions the methodology calibrates a model to forecast future pipe flows from a given sensor, based on past recorded values, which are assumed to have been recorded under normal conditions (e.g. no burst). Once applied online, the residual difference (ε) between the forecasted pipe flow and the actual observed pipe flow can be used to infer whether a burst has occurred. A deterministic forecast of future flow, however, provides no information on predictive uncertainty, which might compromise the accuracy of burst detection if, at a particular forecast time, the model forecast error is large, and therefore dominates ε. Hutton and Kapelan (2015) [6] developed a probabilistic approach for the development of demand forecasting models, to derive a statistically robust description of model forecast errors. Here, instead of using a deterministic forecast error, the probabilistic description of prediction uncertainty is used as the base metric upon which to detect burst conditions.
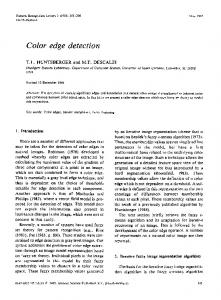
Fig. 1. Probabilistic forecast of future flow under normal conditions (green distribution) at time t; Observed flow at time t (vertical orange line); probability of observing larger flow than observed, under normal conditions (blue shaded area).
15
Christopher Hutton and and Zoran Kapelan / Procedia Engineering 119 (2015) 13 – 18
At a given observation time (t) the observed pipe flow is compared to the model forecast prediction uncertainty, which represents the probability distribution of observing a given pipe flow (Q) under normal, non-burst conditions (Figure 1). Comparing the observed flow (Qobs) to the probabilistic forecast under normal conditions (Qn) provides the probability that a flow at least as large as the observed flow would have occurred under normal conditions: P(Qn > Qobs). Thus, as P(Qn > Qobs) tends towards zero there is, according to the demand forecast under normal conditions, an increasing probability that the observed flow has occurred under abnormal conditions. Therefore 1 P(Qn > Qobs), or P(Qn < Qobs) gives a probability that the observation represents abnormal conditions, and therefore a burst has occured. It is on the basis of this metric, calculated at each forecast time-step that a detection methodology is proposed.
3. Case Study The case study is located in a DMA in the UK, with a mean consumption of 27ls -1, a single inlet, no outlets and no internal storage. The observed inlet flow, which is assumed therefore to represent total DMA demand, is used as the basis for demand forecasting, and therefore burst detection. As presented in Hutton and Kapelan (2015) [6], an iterative methodology was applied to develop a one-hour-ahead demand forecasting model for the DMA, based on previously normalized observed flows, which are assumed to have occurred under normal conditions:
Qt
D f �D1Qn t �1 � D24Qn t � 24 � D72Qn t � 72 � D168Qn t �168
(1)
where Qt is forecasted flow at time t, α are calibration parameters, Df is a normalization constant, Qn is normalized flows, and the subscript numbers refer to the time-lag in hours (See [6] for a complete description of the model). The model was calibrated and applied within a formal Bayesian framework using two probabilistic models for the residual error (Figure 2): first, based on a conventional Gaussian model of the residual errors; second, using a heteroscedastic, heavy tailed residual distribution with 2 auto-correlation terms (herein referred to as the HHT model) to derive a more statistically robust description of forecasting errors [6].
16
Christopher Hutton and and Zoran Kapelan / Procedia Engineering 119 (2015) 13 – 18 Fig. 2. Forecasted prediction bounds used for burst detection derived using equation 1, when coupled with a Gaussian error model (top) and a heavy tailed, heteroscedastic error model, with autocorrelation terms (bottom).
Following the calibration period, synthetic bursts of varying magnitude – 1, 5, 10, and 20% of mean daily flow – were added to each time-step of the validation period. For each time-step, P(Qn < Qobs) was calculated using both methods for quantifying model forecasting uncertainty (Figure 2). Figure 3 shows the probabilities that the observed flow exceeds the forecasted normal flow for 4 different burst magnitudes, and for both error models. As the burst magnitude increases, P(Qn < Qobs) tends towards 1 for all times of day. This results because larger burst magnitudes are more likely to exceed the normal flow forecast. Because the Gaussian error model makes the assumption of equal variance in flow across all times of day, there is little difference in the mean value of P(Qn < Qobs) as a function of time of day. In contrast, using the HHT distribution, P(Qn < Qobs) tends towards 1 much faster during night time compared to daytime hours for an increase in burst magnitude. This result because the HHT approach is better at capturing night time flow uncertainty [6], and is therefore better at distinguishing abnormal conditions.
Christopher Hutton and and Zoran Kapelan / Procedia Engineering 119 (2015) 13 – 18 Fig. 3. Probability that observed flow exceeds forecasted flow under normal conditions, and therefore the probability that flow is abnormal, plotted as a function of the time of day (hours), for the heteroscedastic error model (left column), Gaussian error model (right column), and for different burst magnitudes: 1% (1st row), 5% (2nd row), 10% (3rd row) and 20% (4th row) of daily mean flow (27ls-1).
A more full evaluation of the method requires consideration of how the probabilistic approach classifies observed flows as either normal or abnormal. Such a binary classifier typically requires a threshold within the decision variable to differentiate between normal or abnormal conditions. If the classification was based on the raw residual value, an arbitrary threshold would be required. In the probabilistic approach applied here, however, in theory the threshold P(Qn < Qobs) = 1 should be applied as anything lower than this threshold cannot be ruled out as normal flow. However, there are two reasons why this may not be the case: first, as demonstrated in [6], the statistical approaches applied in deriving the probability of normal flow – the forecast – are not perfect; second, bursts will occur that are within the range of normal flows. Figure 4 shows ROC curves for both the Gaussian and HHT error model plotted for detection thresholds where P(Qn < Qobs) was varied on the interval [0, 1], and also plotted as a function of burst magnitude. As the burst magnitude increases, so does the performance of both classifiers in successfully identifying bursts. At smaller burst magnitudes, and higher threshold values (that produce low false positive rates), the HHT model performs better in identifying bursts, which results from the heteroscedastic model that produces tighter uncertainty bounds at night (Figure 2; Figure 3). The Gaussian model performs slightly better at higher burst magnitudes, which likely results as the Gaussian prediction bounds are slightly tighter during the middle of the day. Both methods perform better at night, and produce a good discrimination between true bursts and false positives, particularly for burst magnitudes greater than 5% of mean daily flow.
Fig. 4. Receiver Operating Characteristic (ROC) curves plotted for the Gaussian (Gauss) error model and Heteroscedastic Heavy Tailed (HHT) error model. The curves are plotted for different burst magnitudes (see symbols), as a percentage of mean daily flow, for all time-steps (left), and for night time (right figure).
17
18
Christopher Hutton and and Zoran Kapelan / Procedia Engineering 119 (2015) 13 – 18
4. Conclusions Prompt identification of abnormal conditions is important in Water Distribution System management. This paper has demonstrated the potential of applying a probabilistic demand forecast for the identification of abnormal conditions in a WDS. Both methods for quantifying demand uncertainty perform well, particularly at night time in identifying bursts greater than 5% of mean daily flow. A more realistic representation of residual errors in the form of a HHT model performed better in discriminating between bursts and non-bursts at plausible values of the probabilistic threshold (e.g. closer to 1). Further work is required to extend the potential shown in these preliminary results to improve the detection of small bursts. The method will be extended by increasing the forecast lead time, which will allow the combination of normal flow exceedance probabilities across time-steps. Such an approach will have more discriminatory power in identifying smaller bursts that occur within the distribution of normal flow.
Acknowledgements The data used in the paper have been collected as part of the Neptune project funded by the UK Engineering and Physical Sciences Research Council (EP/E0003192/1) and provided by Mr Ridwan Patel from Yorkshire Water services which is gratefully acknowledged. References [1] G. Ye, A. Fenner, Weighted Least Square with Expectation-Maximization Algorithm for Burst Detection in U.K. Water Distribution Systems, Journal of Water Resources Planning and Management (2014) 417-424. [2] M. Romano, Z. Kaplena, D.A. Savic, Evolutionary Algorithm and Expectation Maximization Strategies for Improved Detection of Pipe Bursts and Other Events in Water Distribution Systems, Journal of Water Resources Planning and Management (2014) 572-584. [3] M. Romano, Z. Kaplena, D.A. Savic, Automatic Detection of Pipe Bursts and Other Events in Water Distribution Systems, Journal of Water Resources Planning and Management (2014) 457-467. [3] S.R.Mounce, R.B.Mounce, T.Jackson, J. Austin, J.B. Boxall, Pattern matching and associative artificial neural networks for water distribution system time series data analysis, Journal of Hydroinformatics (2014) 16:617-632. [4] D.Jung, K.Lansey, Water Distribution System Burst Detection Using a Nonlinear Kalman Filter, Journal of Water Resources Planning and Management (2014) 141(5). [5] D-L. Xu, J. Liu, J-B. Yang, G-P. Liu, J. Wang, I. Jenkson, J. Ren, Inference and learning methodology of belief-rule based expert system for pipeline leak detection, Expert Systems with Applications (2007) 32(1):103-113 [6] C.J. Hutton, Z.Kapelan. A probabilistic methodology for quantifying, diagnosing and reducing model structural and predictive errors in short term water demand forecasting, Environmental Modelling and Software (2015) 66:87-97