Feb 28, 1994 - Adaptive differential pulse code modulation is investigated as a method of reducing .... techniques such as linear predicting coding (LPC). More.
(
Physiological measurement
Real-time compression of myoelectric data utilising adaptive differential pulse code modulation J. F. Norris
D.F. Lovely
Institute of Biomedical Engineering, University of New Brunswick, Canada
Abstract--The myoelectric signal, obtained by either surface or needle electrodes, is used in many areas of clinical research and diagnosis. The conventional method of storing such information is in digitised form on a computer. However, the bandwidth of the signal and the required resolution result in large memory requirements. Adaptive differential pulse code modulation is investigated as a method of reducing the memory requirements for myoetectric data storage. In this scheme, a 12-bit sample is reduced to four bits, thus reducing the memory requirements by a factor of three. In reality, this compression ratio is closer to 4: 1 owing to the fact that the widths of most memories are organised as multiples of eight bits.
Keywords~ADPCM, Data compression, Data storage, MyoelectrJc signal, Real-time DSP
\
M e d . & Biol. Eng.& Comput., 1995, 33, 629-635
J
1 Introduction THE DIGITISATIONof analogue signals is a three-step process. First, the analogue signal is sampled at discrete time intervals, and secondly these samples are quantised into discrete levels. Finally, these levels are coded into a binary sequence which is subsequently stored. The resulting bit stream is called pulse code modulation (PCM). The bit rate of the PCM signal depends on both the sampling rate and the number of discrete levels in the quantisation process. The sampling rate f, is determined by the bandwidth of the analogue signal through the Nyquist criterion. This states that in order to reproduce an analogue signal faithfully, the sampling rate should be at least twice that of the highest frequency component The number of quantisation levels determines the resolution of the digitisation process. As each quantisation level is represented by a unique code, resolution becomes a function of the code length N. The step size Ay between levels is called the quantisation width, and it is inversely proportional to the number n of quantisation levels. In a binary code system, n = 2N - 1. The amplitude difference between the sampled signal and the nearest discrete level gives rise to a form of distortion known as quantisation noise. Consequently, the level of quantisation noise can be reduced by making the quanfisation width Ay small, which in turn increases the code length N. In the case of biomedical signals such as the myoelectric activity from muscles, typical bandwidths for surface recording lie in the region 10 Hz-1 kHz. Consequently, these signals demand sampling rates in excess of 2 kHz, typically 3 kHz. In addition, because of the wide dynamic range of the myoelectric
signal (iVIES), 12-bit resolution (N= 12) has become a de facto standard. Consequently, the PCM bit rate for such a scheme is of the order of 36 kbit s -~ . As memory storage is usually in the format of two byte words (16 bits), this corresponds to approximately 3 kwords per second. To store 1 rain of MES requires 360 kbytes of memory. The Institute of Biomedical Engineering has recently been involved in an ergonomic study that focuses on the prevention of back injury in hospital staff. This has involved the design and development of a portable data logger to acquire several parameters, including muscle activity in the lower back (LOVELYet aL, 1993). All data collected are stored in a nonvolatile memory module, which is later retrieved for downloading to a host computer. At present, only the peak mean absolute value of the myoelectric data is logged, owing to the storage limitations (128 kbytes) of the data module. Consequently, the work reported in this paper was performed to ascertain the feasibility of applying data compression techniques to myoelectrie data in real time. In this way, the capability of the data logger could be expanded to the collection of
unprocessed myoelectric data.
2 Data compression A data-compression algorithm seeks to minimise the number of bits stored by reducing the redundancy present in the
original signal.A figure of merit for such a scheme is naturally the reduction in storage requirement, or compression factorCE This is usually expressed as a percentage, as shown below: CF(%)
First received 28 February 1994 and in final form 77 October 1994
IFMB~ 1995
Medical & Biological Engineering & Computing
=
U~ - q
u,
x
I00
O)
where Us is the original data size (bytes) and Cs is the compressed data size Coytcs). However, this data compression
September 1995
629
I
~
I
J/lI
.L..~L-2
I
l
(
~*~'I
u'v
t
I
I/I
I
I
g__2
;
;
I/
t sign~it
multiplier
1
1
~
0
0
o
0
0
1 1
0 0
o I 0
0 I I
o I 0
[i ~
I
I"-..L
[
1 0 0 1
1 0 1 0
The LZW technique uses a fixed size table (4 kbytes) or dictionary in which the first 256 are initialised to the standard ASCII values. The remaining table is used to hold substring codes. These substrings are formed by the concatenation of the current character and existing string. The advantage of this technique is that the complete dictionary table is implicitly coded within the data.
I
t
I
i
1
l 1 0 0 1
I
I
I I'~ 4-bit !~ ADPCM cooke
increased
y. = y~, _+,~lymultiplier
Fig. 1 ADPCMprinciples must be achieved while maintaining the fidelity of the decompressed signal. Therefore, the performance of arty compression algorithm depends very much on the type of data being processed.
2.1 Lossy data reduction There are data reduction algorithms which only attempt to retain data points which contain significant information. This approach, called lossy reduction, has become popular in ECG compression in which the majority of the clinical information is associated with the PQRST complex. One such lossy algorithm, designed for ECG rhythm analysis, is AZTEC (amplitude zone time epoch coding) (COx et aL, 1968). This technique decomposes the ECG waveform into a series of plateaux and slopes. The data array thus produced is an akemating sequence of durations and amplitudes. The reconstruction process employs a sequence of line segments to form a pieeewise-linear approximation to the original waveform. Clearly the compression factor of this technique depends very much on the data structure. In the case of the ECG waveform, where the signal amplitude between PQRST complexes approximates a plateau, this technique can result in compression factors as great as ten or more. However, for the myoeleetric signal, in which the signal can be modelled as bandlimited white noise, this technique is not applicable. 2.2 Huffman coding Huffman coding (I-IUFFMAN, 1952) is based on the statistics of data. Data reduction is achieved by assigning variable length codes to the quantised (PCM) data sequence based on the frequency of occurrence. To do this, a translation table needs to be constructed, usually vLa a binary tree algorithm, and it must be stored with the compressed data. However, the technique is Iossless, in that the compressed data can be restored to its original form without error. As the codes in the Huffman algorithm are based on the statistics of the data, it is necessary to examine the entire data set before compression. This naturally precludes the application of Huffman coding from real-time operation. To circumvent this problem, various adaptive schemes based on Huffman coding have been evolved which attempt to build the translation table as data become available. One such adaptive scheme is the Lempel-Ziv-Welch (LZW) algorithm (NELSON, 1989) which has become popular through the commercial PKZIP* software. * PKware, Glendale, WI, 53217, USA 630
2.3 Differential PCM In differential pulse code modulation (DPCM), the amplitude difference between two successive samples is coded, rather than the absolute value. The performance of such a scheme relies on the assumption that the amplitudes of neighbouring samples are not statistically independent. Thus, the dynamic range of the amplitude difference between the samples is much smaller than the absolute range. Therefore, the difference information can be coded with fewer bits without a significant toss in resolution. If this concept is taken to the limit, with the coding as a single bit (N= 1) to indicate the polarity of the difference, this scheme is called delta modulation (AM). Both DPCM and AM suffer from one major drawback regarding the rate of change of the input signal. If the input rate of rise is greater than the dynamic range of the coder, then a condition known as slope overload occurs. This situation causes substantial distortion in the data reconstitution process. 2.4 Adaptive differential pulse code modulation The problem associated with slope overload can be overcome by employing an adaptive scheme, in which the quanfisation width Ay is allowed to vary. In the case of adaptive delta modulation (ADM), if slope overload is encountered, then Ay is increased by a fixed increment. If slope overload is still encountered, Ay is further increased. In this way, the Ay tracks the input signal and minimises the effeert of slope overload. A large Ay is employed when the data amplitude is changing rapidly, whereas a small Ay is used for slowly changing data. This concept of employing an adaptable quantisation width has been extended to DPCM. In adaptive differential pulse code modulation (ADPCM), Ay is determined by, correlation analysis of several past data samples. A prediction is made of the amplitude of the next sample; consequently the quantisadon width is adjusted accordingly.. The coding scheme then stores a polarity bit p and a quantisation width multiplication factor m, which is typically three bit~. Thus a stream of N-bit word PCM data can be reduced to a sequence of four-bit differences. The compression factor is typically N/4. On decompression, the stored ADPCM data is not only used to calculate the appropriate PCM values, but also to set the quantisation width Ay for the next sample. This technique has been applied to the compression of sampled speech data and has formed the basis of several solidstate speech recorders (CIARClA, 1983; EVANS and FENNER, 1987). The advantage of such a scheme is the high quality of the reconstructed speech, compared with that of other techniques such as linear predicting coding (LPC). More recently, this approach has been applied to the compression of EEG data (HINRICrlS, 1991). In this work all data processing was performed on a PDP 11/73 mini-computer; however, Hinrichs suggested that on-line compression using a PC-type machine was possible. It is uncertain whether this system could be applied to the compression of myoelectric data, owing to the increased bandwidth requirements.
Medical'& Biological Engineering & Computing
September 1995
onojnal _~ analogue data
LPF
i I
ADC
F--](~"]'~'~
PAR/SER lql~reglster~
1 1 d~= amplifier
ADPCM wocessi~g r-" . . . . . . . .
I
I
' ' i ' '
1
lsynme=si T! . . . .
I----.4.------..IL . . . . . . ~ *bit 4 6
I
[
~
data~
~.A~I
I
control
--J ~ ~mo ~=og~
data
~r~ora~ o,,,~ =~,=,.t~,~,~ ......
test
generator
Fig. 2
ADPCM
clock
An investigation into the use of ADPCM in the compression of myoelectric data in real time requires the computational power of a dedicated digital signal processor (DSP). However, several such processors are currently available for speech storage and retrieval systems. This work made use of such hardware so that existing ADPCM software algorithms could be exploited.
3.1 Hardware system and control software Dedicated hardware was designed around ttie MSM5218 Speech Analysis/Synthesis integrated circuit from Old Semiconductor~. This device is available in a 24-pin plastic package at a cost of US $6.75, and it provides all the required ADPCM digital signal processing, (The actual algorithm for the derivation of the adaptive quantisation width has been designated as a company confidential secret, and consequently no further details are available.) The only external circuitry involves the interfacing of this processor with an analogue-to-digital convertor and PC bus for control purposes. The MSM5218 contains an analysis stage in which serial PCM data is compressed into four-bit paraUel ADPCM dam. In addition, a synthesis stage restores PCM data from ADPCM data, This reconstructed data can be produced directly or routed to an internal ten-bit DAC for analogue signal output. Inputs to the system are provided for both surface myoelectric signals, via a suitable differential amplifier, and test signals from bench generators. Both these signal sources are followed by a six-pole low-pass filter Q~PF) for antialiasing purposes. This is, in turn, followed by a 12-bit ADC (MAX164) and shift register to produce PCM-coded data in a serial format as required by the MSM5218. A second LPF is employed at the output of the MSM5218 to smooth the reconstituted signal from the DAC. The overall hardware organisation is shown in Fig. 2. A jumpcr-sclec~ble clock source is employed to control the timing ofboth the A D P C M and A D C operation. In thisway, the effects of differentsampling rates can be investigated.Control of the hardware is via a PC-type computer and a simple bidirectionalport. This is implemented using the standard 8255 programmable peripheral interface(PPI) which is fullybuffered to the PC bus. This allows the four-bitwide compressed data to be stored in the memory of the host computer.
Medical & Biological Engineering & Computing
Jit " 1" ~-~ s ' ~ interface
Data compression hardware organisation
3 Experimental procedure
t Oki Semiconductor, Sunnyvale, CA 94086, USA
....
The software to control the interface is written in the 8088 assembly language, and it provides three modes of operation: (a) Analysis: analogue data are sampled and compressed into four-bit words using ADPCM. The resulting compressed data are stored in memory, four samples to a word. (b) Synthesis: digital data (four-bit) from memory are accessed and decompressed into 12 bits. The reconstituted data stream is routed to the DAC internal to the MSM5218. (C) Transparent: analogue data are sampled and compressed using ADPCM, but not stored. The compressed data are immediately decompressed and routed to the DAC via the internal four-bit bus of the MSM5218. This last mode of operation (c) is used exclusively during the real-time evaluation of the system. (For detailed ilfformation regarding the operation of the MSM5218, readers should consult the appropriate section in the data book (OKIELECTRIC INDUSTRYCOMPANY, 1987).) 3.2 Evaluation protocol To evaluate the performance of the system a general-purpose data acquisition system is used. This eight-cha~-mel system comprises eight-order Butterworth anti-aliasing falters and associated sampling hardware. This, in turn, incorporates a high-speed 12-bit ADC board and a companion simultaneous sample and hold unit (CIO DAS16/330i & CIO-SSH16)~. This system is controlled by a 486-type host computer and is used routinely at the Institute of Biomedical Engineering for data coUection. The use of the CIO-SSH16 ensures negligible time skew between channels, so that timing information in multichannel data acquisition is not lost. In this application, two channels of data acquisition are used. One channel is used to sample the input to the ADPCM hardware (channel 0), whereas the other is employed to monitor the output (channel 1). Data are collected at a sampling rate of 3 kHz, with the anti-aliasing - 3 dB cut-off frequency set to 1 kHz. Data are collected for a period of 33 s, which gives time records of 100 k samples per channel. These data are checked visually to ensure that no overloading of the ADC has occurred, and are then written to a disk file as a 105 x 2 array in MATLABw format.
ComputerBoards, Mansfield, MA 02048, USA wThe Math Works Inc., Natick, MA 01760, USA September 1995
631
LPF
r-z----q
original analoguedatao ,, I :r-.~V~'--JI = LPF reconstituted analogue c
j~j
SSH16
DAS16/330i
~~~110 slm~jltaneous~ ' ~ sa" H ....
I
data anti-allasing
~qype computer
Fig. 3 Evaluation of data compression hardware Owing to the filters included in the ADPCM hardware (Fig. 2), the inclusion of the eight-order anti-alia,sing filters is not strictly necessary. However, our laboratory only provides access to the ADC via these filters, and so this fact is reflected in Fig. 3. Sinusoidal signals and myoeleetric data are used to evaluate the compression hardware. The sinusoidal signals are obtained from a Wavetek Model 21 generator. The myoelectric signal is the result of an isometric steady-state contractiom This is acquired from the forearm of a volunteer subject via Red Dot #2259~.~ disposable surface electrodes.
sequence and the decompressed output time sequence should be zero. Naturally, in a real system this residual difference is non-zero and it can be used as a performance measure. If the input time sequence is defined as xl, x2, x3. . . . . X~v, and the output sequence is Yl, Y2, Y3, -.. yN after decompression, then the percent residual difference (PRD) can be expressed as
Ii=~r -1 1/2 i~=l (x' -- Y')2 I PRD =
H
3.3 Performance measures A useful measure of any signal processing scheme in which fidelity is an important parameter is that of harmonic distortion. After signal processing, the resulting output may contain frequencies which were not present in the input. These additional frequency components are usually multiples of the input frequency and are usually due to unwanted nonlinear effects in the processing scheme. Harmonic distortion is usually measured by considering an input signal which contains a single sinusoid at a frequencyj~. If the output spectrum contains harmonic components at 2J~, 3J~, 43~, which have amplitudes al, a2, a3, then the total harmonic distortion (THD) is defined as
(%) =
a.
x 100
(2)
where ao is the output amplitude atj~. If the output spectrum is normalised so that ao = 1, then eqn. 1 may be simplified to TItD (%) =
~
xlO0
(3)
n==l
This performance measure is highly suitable for single sinusoid testing of a data compression/expansion system, but cannot easily be applied to a complex input signal. In such a ease, analysis in the time domain provides an appropriate alternative. If a data compression/expansion scheme is lossless, then the output of such a scheme is identical to the input. Consequently, in a digital system the difference between the input time 823M Canada Inc., Health Care Products & Services Division, London, Ontario, Canada 632
~--
l,y,
-
j
x 100
(4)
This performance measure is conceptually identical to the mean square error (/VISE) used routinely in optimum signalprocessing algorithms. As the MES is a complex signal which is usually modelled as bandlimited white noise, this type of performance analysis is more appropriate than the frequency domain based harmonic distortion.
4 Results
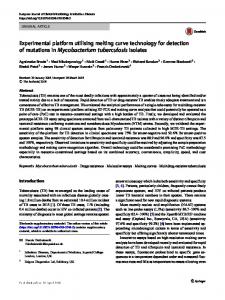
The ADPCM system is evaluated for the compression of both single sinusoid and MES data. The sampling rate of the ADPCM processing is varied from 2 kHz to 8 kHz, while keeping the data acquisition sampling constant at 3 kHz. This variation in ADPCM processing rate corresponds to a compressed bit rate storage that ranges between 8 and 32 kbits s -z. 4.1 Effect of sampling rate on harmonic distortion To measure the harmonic distortion, the ADPCM system is tested using a sinusoidal input signal. Time records for input frequencies of 50, 100 and 500 Iqz were obtained using the protocol outlined in Section 3.2. Translation of the time records from the time domain into the frequency domain was performed using MATLAB. The data are first segmented into 2048 point records with an overlap of 50%, giving a total of 72 segments. These segments are windowed with a Hamming fimetion and then transformed into the frequency spectrum using the fast Fourier transform (FFT). The 72 spectra obtained fin this way are averaged to reduce the variance associated with the FFT operation, and are then normalised to the amplitude o f the fundamental. Fig. 4a illustrates the typical results of this process. The spectrum of a reconstituted 50 Hz sine wave is shown. The amplitudes of the harmonics are readily obtained from this
Medical & Biological Engineering & Computing
September 1995
100 50 Hz sinewave t e s t
0'8signal
ff
10~
~
0.70,6 ~
~5
104J J ~
0"5" E
0.4-
Z
0"3"
50Hz
fs = 8 kHz 0
100
200
300
400
0"2
500
~
,
0
1
frequency. Hz a
~
,
2
,
9
3
,
9
4
,
.
5
,
,
,
6
9
7
,
9
8
ADPCM sampling frequency,
9
10
kHz
b
Fig. 4 Harmonic distortion; (a) 50 Hz sine wave test signal; (b) as a function of ADPCM sampling frequency spectrum, and by using eqn. 3, a value for the THD can be determined. To ensure that the amplitudes of the resultant harmonics are not artefacts of the FFT procedure, harmonic analysis of the input signal is also performed. This resulted in no discernable harmonics, with the noise floor an order of magnitude lower than after ADPCM processing. Values of THD are obtained for ADPCM sampling rates of 2, 4 and 8 kI-Iz. Fig. 4b shows these results for input frequencies of 50 and 100 Hz. The level of THD increases with decreasing ADPCM sampling rate, and it also increases with input frequency. However, in all cases the THD is below 1%.
50 ms section ofmyoelectric data, with the traces separated for clarity and normalised to a peak amplitude of unity. The two traces are very similar, this similarity is highlighted by examination of the residual difference signal, as shown in Fig. 6. It should be noted that the vertical scale has been increased by a factor of four so that the nature of the residual can be seen more clearly. Statistical analysis of the entire data record shows that the residual error has a normal distribution and zero mean. With the two time sequences aligned, eqn, 4 is implemented for the extent of the data. The results of this analysis are shown in Table I, and are compared to the harmonic analysis.
4.2 Myoelectric data compression
Table 1 ADPCM performance with MES signal
To evaluate the performance of the ADPCM scheme with regard to the compression of myoelectric data, all analyses is performed in the time domain. Values of PRD based on eqn. 3 are obtained for the three ADPCM sampling rates of 2, 4 and 8 kHz. However, due to the time delay in ADPCM processing, simple subtraction of the input and output time series cannot be employed. To compensate for the ADPCM processing time, a crosscorrelation is performed between the normatised input time sequence and the normalised output sequence. Bow-tie correction is applied to the cross-correlation product of the first 1000 samples of the time data. The time skew between input and output time series is shown as a departure of the correlation peak from the central sample. Fig. 5a shows a typical output from the cross-correlation procedure, and it gives the time skew as approximately five samples for the 2 kHz case. This corresponds to a time delay in the A D P C M processing of approximately 1.6 ms. Once the time skew has been estimated, the two time series can be aligned fdr comparison purposes. Fig. 5b shoves the result for
ADPCM sampling
1"0
i
0"6 0.4
~
~2
~
2 kHz 4 kHz 8 kHz
PRD (%) MES
THD (%) 50 Hz
THD (%) t00 Hz
1.05 0.32 0.15
0.64 0.38 0.33
0.71 0.45 0.38
The PRD measures for the MES show trends similar to those of the harmonic distortion measures obtained for the single sinusoid signals. As expected, the performance of the ADPCM compression scheme deteriorates with decreasing sampling rate, as the compression factor increases. 4.3 Clinical parameters extracted from myoelectric data In a clinical application, various parameters of the myoelectric signal are extracted from the data. In the time domain, two such parameters are the standard deviation (SD) and mean absolute value (MAV). These values can be used to quantify muscle activity level. In the frequency domain, paran~eters
.....
o.41
-0,2 - 0 " 4 1 ..' , -25 -15
,-5
,
5
15
25
-0"81
samp~~g
,
0
,
10
,
, .......
2O
9
.
3O
.
.
.
40
50
time, ms
a
Fig. 5 ACESreconstruction; (a) skew= 5 samples; 2 kHz ADPCM; Co) traces offset for clarity; 2 kHz ADPCM Medical & Biological Engineering & Computing
September 1995
633
0.20 0.15 0.10 "~
0.8i
~ o.81
0"00
~ -0.05. ~ -0.10 --Oq5 -0.20 0
-t
.~ 0"4 0"2 t 0"0
10
20
30
40
50
9
-
-0'20
.
.
.
a
Table 2 Comparison of time-domain parameters
SD error MAV error
PCM 12-bit data 0.225 0.175
.
'
)"
,
0.00
0-10
0-2o
Error analysis for 2 kHz ADPCM; (a) residual difference, (b) error distribution
such as the peak and median frequency are often employed to infer information regarding the conduction velocity of the muscle fibres. To obtain an estimate of the effect ADPCM compression on time-domain parameters, the SD and MAV on samples of surface EMG time series data are obtained. Calculations were performed on both the original data and data which had been compressed and subsequently expanded back to 12-bit representation. These results are summarised in Table 2.
time-domain parameter
.
t~i~l~l error b
lin~, m s
Fig. 6
.
--0"10
ADPCM compressed 2 kHz 4 kHz 8 kHz 0.222 - 1-2% 0.1.73 -0-9%
0.228 +1.3% 0-178 +I .7%
0.225 0 0.176 +0-4%
machine type etc., followed by the data in 16-bit binary format. Consequently, the size of such a file is approximately as follows: file size (bytes) = number o f data samples x 2 + header Tests are performed on single-channel sinusoidal data and myoelectric data, each sampled at 3 kHz. These files of l0 s samples each are then compressed using PKZIP, and the resulting file size is compared with the ADPCM theoretical size of 50 kbytes. The results of this comparison are illustrated in Table 4. From this Table it is clear that the performance of the ADPCM hardware technique is far superior to that of the PKZIP software. However, it is interesting to note that the software compression of the sinusoidal data is more efficient than that of the MES. This is probably due to the high level of redundancy associated with a periodic deterministic signal. Table 4 Compression factors for ADPCM and PKZIP
A similar comparison was performed in the frequency domain using the median frequencyf,~a. No comparison was made on the peak frequency fvk, due to the noise associated with the spectral estimate technique. Table 3 shows the results of performing frequency domain analysis on the myoelectrie spectra obtained both after ADPCM compression and expansion and with the original 12-bit PCM data.
f,,~, Hz
error
ADPCM*
25 200 x I03 ~ 2 0 0 • 103
-50 x 103 50• 103
CF
PKZIP (sine)
(MES)
? ? ? 9 ~ 126x 103 ~,157x 10a
75%
37%
22%
ADPCM compressed PCM 12-bit data
2 kHz
4 kHz
8 kHz
123
120
124
123
--2.4%
+0-8%
0
As the median frequency shifts during fatigue can be of the order of 30% (STULEN and DE LUCA, 1981), the error introduced by the ADPCM compression system is minimal. Further study will ascertain whether the shift in the median frequency with fatigue is affected by ADPCM compression of the myoeleetric data, and what effect may result from a dynamic myoelectric signal. 4.4 Comparison with L Z W algorithm It is thought useful to compare the compression factor CF obtained for the ADPCM hardware with a commercial lossless technique such as LZW. Therefore PKZIP was used with a MATLAB binary file from the data acquisition system. The format of this file comprises a small header (10-50 bytes), indicating such parameters as the data dimensions, originating
634
header data total
MATLAB (binary)
* estimated based on 4 : 1 compression ratio
Table 3 Frequency-domain parameters
frequencydomain parameter
file type
5 Conclusions ADPCM is a high-quality method of data compression for sinusoidal signals. Harmonic distortion levels below I% are easily achieved, even with sampling rates as low as 2 kHz. This fact is corroborated by the use of such techniques in highquality speech compression. However, this work has shown that ADPCM can also be used for the compression of myoelectric data with equally good results. In using the time-domain technique of assessment via the PRD measure, it is important to compensate for the delay introduced by the ADPCM processing. This is estimated using a crosscorrelation technique. As the accuracy of the estimate is 4- 1 sample, i.e. 0-33 ms, perfect alignment of the input and output time sequences is unlikely. Consequently the figures obtained for the PRD will err on the high side. Even so, without compensating for this source of error the maximum PRD is approximately 1%. The compression factor obtained using ADPCM processing is primarily associated with the smaller number of bits required per sample. In the case of the MES, 12 bits were compressed to
Medical & Biological Engineering & Computing
September 1995
4 bits, giving a compression factor of 67%. However, a more realistic factor is 75%, as most 12-bit ADC schemes result in the storage of one 16-bit word per sample to match the memory organisation. Lossless software techniques based on LZW coding result in compression factors in the region of 20% when used with sampled myoelectric data. This is probably due to the random nature of such a signal, which in turn produces many short substrings within the coding table. This conjecture is supported by the improvement obtained CF 22% ~ 37%) when using data with a periodic structure. To summarise, this work has been shown that ADPCM can be used successfully in the compression of myoelectric data, with little loss in clinically significant features. In addition, this compression can be performed in real time using simple hardware based on a commercial integrated circuit intended for speech applications. Although in the evaluation reported here, a PC-type machine was used to control the compression system, it would be a relatively simple task to include this hardware in any microprocessor-based clinical acquisition system. Future work in this area is needed to assess this technique for dynamic myoelectric signals, in which the contraction level varies in time, This may pose a problem for ADPCM due to the predictive nature in which the quantisation width is set. In addition, more extensive studies into the nature of the error introduced by ADPCM is warranted to determine any trends or biases, These aspects are currently under investigation.
HlrCRICHS, H. (1991): 'EEG data compression with source coding techniques', J Biomed. Eng., 13, pp. 417-423 HU~MAN, D. A. (1952): 'A method for the construction of minimumredundancy codes' Proc. IRE, 40, (9), pp. 1098-1101 LOVELY, D. F., HRUCZKOWSKI,T. W., HUDGINS, B., RUSH, K., SEXSMITH, 3. R., RICKARD$, J., and BIDEN, E. N. (1993): 'An ambulatory monitoring system for the quantitative evaluation of injury prevention programs in a workplace environment', 5th Atlantic Rehabilitation Research Symposium, Halifax, Nova Scotia, Canada NELSON, M. (1989): 'LZW data compression', Dr Dobb's J., 14, pp. 29-37 OKI SE~&CONDUCrOR(1987): 'OK] voice synthesis LSI data book'. 1st edn. SRD 04-1A9-57 650 North Mary Avenue, Sunnyvale CA 94086, USA STULEN, E B. and DE LUCA, C. J. (1981): 'Frequency parameters of the myoeleetric signal as a measure of muscle conduction velocity', IEEE Trans., BME-28, pp. 515-523
Authors" biographies D.E Lovely is a Research Professor at the Institute of Biomedical Engineering at the University of N e w Brunswick. Hc received his BSc Honours in
Electronic Engineering from the University of Southampton in 1976. In 1978 he re~_rned to tmiversity and obtained his PhD in Bioengineering from the University of Strathclyde, Glasgow, in 1981, speeialising in biomedical insmunentation. He has been at his present post since 1982. His research interests are in low-noise instrumentation, digital signal processing and VLSI design.
References CIARClA, S. (1983): 'Use ADPCM for highly intelligble speech synthesis', Byte, 8, (6), pp. 35--49 COX, J. R., NOLLE,E M., FOZZARD,H. A., OLIVER,G. C. Jr. (1968): 'AZTEC: a preproeessing program for real-time ECG rhythm analysis', IEEE 7)'ans., BME-IS, pp. 128--129 EVANS, A. L. and FE,'~rNErt, J. (1987): 'Random-access phrase ~-eorder', Electron. Wirel. World, 93, (1611), pp. 54--56
Medical & Biological Engineering & Computing
September 1995
J.E Norris was an undergraduate student in the Electrical Engineering programme at the University of New Brunswick. His research interests include analogue circuit design, digital interfacing and communications. After graduation in May I994 he began work as a hardware engineer with Northern Telecom.
635