APPLIED AND ENVIRONMENTAL MICROBIOLOGY, Apr. 2010, p. 2326–2334 0099-2240/10/$12.00 doi:10.1128/AEM.02090-09 Copyright © 2010, American Society for Microbiology. All Rights Reserved.
Vol. 76, No. 7
Real-Time Microsensor Measurement of Local Metabolic Activities in Ex Vivo Dental Biofilms Exposed to Sucrose and Treated with Chlorhexidine䌤 Christiane von Ohle,1* Armin Gieseke,2 Laura Nistico,3 Eva Maria Decker,1 Dirk deBeer,2 and Paul Stoodley3,4 University Hospital, Dental Clinic, Department of Conservative Dentistry, Osianderstr. 2-8, D-72076 Tu ¨bingen, Germany1; Microsensor Group, Max Planck Institute for Marine Microbiology, Celsiusstr. 1, D-28359 Bremen, Germany2; Allegheny-Singer Research Institute, Allegheny General Hospital, 320 East North Ave., Pittsburgh, Pennsylvania 15212-47723; and National Centre for Advanced Tribology at Southampton, School of Engineering Sciences, University of Southampton, SO17 1BJ Southampton, United Kingdom4 Received 30 August 2009/Accepted 18 January 2010
Dental biofilms are characterized by structural and functional heterogeneity. Due to bacterial metabolism, gradients develop and diverse ecological microniches exist. The aims of this study were (i) to determine the metabolic activity of microorganisms in naturally grown dental biofilms ex vivo by measuring dissolved oxygen (DO) and pH profiles with microelectrodes with high spatial resolution and (ii) to analyze the impact of an antimicrobial chlorhexidine (CHX) treatment on microbial physiology during stimulation by sucrose in real time. Biofilms were cultivated on standardized human enamel surfaces in vivo. DO and pH profiles were measured in a flow cell system in sterile human saliva, after sucrose addition (10%), again after alternative treatment of the sucrose exposed biofilms with CHX (0.2%) for 1 or 10 min or after being killed with paraformaldehyde (4%). Biofilm structure was visualized by vitality staining with confocal microscopy. With saliva as the sole nutrient source oxygen consumption was high within the superficial biofilm layers rendering deeper layers (>220 m) anoxic. Sucrose addition induced the thickness of the anaerobic zone to increase with a concurrent decrease in pH (7.1 to 4.4). CHX exposure reduced metabolic activity and microbial viability at the biofilm surface and drove metabolic activity deeper into the biofilm. CHX treatment led to a reduced viability at the biofilm surface with minor influence on overall biofilm physiology after 1 min; even after 10 min there was measurable respiration and fermentation inside the biofilm. However, the local microenvironment was more aerated, less acidogenic, and presumably less pathogenic. salivary glycoproteins (5). Nutrient depletion causes the microorganisms to either grow very slowly or to stop growing completely, entering a dormant-like state. Changes in the ecologic balance of the oral microflora and in dental biofilms are a causative factor for the development of dental caries (43), gingivitis, and periodontitis (1); thus, these diseases can be considered as biofilm mediated. Fundamental factors that may lead to a shift in the microflora and the predominance of pathogens are the local pH value, the redox potential, and the availability of nutrients and/or carbohydrates (30). Caries, for instance, is a multifactorial disease. However, its main cause is the bacterial carbohydrate catabolism and the release of organic acids by acidogenic bacteria in the biofilm. This promotes the predominance of cariogenic pathogens such as Streptococcus mutans, Streptococcus sobrinus, and other acidogenic microorganisms (28, 43). Consequently, this results in further acid production and a decreasing pH. Associated with this is the demineralization and lesion development of dental hard substance (54). Next to individual improvement of mechanical oral hygiene (i.e., mechanical and manual brushing, as well as flossing), prevention and therapy of oral disease is achieved by adjunctive oral hygiene products containing antimicrobial agents (29, 47). A concentration of 0.2% chlorhexidine (CHX) in oral mouth rinses showed the best efficacy in clinical studies and is
Biofilms are complex, surface-associated, microbiological communities (7) that are characterized by microscale spatial, structural, and functional heterogeneity (40). The biofilm consists of microorganisms that are embedded in an extracellular slime matrix consisting of biopolymers of microbial origin such as polysaccharides, proteins, and DNA (16). This extracellular polymeric slime is highly hydrated and influences both the structure and the diffusion behavior within the biofilm (39). Bacterial metabolism results in the development of chemical and physiologic/metabolic gradients within the biofilm (17). Due to different concentrations of oxygen, nutrients, and microbial metabolic by-products, local microecological niches are created, allowing the coexistence of microorganisms with different growth requirements in close proximity (30). For example, the growth of anaerobic microorganisms within a generally aerobic environment within the oral cavity is possible. Carbohydrates and sugar are the most important energy sources for microorganisms in dental plaque (23) and, in the case of a lacking external substrate supply, they are able to metabolize
* Corresponding author. Mailing address: Dental Clinic, Department of Conservative Dentistry, Osianderstr. 2-8, D-72076 Tu ¨bingen, Germany. Phone: 49-7071-2983498. Fax: 49-7071-295462. E-mail:
[email protected]. 䌤 Published ahead of print on 29 January 2010. 2326
VOL. 76, 2010
LOCAL METABOLIC ACTIVITIES IN DENTAL BIOFILMS
still considered a “gold standard” (45). The antiplaque effect of CHX is based on a broad antibacterial spectrum. During application it immediately shows bactericidal effect and continuous bacteriostatic effect due to its high substantivity in the oral cavity (20). Electron microscopic examinations showed that CHX binds to and damages bacterial cell membranes and leads to structural changes and leakage of cytoplasm (3). Furthermore, contraction of in vitro grown biofilms after CHX exposure was shown in addition to cell damage (19, 44), which could cause changes in the diffusion behavior by changes to extracellular polymeric slime density. However, in deep layers of oral biofilms not all bacteria were reached (49). Direct visualization by fluorescence microscopy of the CHX effect was described by Takenaka et al. (44) for a three-species oral biofilm grown in vitro. Cell damage started from the periphery of bacterial aggregates and slowly continued into the depths. Other authors have reported the inability of CHX to completely kill all bacteria in different in vitro biofilm systems (15, 19, 32) and in vivo studies (48, 55) when a normally used clinical concentration was applied at usual exposure times. The killing efficacy was dependent on the age of the biofilm and thus on its thickness and composition. Detection of concentration gradients in oxygen, pH, and metabolites in undisturbed biofilms in situ requires a microsensor technique. Microelectrodes with a tip diameter of a few micrometers offer precisely localized measurements on the microscale in three dimensions under real-time conditions (9, 35). Thus far, microelectrodes have been applied for measuring plaque pH in dental research in a groove model ex vivo (53, 54) and in in vitro-grown S. mutans biofilms (13, 42). However, there is no information on direct measurements of oxygen distribution and consumption in dental biofilms grown in vivo in the human oral cavity. In the field of environmental microbiology, analysis of the microenvironment, local activities, and gradients by microelectrodes is correlated with microscopic examination of the biofilm structure, thus allowing a relationship to be made between biofilm physiology and structure (18, 37). We decided to take a similar approach to characterize the effects of sucrose and CHX on ex vivo plaque biofilm physiology. The goal of the present study was to examine the metabolic activity (oxygen consumption and acid formation) and viability and the effect of antimicrobial CHX treatment on the physiology of the dental biofilms during exposure to sucrose. The spatial distribution of live and dead biofilm cells was examined by confocal laser scanning microscopy (CLSM), as well as by microbiological culture. MATERIALS AND METHODS Biofilm formation. An individually fabricated intraoral acrylic stent supplied with standardized human enamel slivers was worn by one healthy person for 3 days, starting in the morning on different occasions to obtain in vivo generation of mature dental biofilms. A preceding dental examination revealed no clinical and radiological signs of gingivitis, periodontitis, or caries. The enamel specimens were prepared from freshly extracted human third molars. After sterilization, they were processed to a surface roughness of 0.16 ⫾ 0.02 m according to natural interproximal enamel-enamel contact areas (52). The area (in mm2) of the enamel surface was calculated following digitalization (Scion Image Rel. 4; Scion Corp.). Afterward, the specimens were fixed to the stent in the region of the upper premolars and molars toward the natural teeth to simulate retention areas (Fig. 1). During the time of biofilm formation, a regular diet was maintained and personal oral hygiene was performed using a toothbrush, dental floss, and water. During meals and tooth brushing the stent was stored in a humid
2327
FIG. 1. Clinical picture of the upper jaw with the intraoral acrylic stent in situ. The enamel slivers (E) were fixed in the region of the premolars and molars toward the natural teeth to simulate retention areas (arrows).
chamber. At least 2 h before the biofilm samples were taken, the subject refrained from eating and drinking. At the end of each period the specimens were carefully removed from the device for further analysis without interfering with the adhering biofilm. The procedure was approved by the ethical committee of the medical faculty and informed consent was given. Antimicrobial treatments. Untreated native dental plaque biofilms with no sucrose amendment served as control (⫺suc). The antimicrobial treatment of previously sucrose exposed biofilms (⫹suc) was performed ex vivo using a 0.2% CHX formulation (Chlorhexamed Forte; Glaxo SmithKline, Bu ¨hl, Germany). The biofilms were exposed to 10 ml of the CHX solution for either 1 min (CHX_1) or 10 min (CHX_10). Afterward, they were carefully dipped into sterile saliva. As a negative control, biofilms were killed by fixation with 4% paraformaldehyde (PFA) overnight. After fixation, the biofilms were cleaned twice in sterile saliva. The effective CHX concentration was calculated within different layers of the biofilm based on a simplified model (semi-infinite medium, the CHX surface concentration c0 equals the concentration in the liquid of 0.2%) (8). Microelectrode measurements. (i) Saliva. For saliva samples, 30-ml portions of whole saliva were collected by paraffin stimulation from two healthy volunteers 2 h after breakfast. Sterilization was performed immediately (12). After sonification and separation of debris by filtration, each saliva sample was centrifuged at 25,524 ⫻ g for 30 min at 3°C (Biofuge 22R; Heraeus, Hanau, Germany). The supernatant was filtered by two Millex low binding protein filters (0.45 and 0.22 m; Millipore, Eschborn, Germany). The sterile saliva was buffered weakly and adjusted to a pH of 7.1 to 7.2 by 0.2 mM Na2HPO4 and 0.3 mM KH2PO4, stored at 4°C, and used within 48 h. For experiments, saliva was diluted 1:10 (vol/vol) using sterile water. (ii) Ex vivo flow cell setup. After removal from the stent, the enamel coupons with biofilm were immediately placed in a small flow cell (6.75 cm3) for subsequent microelectrode measurements. The flow cell was fed from a total volume of 250 cm3 of 1:10 saliva by use of two peristaltic pumps connected to both the inlet and outlet of the flow cell at a flow rate of 3 ml/min. The sterile human saliva as medium was aerated, and the temperature was kept constant at 24°C (room temperature). The limited volume of saliva due to the harvesting and handling procedure necessitated recirculation. Each set of measurements were collected within ⬃60 min and no longer than 90 min, after which the spent saliva was replaced with fresh saliva. Dental biofilm samples were subjected to the salivary medium with no added sucrose (⫺suc) and with added sucrose (25 g; 10% [wt/vol]) to stimulate microbial activity (⫹suc). Antimicrobial treatment was performed by removing the previously sucrose exposed specimens carefully from the flow cell and immersing them into the CHX formulation (CHX_1 and CHX_10) or PFA. After each treatment, the samples were gently dipped in 1:10 saliva and immediately returned to the flow cell that contained the sucrosesupplemented 1:10 saliva. After removal from the oral cavity, the thickness of the ex vivo biofilms was measured from microelectrode experiments, as well as being estimated from a stereomicroscope. (iii) Microelectrodes. Microelectrodes were used to measure dissolved oxygen (DO) concentration and pH. They were fabricated as described by Revsbech (36)
2328
VON
OHLE ET AL.
and deBeer et al. (10) with tip diameters of 10 and 5 m. Measurements were performed by using a semiautomated setup. Sensors were connected to a picoamperemeter and millivoltmeter, respectively, and positioned by using a micromanipulator (model MM33; Maerzhaeuser, Wetzlar, Germany) with a motorcontrolled z-axis (model VT-80; Micos, Eschbach, Germany). Amplifier signals were recorded by a data acquisition system (model DAQCard AI16XE50; National Instruments, Austin, TX) on a portable computer. Positioning during profiling and data acquisition were controlled by using custom-made software. Profile measurements were started 30 min after the biofilms were placed into the flow cell, allowing the biofilm to equilibrate and come to steady state (taken as no significant change to the profile or a depth measurement within a 2-min period). We measured depth profiles at high spatial resolution (25-m increments) within the biofilm before and during exposure to sucrose (at least 20 min upon sucrose addition) or after additional antimicrobial treatment (CHX and PFA). Each profile took about 5 min. Also, the dynamic response (time series) of the biofilm to sucrose addition was recorded by leaving the microelectrode at one depth within the biofilm. For time series, the tip of the sensor was positioned either at the surface of the biofilm (DO) or near the biofilm base (pH). For flux calculations it is important that the profiles were at steady state. Steady state was confirmed by repeated profiling. Approximately 2 min after steady-state conditions had been achieved repeated profiles were taken at slightly different locations. Each set of measurements was collected within ⬃60 min. Profiles, aerial rates, and local conversion rates were calculated from at least four to six profiles. Profile data were reported as means ⫾ 2 (standard errors [SE]). In order to obtain constant and reproducible experimental conditions for all microelectrode measurements, the ex vivo measurements were conducted at room temperature (24°C). In this way we ensured that there were no temperature fluctuations of the microelectrodes, the standardization solutions, or the media during measurements despite the various rapid medium exchanges, allowing the profiles to more rapidly come to steady state. (iv) Rate calculations. Under the conditions of the setup, the biofilm surface is covered by a stagnant medium layer, through which transport occurs only by diffusion. The diffusive transport of solutes through this diffusive boundary layer (DBL) is proportional to the concentration gradient in the DBL according to Fick’s first law of diffusion: J ⫽ D0 (c/x), where J is the flux (in nmol cm⫺2 s⫺1), D0 is the molecular diffusion coefficient (in cm2 s⫺1), and c/x is the concentration gradient (in nmol cm⫺4). Assuming a molecular diffusion coefficient of oxygen of 2.3634 ⫻ 10⫺5 cm2 s⫺1 (4) for oxygen at 24°C, aerial transport rates can be calculated that represent the total biofilm activity. Assuming diffusion as the dominant transport process within the biofilm, the curvature of the profiles within the biofilm was used to calculate the local activities according to a modified version of Fick’s second law of diffusion: Deff (2c/x2) ⫽ r, where Deff is the effective diffusion coefficient within the biofilm, 2c/x2 is the local change in concentration gradient, and r is the local conversion rate (in mol m⫺3 s⫺1) (35). We used a stepwise algorithm (18) to calculate local conversion rates (oxygen) as a measure for local oxygen consumption. To determine where acidification was occurring within the biofilm, we calculated rate data in terms of H⫹ production or consumption from the pH data. However, since [H⫹] is a function of buffering (21), our concentrations should only be considered for purposes of relative comparison in this system and not as absolute concentrations. First, we converted the pH to proton concentration [H⫹] in nmol cm⫺3 by using the equation [H⫹] ⫽ 1/10pH. For the Deff of H⫹ we used 1.86 ⫻ 10⫺5 cm2 s⫺1, which was based on a Daq of 9.31 ⫻ 10⫺5 cm2 s⫺1 at 25°C (26) and a Deff/Daq ratio of 0.2, which was estimated by Stewart (39) from diffusion measurements in dental plaque. Negative uptake rates indicate net H⫹ production (acidification) and positive uptake rates indicate net consumption. CLSM. The CLSM investigation was performed by using a Leica DM RXE microscope connected to a TCS SP2 AOBS confocal system (Leica Microsystems) equipped with an argon laser (488 nm) and an He-Ne laser (543 nm, 633 nm). Analysis of microbial viability. The biofilm samples (⫺suc, ⫹suc, CHX_1, CHX_10, and PFA) were stained by using a Molecular Probes Live/Dead BacLight bacterial viability kit (Invitrogen). Each biofilm sample was incubated in 500 l of staining solution for 15 min. The stained biofilms were subsequently examined by CLSM. The green fluorescent DNA-binding dye SYTO 9 labeled all MO (detection, 500 to 535 nm), while the red fluorescent propidium iodide (PI) labeled MO with harmed bacterial membranes (detection, 600 to 720 nm). Sequential scanning mode was used to eliminate “bleed over.” Z-series of confocal images (xy scan) were acquired with a 10 ⫻ 0.3 (NA) magnifying objective at 2-m intervals. We chose low magnification to provide a larger field of view and a more general representation of the biofilm distribution in plan view at the top of the biofilm and the base. The thickness of the optical sections was ⬃6 m; thus, we oversampled in the z dimension by a factor of 3 to ensure a continuous
APPL. ENVIRON. MICROBIOL.
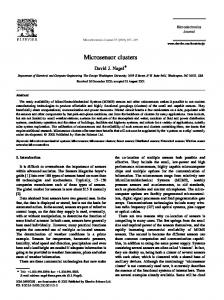
FIG. 2. Averaged oxygen profiles measured in situ on dental biofilms in salivary solution (1:10) without sucrose (⫺suc, n ⫽ 11), with 10% (wt/vol) sucrose (⫹suc, n ⫽ 6), and with 10% sucrose after 1 min (CHX_1, n ⫽ 4) or 10 min (CHX_10, n ⫽ 5) of treatment with CHX and in a PFA-killed control (PFA, n ⫽ 3). Error bars were omitted for clarity.
data set. Additionally, the biofilm thickness (Lf) was measured as the distance between the substratum and the highest cell cluster of the entire biofilm. The biofilms were examined at two different locations in the middle of the enamel surface. Digital image analysis of the optical sections was performed by using a custom-made software based on Axiovision (Zeiss, Germany). The analysis of the microbial viability (V) was based on the fluorescently labeled membrane integrity. After thresholding, V was calculated as the percentage of green (vital) voxels related to the whole number of red (dead) plus green voxels in every optical section of the biofilms. For each biofilm, the mean viability of all layers was calculated. Culture method. In addition to the fluorescence-based microscopic viability assessment, conventional cultivation was also performed. The biofilm was mechanically detached from the enamel surface by scraping and transferred into sterile saline, followed by sonification on ice to disrupt larger clumps and chains, and then homogenized by vortexing. The total bacterial counts (BC) were measured by using a bacterial counting chamber (System Helber, Saaringia, Germany; counting volume, 0.8 ⫻ 10⫺3 mm3) under a dark-field microscope (magnification, 500⫻). For this purpose the number of single cells and particles (small remaining chains were counted as one count) were enumerated. Thus, it is possible that our BC were slightly underestimated. The BC were reported per mm2 of the substrate surface (BC/mm2). Cultural viability was examined by plating the serially diluted biofilm samples on Schaedler agar plates supplemented with sheep blood and vitamin K1 (Becton Dickinson, Heidelberg, Germany) using a spiral plater (Meintrup, La¨hden, Germany). The CFU were counted after anaerobic incubation for 48 h at 37°C and reported as CFU/mm2. Statistics. BC and CFU values were log transformed. The data were reported as mean and corresponding 95% confidence intervals (CI) unless otherwise indicated. Statistical comparisons between data sets were made by using analysis of variance (Microsoft Excel 2000). Differences were considered significant for P ⬍ 0.05. Each experiment was performed three times.
RESULTS Microelectrode measurements. (i) Profiles of DO and pH. The biofilms were ⬃300 m thick. Repeated profiles over the course of the experiment indicated no measurable increase in biofilm thickness over this time. All biofilms except the PFAkilled group showed an anaerobic zone in deep biofilm layers. Here, we define anaerobic regions according to the criteria of Loesche (27) as oxygen saturation values of ⬍0.5% (Fig. 2 and 3). With no external substrate present (⫺suc), DO penetrated into the biofilm to a depth of 220 m. Upon sucrose addition (⫹suc), DO penetration was reduced to the upper 150 m,
VOL. 76, 2010
LOCAL METABOLIC ACTIVITIES IN DENTAL BIOFILMS
2329
FIG. 3. Anaerobic regions (DO ⬍ 0.5%, gray) in dental biofilms in situ (1:10 buffered saliva) without sucrose (⫺suc), with 10% (wt/vol) sucrose (⫹suc), and with 10% sucrose after 1 min (CHX_1) or 10 min (CHX_10) of treatment with CHX and in a PFA-killed control. Mean (black line) and corresponding 95% confidence intervals (error bars).
with a concomitant increase in the thickness of the anaerobic layer. Treatment with CHX reversed this effect and, despite the presence of sucrose (10% [wt/vol]), penetration of DO increased to 180 and 210 m. PFA-killed biofilms were fully aerated. Repeated profiling at the same location ensured that the procedure of removing the biofilm from the flow cell, and replacing it without any treatment outside had no effect on the profiles (data not shown). In the biofilms without sucrose (⫺suc) and the PFA-killed control group, the pH within the biofilm and in the salivary solution (pH 7.1 to 7.2) were more or less the same, with a minimum pH of 7.03 (⫺suc; CI ⫽ 6.99 to 7.08) and 7.15 (PFA) (Fig. 4). Sucrose addition (⫹suc) resulted in a strong pH decrease, particularly at the base of the biofilm with the lowest values reaching 4.32 (CI ⫽ 3.97 to 4.66) at a depth of 220 m. Thus, the lowest pH occurred in the anoxic layer. Compared to the ⫹suc situation the antimicrobial CHX_1 treatment did not result in remarkable differences in pH in the different layers of the biofilm (minimum, 4.87; CI ⫽ 4.53 to 5.20), CHX_10 had a significant effect. The lowest values now only dropped to pH 5.87 (CI ⫽ 5.05 to 6.70). (ii) Time series of oxygen and pH. Sucrose supplementation of the saliva solution led to an immediate decrease of DO concentration at the biofilm surface (Fig. 5). A measured re-
FIG. 5. Representative time course of oxygen (DO, black line) measured in situ at the surface of a dental biofilm and time course of pH (gray line) measured in situ at the biofilm base (250 m depth) before (t ⬍ 0) and after (t ⬎ 0) sucrose addition (10% [wt/vol]) to the medium (1:10 buffered saliva). t ⫽ 0 corresponds to the time when the sucrose-containing medium got into first contact with the biofilm surface.
sponse was discernible within seconds, and a new steady state was reached within about 3 min. During that time the oxygen concentration decreased from ca. 35% air saturation to 23%. At the biofilm base the pH also decreased immediately from 7.1 to 4.7 within less than 10 min (Fig. 5). Fifty percent of this response occurred within the first 2 min. (iii) Areal and local activities of the biofilm. The areal uptake rates of oxygen inside the biofilm, calculated from the concentration gradient through the DBL, were not affected significantly by the addition of sucrose or the CHX treatments (Fig. 6). The killed negative control (PFA) showed no aerobic activity. However, the addition of sucrose and exposure of the biofilms to CHX did have a significant impact on acidification and the H⫹ production rate (Fig. 6). Sucrose addition caused an increase in H⫹ production rate by a factor of almost 1,000. This production rate was subsequently reduced by a factor of 2.5 after a 1-min exposure to CHX and by a factor of ⬃30 after
FIG. 4. pH (a) and corresponding [H⫹] (b) profiles measured in situ on dental biofilms in salivary solution (1:10) without sucrose (⫺suc, n ⫽ 5), with 10% (wt/vol) sucrose (⫹ suc, n ⫽ 6), and with 10% sucrose after 1 min (CHX_1, n ⫽ 4) or 10 min (CHX_10, n ⫽ 4) of treatment with CHX and in a PFA-killed control (PFA, n ⫽ 2). Error bars were omitted for clarity.
2330
VON
OHLE ET AL.
APPL. ENVIRON. MICROBIOL. TABLE 1. Structure and viability of in situ dental biofilms assessed by CLSMa Lf (m)
Treatment
⫺suc ⫹suc CHX_1 CHX_10 PFA
FIG. 6. Areal biofilm uptake rates of oxygen (f) and H⫹ (䡺) in dental biofilms in situ (1:10 buffered saliva) without sucrose (⫺suc), with 10% (wt/vol) sucrose (⫹suc), and with 10% sucrose after 1 min (CHX_1) or 10 min (CHX_10) of treatment with CHX and in a PFA-killed control. Error bars correspond to 95% confidence intervals. For H⫹ negative uptake rates indicate proton production (acidification).
a 10-min exposure. The PFA-killed control showed no acidification. The local reaction in separate biofilm layers to the different treatments, however, showed a more detailed picture and varying influence of CHX on respiration and acidification inside the dental biofilm (Fig. 7). With saliva alone, oxygen was consumed to a small extent in all biofilm layers down to 220 m. Although the oxygen flux into the biofilm was marginally changed by sucrose addition, the distribution of local uptake rates at different depths within the biofilm was altered. The highest local uptake rates within the biofilm were localized close to the surface in the top 50 m of the biofilm. CHX_1 inactivated the biofilm surface but led to increased oxygen uptake rates between depths of 50 to 120 m. After CHX_10 treatment, the aerobic heterotrophic activity was depressed deeper in the biofilm to between 75 and 175 m; thus, the overall oxygen consumption remained constant. The PFAkilled control showed no aerobic activity in any of the biofilm layers. With unsupplemented saliva, there was little acid production anywhere in the biofilm. However, when sucrose was added acid was produced in the bottom region of the biofilm between
V (%)
Mean
95% CI
Mean
95% CI
226.7 217.3 230.0 228.0 232.7
148.7–304.6 201.4–233.2 106.3–353.7 116.1–339.9 143.0–322.3
63.4 70.7 2.0 0.7 18.9
53.6–73.08 63.0–78.4 ⫺1.6–5.6 ⫺0.2–1.6 8.0–29.9
a Biofilms were assessed without antimicrobial treatment (⫺suc, ⫹suc) and after 1 min (CHX_1) or 10 min (CHX_10) of CHX treatment or after PFA exposure (PFA). The mean biofilm thickness (Lf), the mean viability of all investigated dental biofilm layers (V), and the corresponding 95% confidence intervals (CI) are indicated.
175 and 275 m. After exposure to CHX_1, acid production was elevated in the biofilm to 150 m. After exposure to CHX_10 and after PFA killing, local acidification was suppressed throughout the biofilm. CLSM. Microbial viability. CLSM analysis revealed a comparable mean Lf of 230 to 240 m for all treatment modes (Table 1). Depending on the high density of in vivo-created dental biofilms, the laser penetration depth was limited to the outer 40 to 100 m (65.6 ⫾ 24.1 m) of the biofilm cell clusters. Thus, deeper areas could not reliably be visualized. The viability of untreated biofilms was ca. 60 to 70%. The distribution of live and dead or damaged bacteria showed no distinct distribution pattern. After CHX treatment, the mean viability was reduced to 2.0% (CHX_1) and 0.7% (CHX_10), respectively. The microorganisms at the biofilm surface were killed or damaged by CHX (Fig. 8). The PFA-“killed” control indicated a viability of almost 19% based on the Live/Dead stain. Total bacterial counts and CFU/mm2. The log BC/mm2 values ranged between 7.27 (⫹suc) and 6.57 (PFA) and were similar for dental biofilms without and after treatment with CHX and PFA (Fig. 9). Almost 38% of the native biofilm microorganisms were culturable (log CFU/mm2 6.81; ⫺suc). After sucrose exposure, the number of CFU increased (log CFU/mm2 7.13). CHX_1 treatment had a minor influence
FIG. 7. Local oxygen (f) and H⫹ (䡺) uptake rates in different layers of dental biofilms in situ (1:10 buffered saliva) without sucrose (⫺suc), with 10% (wt/vol) sucrose (⫹suc), and with 10% sucrose after 1 min (CHX_1) or 10 min (CHX_10) of CHX treatment and in a PFA-killed control (PFA). Error bars correspond to 95% confidence intervals. A negative uptake rate indicates net production, and a positive uptake rate indicates net consumption.
VOL. 76, 2010
LOCAL METABOLIC ACTIVITIES IN DENTAL BIOFILMS
2331
FIG. 8. Micrographs depicting the dental biofilms after staining with Live/Dead BacLight. Live or vital bacteria are green, and dead or damaged bacteria are red. Three-dimensional reconstructed confocal images and corresponding optical sections (xz and yz) at low magnification are shown. Scale bar, 200 m. (a) Native 3-day-old dental biofilm showing a haphazard arrangement of vital MO and damaged cells with unstained areas in between; (b) biofilm after 1 min of CHX treatment (CHX_1) displaying only damaged bacteria at the surface; (c) biofilm after 10-min CHX treatment (CHX_10) with a similar appearance; (d) PFA-killed control.
(log CFU/mm2 6.45), whereas CHX_10 led to a reduction to log 4.93 CFU/mm2. The PFA exposure reduced the CFU by almost 6 log units. Diffusive transport of CHX within the biofilm. Assuming the transport of CHX from the solution into the biofilm is driven by diffusion, concentrations could be modeled along biofilm depth for different incubation times (Fig. 10). An assumed critical concentration of 0.1% CHX was reached only in a depth of 70 m after 1 min and also after 10 min in a biofilm depth of about 230 m, but not in the deepest biofilm layers.
Statistics. A summary of the statistical analysis results for the different investigation variables is given in Table 2. DISCUSSION Changes in the gradients of oxygen and pH in response to sucrose and additional CHX treatment in complex dental biofilms formed in vivo were measured by microelectrodes under real-time nondestructive conditions. The local effects on respiration and acidification inside dental biofilms were docu-
2332
VON
OHLE ET AL.
APPL. ENVIRON. MICROBIOL. TABLE 2. Results (P values) of the statistical comparison between different treatment modes determined using ANOVAa P value for: Biofilm conditions Compared treatments
FIG. 9. Total bacterial cell counts (log BC/mm2, 䡺) and CFU (log CFU/mm2, f) in native dental biofilms (⫺suc), after sucrose exposure (⫹suc) or after 1 min (CHX_1) or 10 min (CHX_10) of treatment with CHX and in a PFA-killed control. Error bars correspond to the 95% confidence intervals.
mented. With unsupplemented saliva, oxygen consumption in the upper biofilm layer resulted in the bottom half of the biofilm being anoxic. Microbial respiration activity was obviously driven by endogenously produced substrates or salivary components, as became evident from the complete lack of activity in the PFA-killed control. Similar gradients have been documented in Pseudomonas aeruginosa (51), Streptococcus epidermidis, and Staphylococcus aureus (33) biofilms. Oxygen consumption in human dental biofilms has been found to be caused by Gram-positive microorganisms and especially oral streptococci (28, 46), not only for respiration but also to produce H2O2, which is presumed to be a mechanism by which to attack competing bacteria (23, 31). The result is that an anoxic niche conducive to the survival of anaerobic or acidogenic bacteria is created in deeper layers of the biofilm (22, 32). After sucrose addition the thickness of the anoxic layer increased, presumably due to increased respiration and other oxygen consuming metabolic activity in the upper layer. Concomitantly, a strong decrease in pH occurred in the anoxic region. The dynamic response of the dental biofilm physiology to environmental changes occurred instantly, and a new equilibrium was established within minutes. Comparable results were shown by Stoodley et al. (42) in S. mutans biofilms.
FIG. 10. Modeled concentration profiles of a 0.2% CHX formulation in dental biofilms at different incubation times (t) between 10 and 600 s.
⫺suc/⫹suc ⫹suc/CHX_1 ⫹suc/CHX_10 ⫹suc/PFA
Biofilm structure and viability
Flux O2
H⫹
Anaerobic depth
0.03 0.22 0.14 0.01
0.01 0.08 0.01 0.04