REAL-TIME STEREO TO MULTI-VIEW VIDEO CONVERSION
A THESIS SUBMITTED TO THE GRADUATE SCHOOL OF NATURAL AND APPLIED SCIENCES OF MIDDLE EAST TECHNICAL UNIVERSITY
BY
CEVAHĠR ÇIĞLA
IN PARTIAL FULFILLMENT OF THE REQUIREMENTS FOR THE DEGREE OF DOCTOR OF PHILOSOPHY IN ELECTRICAL AND ELECTRONICS ENGINEERING
JULY 2012 1
Approval of the Thesis: REAL-TIME STEREO TO MULTI-VIEW VIDEO CONVERSION
submitted by CEVAHİR ÇIĞLA in partial fulfillment of the requirements for the degree of Doctor of Philosophy in Electrical and Electronics Engineering Department, Middle East Technical University by,
Prof. Dr. Canan Özgen Dean, Graduate School of Natural and Applied Sciences
______________
Prof. Dr. Ġsmet Erkmen Head of Department, Electrical and Electronics Engineering
______________
Prof. Dr. A. Aydın Alatan Supervisor, Electrical and Electronics Engineering Department, METU ______________
Examining Committee Members Prof. Dr. Bülent Sankur Electrical and Electronics Engineering Department, Boğaziçi University
______________
Prof. Dr. A. Aydın Alatan Electrical and Electronics Engineering Department, METU
______________
Prof. Dr. Levent Onural Electrical and Electronics Engineering Department, Bilkent University
______________
Prof. Dr. Gözde Bozdağı Akar Electrical and Electronics Engineering Department, METU
______________
Assist. Prof. Dr. Erhan Eren Informatics Institute, METU
______________
Date:
2
02.07.2012
I hereby declare that all information in this document has been obtained and presented in accordance with academic rules and ethical conduct. I also declare that, as required by these rules and conduct, I have fully cited and referenced all material and results that are not original to this work.
Name, Last Name : Cevahir Çığla Signature :
iii
ABSTRACT
REAL-TIME STEREO TO MULTI-VIEW VIDEO CONVERSION
Cevahir Çığla Ph.D., Department of Electrical and Electronics Engineering Supervisor: Prof. Dr. A. Aydın Alatan
July 2012, 179 pages
A novel and efficient methodology is presented for the conversion of stereo to multi-view video in order to address the 3D content requirements for the next generation 3D-TVs and auto-stereoscopic multi-view displays. There are two main algorithmic blocks in such a conversion system; stereo matching and virtual view rendering that enable extraction of 3D information from stereo video and synthesis of inexistent virtual views, respectively. In the intermediate steps of these functional blocks, a novel edge-preserving filter is proposed that recursively constructs connected support regions for each pixel among color-wise similar neighboring pixels. The proposed recursive update structure eliminates pre-defined window dependency of the conventional approaches, providing complete content adaptibility with quite low computational complexity. Based on extensive tests, it is observed that the proposed filtering technique yields better or competitive results against some leading techniques in the literature. The proposed filter is mainly applied for stereo matching to aggregate cost functions and also handles occlusions that enable high quality disparity maps for the stereo pairs. Similar to box filter paradigm, this novel technique yields matching of arbitrary-shaped regions in constant time. Based on Middlebury benchmarking, the proposed technique is currently the best local matching technique in the literature in terms of both
iv
precision and complexity. Next, virtual view synthesis is conducted through depth image based rendering, in which reference color views of left and right pairs are warped to the desired virtual view using the estimated disparity maps. A feedback mechanism based on disparity error is introduced at this step to remove salient distortions for the sake of visual quality. Furthermore, the proposed edge-aware filter is re-utilized to assign proper texture for holes and occluded regions during view synthesis. Efficiency of the proposed scheme is validated by the real-time implementation on a special graphics card that enables parallel computing. Based on extensive experiments on stereo matching and virtual view rendering, proposed method yields fast execution, low memory requirement and high quality outputs with superior performance compared to most of the state-of-the-art techniques. Key Words: Content adaptive filter, stereo matching, virtual view rendering, parallel implementation, stereo-to-multi-view conversion
v
ÖZ GERÇEK ZAMANDA STEREODAN ÇOK-GÖRÜNTÜLÜ VĠDEOYA DÖNÜġÜM
Cevahir Çığla Doktora, Elektrik-Elektronik Mühendisliği Bölümü Tez Yöneticisi: Prof. Dr. A. Aydın Alatan
Temmuz 2012, 179 sayfa
Yeni jenerasyon 3B-TV'ler ve oto-stereoskopik çok görüntülü ekranlar için uygun içerik sağlamak için etkin ve yenilikçi bir stereodan çok-görüntülü videoya dönüĢüm yöntemi sunulmaktadır. Böyle bir dönüĢüm sisteminde, temel olarak, stereo görüntüden 3B bilgisi çıkarımını ve varolmayan görüntülerin sentezini amaçlayan, sırasıyla stereo eĢleme ve sanal görüntü oluĢturma olmak üzere iki ana algoritma bloğu bulunmaktadır. Bu fonksiyonel blokların ara aĢamalarında, her pikel için renk benzerliğine sahip komuĢu pikseler üzerinden bağlı destek bölgeleri oluĢturan, yeni bir kenar koruyan filtre önerilmektedir. Sunulan döngülü güncelleme, filtrelerdeki geleneksel pencere kullanımını ortadan kaldırmakta ve tamamen içeriğe bağlı bir filtrelemeyi, düĢük iĢlem karmaĢıklığıyla gerçeklemektedir. Kapsamlı testler sonucunda, önerilen filtrenin literatürdeki öncü yaklaĢımlardan daha iyi veya karĢılaĢtırılabilir sonuçlar elde ettiği gözlenmektedir. Önerilen filtre, temel olarak stereo eĢleme sırasında yüksek kalitede derinlik haritaları elde edilmesini sağlayan ceza fonksiyonlarının biriktirilmesi ve örtük bölgelerin düzeltilmesi için kullanılmaktadır. Bu yenilikçi yaklaĢım, integral görüntü paradigmasına benzer bir Ģekilde, her pikselin adaptif ağırlıklar ile sabit zamanda eĢlenmesini sağlamaktadır. Middlebury karĢılaĢtırmalı değerlendirmesine göre, önerilen teknik, daha az iĢlem karmaĢasıyla daha doğru sonuç vermesi açısından literatürdeki en iyi bölgesel stereo eĢleme algoritması olmaktadır. Derinlik vi
kestirimi yapıldıktan sonra, sanal görüntü oluĢturulması, referans görünülerin istenen bakıĢ açısına taĢınmasına dayanan derinlik tabanlı sentez ile sağlanmaktadır. Bu aĢamada, dikkat çeken bölgelerdeki hataların ortadan kaldırılması için derinlik hata geribildirimi mekanizması önerilmektedir. Bunun yanında, kenar-farkında filtre, görüntü sentezleme sırasında oluĢan boĢluk ve örtük bölgelere uygun renk atamasının sağlanması için değiĢtirilerek kullanılmaktadır. Önerilen sistemin etkinliği, paralel iĢleme olanağı sağlayan özel bir ekran kartı üzerinde gerçek zamanlı uyarlama ile kanıtlanmaktadır. Stereo eĢleme ve sanal görüntü oluĢturma üzerinde yapılan kapsamlı deneyler sonucunda, önerilen yaklaĢım varolan tekniklere göre, iĢlem hızı, hafıza isteri ve çıktı kalitesi açısından daha iyi performans sağlamaktadır. Anahtar Kelimeler: Kenar-farkında renk filtresi, stereo eĢleme, sanal görüntü oluĢturma, parallel uyarlama, stereo-çoklu görüntü dönüĢümü
vii
ACKNOWLEDGEMENTS
It would not have been possible to write this doctoral thesis without the help and support of the kind people around me, to only some of whom it is possible to give particular mention here. First of all, I would like to thank my wife Hande for her love, support and great patience at all times. Her understanding and encouragement gave me the enthusiasm to finish this work. My parents and parents in law have given me their unequivocal support throughout, as always, for which my mere expression of thanks likewise does not suffice. I would like to thank my supervisor Prof. Dr. Aydın Alatan for his guidance, suggestions and also for the great research environment he had provided. I appreciate all his contributions of time, ideas and funding to make my Ph.D. experience productive and stimulating, I have learned a lot from him. I would also like to thank my jury members for their suggestions and valuable feedbacks. I have spent invaluable times with Emrah TaĢlı, Burak Özkalaycı, Ahmet Saracoğlu and Osman Serdar Gedik in an excellent research environment; they cooperated with me in various stages of my PhD studies. I would further like to thank Emrah and Burak, for their efforts and brilliant ideas on our collaborative works. Special thanks to my former colleagues in VESTEK, Aydın Aysu and Murat Sayınta, for their great work of mapping stereo matching algorithm to FPGA for 3D-TV setup. My sincere thanks go to all organizations which gave me indispensable sponsoring, including TUBITAK BIDEB for the PhD scholarship, VESTEK that provided me an excellent research environment and 3DTV NoE through which my research efforts have began.
viii
To my wife …
ix
TABLE OF CONTENTS
ABSTRACT............................................................................................................................ iv ÖZ ........................................................................................................................................... vi ACKNOWLEDGEMENTS .................................................................................................. viii TABLE OF CONTENTS ......................................................................................................... x ABBREVIATIONS .............................................................................................................. xiii CHAPTERS 1
2
INTRODUCTION ........................................................................................................... 1 1.1
Problem Definition ................................................................................................. 2
1.2
Existing Solutions ................................................................................................... 3
1.2.1
Stereo Matching ................................................................................................. 4
1.2.2
Virtual View Rendering ..................................................................................... 5
1.2.3
Real-time Implementation .................................................................................. 6
1.3
Contributions .......................................................................................................... 6
1.4
Outline of the Thesis............................................................................................... 7
EDGE-AWARE FILTER ................................................................................................ 9 2.1
Related Work ........................................................................................................ 11
2.1.1
Bilateral Filter .................................................................................................. 11
2.1.2
Two pass Bilateral Filter .................................................................................. 12
2.1.3
Constant time Bilateral Filter ........................................................................... 13
2.1.4
Guided Filter .................................................................................................... 14
2.1.5
Cosine Integral Images ..................................................................................... 15
2.1.6
Adaptive Box Filter .......................................................................................... 16
2.1.7
Geodesic Support Filter.................................................................................... 17
2.1.8
Arbitrary Shaped Cross Filter .......................................................................... 19
2.2
Shortcomings of the Prior Art .............................................................................. 20
2.3
Proposed Approach .............................................................................................. 21
2.3.1
4-Neighbor Permeability Filter ........................................................................ 22
2.3.2
8-Neighbor Permeability Filter ........................................................................ 32
2.4
Complexity Analysis ............................................................................................ 38
x
3
2.5
Experimental Results ............................................................................................ 40
2.6
Conclusion ............................................................................................................ 46
STEREO MATCHING .................................................................................................. 48 3.1
Related Work ........................................................................................................ 51
3.2
Motivation ............................................................................................................ 53
3.3
Proposed Approach .............................................................................................. 54
3.3.1
Cost Calculation ............................................................................................... 55
3.3.2
Cost Aggregation ............................................................................................. 56
3.3.3
Minimization .................................................................................................... 58
3.3.4
Occlusion Handling .......................................................................................... 58
3.3.5
Temporal Consistency ...................................................................................... 62
3.4 3.4.1
Static Scenes..................................................................................................... 64
3.4.2
Accuracy .......................................................................................................... 64
3.4.3
Dynamic Scenes ............................................................................................... 77
3.4.4
Analysis of the Algorithm ................................................................................ 77
3.5 4
Conclusion ............................................................................................................ 85
VIRTUAL VIEW RENDERING................................................................................... 86 4.1
Related Work ........................................................................................................ 87
4.2
Motivation ............................................................................................................ 91
4.3
Proposed Approach .............................................................................................. 95
4.3.1
Disparity Map Refinement ............................................................................... 95
4.3.2
Pre-process of Disparity Maps ......................................................................... 98
4.3.3
Virtual View Depth Composition .................................................................... 99
4.3.4
Texture Selection ........................................................................................... 100
4.3.5
Hole Completion ............................................................................................ 102
4.4
Experimental Results .......................................................................................... 108
4.4.1
Comparison with State-of-the-Art .................................................................. 109
4.4.2
Analysis of Algorithmic Subblocks ............................................................... 123
4.4.3
Stereo to Multi-view Conversion ................................................................... 130
4.5 5
Experimental Results ............................................................................................ 64
Conclusion .......................................................................................................... 134
GPU IMPLEMENTATION ......................................................................................... 136 5.1
Related Work ...................................................................................................... 138
5.2
Proposed Implementation ................................................................................... 139
xi
5.2.1
Stereo Matching ............................................................................................. 140
5.2.2
Virtual View Rendering ................................................................................. 147
5.3 5.3.1
Improvement over CPU ................................................................................. 150
5.3.2
Comparison with State-of-the-Art .................................................................. 154
5.4 6
Experimental Results .......................................................................................... 150
Conclusion .......................................................................................................... 156
SUMMARY AND CONCLUSION............................................................................. 158 6.1
Summary and Contributions ............................................................................... 158
6.2
Conclusions ........................................................................................................ 160
6.3
Future Directions ................................................................................................ 162
REFERENCES .................................................................................................................... 165 VITA .................................................................................................................................... 175
xii
ABBREVIATIONS
3D TV: 3 Dimensional Television FTV: Free-view Television CVS: Conventional Stereo Video MVV: Multi-view Video SWS: Successive Weighted Summation VVR: Virtual View Rendering DIBR: Depth Image based Rendering GPU: Graphics Processing Unit FPGA: Field Programmable Gate Arrays CUDA: Compute Unified Device Architecture BF: Bilateral Filter DP: Dynamic Programming WTA: Winner Takes All PF: Permeability Filter SAD: Sum of Absolute Distance PSNR: Peak Signal Noise Ratio SSIM: Structural Similarity Index IW-SSIM: Information Weighted Structural Similarity Index MSSIM: Multi-resolution Structural Similarity Index DERS: Depth Estimation Reference Software VSRS: View Synthesis Reference Software SD: Standard Definition MDE: Million Disparity Estimation
xiii
CHAPTER 1
1
INTRODUCTION
The recent advances in video capture and display techniques have pioneered the resurgence of 3D mainstream. The intensive attention on 3D movies and sale records of 3D market forced TV manufacturers to provide solutions for living rooms via special equipped TV systems. As a result, 3D TVs have gained popularity with a share of 20% in 2012 that is an alternative technology replacing traditional TVs. Display techniques that provide 3D perception can be categorized into four: standard displays with a set-up box, stereoscopic displays, auto-stereoscopic displays and multi-view displays. In the first case, which actually corresponds to free-view TVs, incoming data involve multiple views of a scene at a time instant giving an opportunity to the viewer for changing the viewing position. This ability requires 3D structure of a scene to provide views from different positions. The second alternative, stereoscopic displays, is the most endeavored class for TV companies to present 3D perception. These displays require stereoscopic video and special type of glasses, shutter or polarized, to provide two views for left and right eyes yielding 3D perception. The glasses have the role of filtering mixed views for each eye compatible with display technology. This technology involves two main approaches; shutter displays, which provide left and right views alternatively at twice of the refresh rate of the panel, are synchronized with shutter glasses. On the other hand, polarized panels display mixed images with opposite linear or circular polarization that are filtered through polarized glasses by the corresponding polarization directions. Hence, both type of displays separate stereo views to be observed for different eyes, which are merged by brain to percept 3D. In auto-stereoscopic displays, separation of stereo views for each eye is provided by lenticular sheets or parallax barriers placed in front of the panel, which refract or split video signal into left and right views. The role of polarized display and glasses is replaced by lenticular sheets, yielding glass-free 3D perception. Finally, multi-view auto-stereoscopic displays are the extensions of auto-stereoscopic displays which support more than two views
1
and increase variety of looking directions. As the viewing direction changes, the refracted stereo pair also changes, resulting in 3D perception from different directions; this provides a realistic scenario. Therefore, it could be concluded that multi-view displays are the strongest candidate for the next generation 3D TVs with improved reality. The requirement of only two cameras and no necessity for 3D extraction provide conventional stereo video format to be popular among many alternatives [1] [2]. The effect of these properties can be clearly observed in film industry by the common trend of 3D films introduced with polarized or shutter glasses and broadcast of stereo content in digital channels. It is clear that for a certain period of time, conventional stereo video (CSV) and polarized/shutter glasses will dominate 3D applications in consumer electronics. As a consequence of this new trend, in the next decade, stereo content is expected to be quite common, as traditional mono video. The simplicity of stereoscopic displays with CSV format comes with the limitations of two views and requirement for wearing glasses. These limitations decrease the reality of 3D perception, and this is the main obstacle of the current 3D mainstream. On the other hand, multi-view auto-stereoscopic displays provide much more realistic 3D perception by preserving parallax among different viewing locations without any need of glasses. However, this type of displays requires multiple views of a scene at a time instant and this is a difficult task to realize due to problems of multiple camera placement, as well as synchronized data acquisition. Considering the emergence of stereoscopic content for 3D TVs and cinemas, a practical solution for this problem is conversion of stereo video to multiview format.
1.1
Problem Definition
In the light of fast emerging 3D applications in consumer electronics, especially in TV sets and mobile devices, the requirement of multi-view content for next generation 3D TVs is a crucial problem. In this thesis, conversion of stereo content to multi-view that should enable driving multi-view auto-stereoscopic displays by current widespread 3D format CSV is addressed. Such a solution eliminates several difficulties of multi-view content creation, while extending the reality of 3D perception. Moreover, intermediate outcomes of this
2
conversion provide increased functionality of current 3D TV sets enabling depth adjustment and depth-based enhancement. Based on the processing platform, stereo to multi-view conversion can be performed on TV units or during content creation stage. The first scenario utilizes advantages of the infrastructure of current 3D sources such as broadcast or disc media without any modifications; while online (real-time) conversion is required to deliver multi-view content to the viewer. Once this process is available on TV side, functional flexibility can also be provided improving 3D experience. According to the second scenario, conversion can be provided with offline processing at the source of content creation. This can be performed supervised, semi-supervised or fully automatic manners, requiring various human and computer resources. However, delivery of the converted multi-view data cannot be achieved directly through the existing technology. According to the advantages of current 3D infrastructure, intensive amount of stereo content and functional flexibility, conversion on the display side seems to be more practical and applicable to provide required 3D content for next generation 3D TVs. Hence, computationally efficient conversion of stereo video to multi-view is the main goal of this dissertation in order to enhance 3D perception at home. It is also important to note that tools developed for online conversion can also be applied for automatic offline conversion with further modifications; providing a generic solution to be applicable for various purposes.
1.2
Existing Solutions
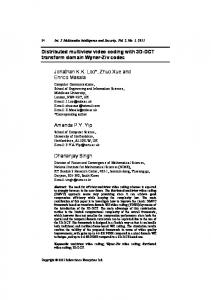
A conventional approach for stereo-to-multi-view conversion is generation of necessary views from existing views through utilization of 3D information as illustrated in Figure 1.1. In such a procedure, there are usually two fundamental steps: extraction of 3D by stereo matching and virtual view rendering (VVR).
3
Figure 1.1: Two main steps, stereo matching and virtual view rendering are utilized for the conversion of stereo video to multi-view video
1.2.1
Stereo Matching
Stereo matching is the tool to extract parallax between two images captured from different camera locations. Parallax extraction provides a strong cue for the depth information; when executed for all pixels, dense depth (disparity) maps carrying quite extensive 3D information associated with a scene. There are various techniques [4]-[43] to perform stereo matching based on different optimization approaches. These techniques make use of two basic assumptions, namely the smoothness of depth field and high level of visual similarity across pixels in stereo images. Considering the efficiency, which involves low computational complexity and memory requirement, matching techniques that only utilize local intensity information, namely local methods [5]-[11], are the most endeavored way for real-time stereo matching. They perform aggregation among neighbor pixels to fuse smoothness by utilization of edge-aware filters [45]-[53] that preserve sharp depth discontinuities and yield precise disparity maps. The characteristics of such aggregation filters provide a trade-off between complexity and accuracy which is the key issue for local stereo matching. Apart from stereo matching, edge-aware filters are also popular for wide application areas, involving depth up-sampling, hole completion that are applicable for intermediate problems of stereo-to-multi-view conversion. Therefore, complexity and robustness of edgeaware filters determine limits and adaptability of the developed tools. Edge-aware filters, in
4
general, introduce additional complexity as accuracy increases. Thus, noteworthy research is devoted to obtain low complexity edge-aware filters without any sacrifice from precision. Proposed solution for the extraction of 3D information from stereo pairs in this thesis follows local optimization techniques by introducing a novel edge-aware filter improved for geometry related applications. Hence, low computational complexity and high accuracy are intended to provide aggregation through connected 2D support regions that is applicable for various purposes. The proposed approach exploits a new paradigm, namely separable successive weighted summation (SWS) along horizontal and vertical directions, enabling constant operational complexity. SWS adaptively accumulates the support data based on local characteristics, enabling disparity maps to preserve object boundaries and depth discontinuities. The weights for SWS are determined by intensity similarity of pixels within four (eight)-neighborhood and utilized to model the information transfer rate, denoted by the term permeability, towards the corresponding direction. A similar procedure is also utilized for post-processing of disparity maps to fuse consistency along spatial and temporal domains.
1.2.2
Virtual View Rendering
The synthesis of inexistent views from a collection of reference images is called virtual view rendering. There are mainly three categories for VVR depending on the available 3D formats as classified in [77]. For the conversion of stereo vide to multi-view, depth image based rendering (DIBR) [82][102] is the most endeavored solution enabling visually pleasing results. In this approach, virtual views are generated from the texture of reference views according to the 3D structure of the scene. For this purpose, 3D warps are conducted to carry texture between source and target cameras. In this thesis, the general flow of DIBR methods is improved by a disparity correction mechanism that addresses the errors of 3D structure due to imperfect stereo matching. Moreover, a novel hole completion approach is presented as an extension of proposed edgeaware filter, providing proper texture and color assignment for the regions which are not visible by any source view.
5
1.2.3
Real-time Implementation
Implementation of the presented algorithms on special hardware such as Graphics Processing Unit (GPU) is the most endeavored way for validating its efficiency. In this manner, Nvidia CUDA provides an excellent platform to execute stereo matching algorithms with real-time performance as presented in various studies [120]-[131]. Activating multiple processors by a single instruction is the key point to enable parallelization; however this introduces several limitations on algorithm flow. GPU intended constraints encourage independent operations while punishing recursive structures. From this point of view, presented algorithms for stereo matching and VVR enable fine parallelization providing realtime execution for specific configurations determined by the algorithm parameters. Hence, GPU implementations of the fundamental algorithmic blocks are provided for the sake of completeness of the efforts devoted for efficiency.
1.3
Contributions
The presented algorithms are designed along with low complexity and high accuracy requirements to obtain efficient stereo-to-multi-view conversion. From this point of view, contributions of this thesis to the state-of-the-art can be summarized as follows: Edge-Aware Filter: A general-purpose low complexity edge-aware filter (permeability filter) is introduced providing connected support regions for each pixel with no pre-defined window size that is totally determined by the local color characteristics of the image. Hence, proposed filter is adaptive to color changes within the image that preserves edge discontinuities during aggregation. Filtering is accomplished by only six addition and four multiplication operations for each pixel similar to box filter paradigm with two main advantages: Weighted averaging is achieved among large support regions without any restriction of pre-defined windows and edge-awareness which prevents over smoothing is provided. Based on large number of experiments against the state-of-the-art, efficiency of the proposed filter is quite clear, especially for geometry related applications, in terms of computational load and accuracy. Stereo Matching: As the main application, the proposed edge-aware filter is applied for stereo matching to achieve fast execution and high precision. In this manner, two disparity
6
maps are estimated for left and right views, and the same filter is modified to assign consistent values for occluded pixels in disparity maps. Extended to temporal domain, permeability idea yields robust and smooth disparity maps for stereo video, presenting an efficient alternative with superior performance to the existing body of knowledge. Virtual View Rendering: Introduced disparity correction feedback mechanism yields visually pleasing virtual views especially along salient regions involving text. The presented hole completion enables proper texture assignment for occluded pixels without any disturbing perception. Supported by various objective quality metrics, highly correlative with human perception, presented VVR tool provides competitive rendering for automatic conversion of stereo-to-multi-view. Real-time Implementation: Parallel implementations of the proposed stereo matching and virtual view rendering tools are provided as the evidence of their efficiency. Real-time processing capability is met by the proposed GPU implementation through careful partitioning of each algorithm block. Moreover, presented stereo matching algorithm is implemented in field programmable gate arrays (FPGA) for prototype consumer electronics 3D TVs, in order to enable functional flexibility for various applications. Free-view 3D TV: Different from conventional free-view (2D) TV, as a novel application to increase functionality of existing 3D TVs, stereo matching and VVR tools can be applied to free-view stereo, where users are able to change their viewpoint while still perceiving 3D. For this purpose, depending on the viewpoint, stereo pairs that preserve 3D perception are generated. Actually, free-view 3D TV is one step behind multi-view autostereoscopic displays, since it requires polarized/shutter glasses; however, it yields arbitrary viewing angles. Hence, as an intermediate outcome of the proposed stereo-to-multi-view conversion scheme, stereo-to-floating-stereo conversion provides further flexibility to existing 3D TVs.
1.4
Outline of the Thesis
Following the common solution methodology summarized in Section 1.3, Chapter 2 is devoted to the paradigm of edge-aware filter which is the fundamental tool for various applications throughout this thesis. Giving the literature review of edge-aware filters, proposed approach which addresses fundamental disadvantages of the prior-art is detailed. In
7
that chapter, based on the neighboring criteria, two alternatives of the proposed filter are presented. Comparative analyses are given in terms of memory requirement and computational complexity that are validated by experiments on depth data up-sampling under the scope of this thesis. In Chapter 3, literature survey of stereo matching is given and the proposed algorithm is presented with extensions in temporal domain. Intensive comparisons are conducted over well-known stereo pairs with ground truth disparities in order to interpret capability of the proposed algorithm. For this purpose, aggregation methods of several edge-aware filters are compared in terms of complexity and precision for stereo matching that completes comparative tests conducted in the previous chapter. Moreover, a detailed analysis of the proposed algorithm for which the reasoning behind parameter selection is given and effects of intermediate steps as well as multi-resolution and temporal extensions are discussed. Chapter 4 presents the work for development of virtual view rendering. After the literature survey, fundamental problems and the motivation behind proper VVR are discussed. The proposed method addressing the fundamental needs of visually pleasing virtual views is presented. The proposed approach and reference rendering software developed for MPEG 3DV/FTV standardization efforts are compared for different rendering scenarios. After analyzing the effect of each algorithmic step, typical stereo to multi-view conversion examples are given for different scenes. Details of the parallel implementation of proposed stereo matching and VVR tools in GPU are given in Chapter 5, together with the properties of the implementation platform. Reasoning behind parallel process partitioning of each block is explained in detail. Improvements due to GPU implementation over CPU is presented in the experiments section, including stereo estimation and VVR steps. Finally, the experimental validation of this thesis is completed with a comparative analysis against state-of-the-art GPU implementations. Final chapter is devoted to the summary and conclusive remarks of the presented stereoto-multi-view conversion method with future directions of research.
8
CHAPTER 2
2
EDGE-AWARE FILTER
Content adaptive filtering [45]-[48] has been popular in computer vision for various applications due to its non-linear edge preserving characteristics. The fundamental idea behind this type of filtering is to provide intensity adaptive weights within a pre-defined window by highlighting color-wise similar pixels and achieving weighted averaging. Edge preserved smoothing characteristics yield great advantages over traditional linear time invariant (LTI) smoothing operators, such as Gaussian, Laplacian and Sobel filters which are spatially invariant and independent of image content. Therefore, anisotropic diffusion was proposed in [49], [50] as a general iterative approach to provide edge-aware smoothing. Recently, bilateral filter [45], whose relevance with anisotropic diffusion is illustrated in [51], has become the most popular of such filters with its non-iterative structure. During the last decade, bilateral filtering is adapted to various applications [52] involving image mating [53], denoising [54][55], colorization [56], multi-scale decomposition [57], stereo matching [58], tone mapping [59], video abstraction [60], motion estimation [61] and depth data upsampling [62]. In most of these approaches, joint (cross) bilateral filter approach is utilized, in which an image (data) is filtered according to the color variation of the guidance (another) image through which adaptive weights are determined. The filtered image can be nonflashed view [59], cost data calculated in stereo matching [58] or motion estimation [61], low resolution depth map [62] or the data itself as in denoising [54]. In Figure 2.1, typical adaptive weight distributions of two pixels in the center locations of the square regions are illustrated. The neighbor pixels having similar color with the center pixel are assigned to some weighting coefficients that are close to “1” (shown by bright intensities), while for the dissimilar pixels these coefficients tend to be “0”. It is obvious that edge characteristics of the color image are preserved in the weight map, as well. Hence, weighted averaging through color similarity preserves edge characteristics in the filtered data. This is an important property that further improves the accuracy of the filtering operation for various applications.
9
Figure 2.1: Typical examples of color adaptive weight distribution.
Despite the wide application areas, there are certain drawbacks of bilateral filters in terms of computational complexity and accuracy. Direct implementation of the bilateral filter among NxN support area requires high computation complexity of (O(N2)). Therefore, a part of the research is focused on complexity reduction, as given in [52], [63]-[68]. In [52] and [68], 2D filtering is achieved by performing successive orthogonal 1D filtering along the horizontal and vertical axis, as in steerable filters [69]. On the other hand, in [63], multiple box filters [70] are fused to obtain weighted averaging with a complexity independent of window size. In addition to the efforts on decreasing computational complexity of bilateral filters, there is also research focused on reducing artifacts, such as Guided Filter [47], Cosine Integral Images [48] which utilize the efficiency of box filters, as well. In [71], Geodesic Distance extending color adaptability to connected support regions that enforces color-path continuity among neighboring pixels is introduced. The connectedness is vital for applications that involve geometric structures, such as depth up-sampling, stereo matching or motion flow estimation. This additional requirement increases the computational complexity, as well as the performance. On the other hand, in [8], connectedness is guaranteed by exploiting box filters through arbitrary support regions. Various approaches providing edge-aware filtering are further discussed in the next section of this chapter. After pointing the disadvantages of the prior art, a novel filtering
10
approach developed for geometry related applications in the scope of this dissertation is introduced. In the following section, a detailed experimental comparison of the state-of-the art edge-aware filters with the proposed method is given in terms of the computational complexity and memory requirement. The comparisons are justified by the experimental results and the final section is devoted to the conclusion and discussions.
2.1
Related Work
In this section, the state-of-the-art edge-aware filters in terms of efficiency and precision are summarized by starting with the bilateral filter [45] which introduces a non-iterative approach for this purpose. Then, two faster approximations [52][64] of the bilateral filter, where [52] is a separable implementation and [64] is its fastest approximation in literature are given Guided Filter [47], which is a recent alternative for edge-preserving filters with its window independent computational complexity, is also analyzed. This analysis is followed by Cosine Integral Image [48] algorithm, extending the well known box filters to weighted domain. An alternative Integral Image method is also included which is a slightly modified version of the box filter adapted to edge-preserving characteristic is also included. Connected support region phenomenon is introduced by the Geodesic Distance Transform [71] in the next section; finally, an efficient edge-aware filter [8] which utilizes arbitrary shaped support regions with constant weight distribution is explained.
2.1.1
Bilateral Filter
Let x, y
Z be the pixel indexes among a color image, I, involving integer intensity
levels. A bilateral filter [45], BF, outputs color adaptive average, IF(x), of a pixel x, among a set of pixels, N(x), according to
I F ( x)
F ( x, y) F I ( x), I ( y).I ( y)
yN ( x )
s
R
F ( x, y) F I ( x), I ( y)
yN ( x )
s
,
(2.1)
R
where the range kernel, FR, assigns weights depending on intensity similarities between I(x) and I(y) based on a scaling factor σ as
11
FR ( I ( x), I ( y)) e
I ( x ) I ( y ) /
.
(2.2)
On the other hand, spatial kernel, Fs, weights according to the distance between pixel locations as follows:
FS ( x, y) e
x y /
.
(2.3)
The weights of the neighboring pixels in an NxN square window are determined by the combination of these two kernels, while color-wise similar pixels are assigned higher weights. The denominator in (2.1) provides the normalization of the weighted summation in the numerator, and corresponds to the total weights utilized during the calculations for pixel x. The range functions, FR, can be computed on another type data such as depth, D(x), and then the operation turns into joint bilateral filtering which enforces local characteristics of D(x). The main objective of the bilateral filter is the replacement of each pixel by the weighted average of their neighbors. Hence, intuitive behavior of BF is simple; it should smooth an image, remove texture, fine details and noise, while preserving sharp edges without any blurring artifact. According to the direct implementation of BF, for each pixel N2 weight calculations, multiplications and additions are required for such a weighted averaging. Such a complex computation characteristics requires several approximations to achieve faster filtering. The behavior of BF is studied extensively in the literature [52] and many approximations are proposed to obtain faster execution times. In this dissertation, the most trivial and the fastest approximations are included to make fair comparison among edge-aware filters.
2.1.2
Two pass Bilateral Filter
From the complexity reduction point of view, one of the most common approaches is separable horizontal-vertical filtering [52]. Instead of calculating weighted averages among a 2D NxN window, one dimensional (with length of N) two bilateral filters can be applied among rows and columns consecutively. This process results in an effective weighted averaging within an NxN window with significantly reduced complexity O(N), instead of O(N2), where 2N weight calculations, multiplications and additions are required per each pixel. Although, BF is not a separable filter due to color similarity terms, it has been proven
12
in [52] that two-pass approximation yields comparative results as long as the window length is below a certain level.
2.1.3
Constant time Bilateral Filter
In [63], constant time computation of BF yielding window size independency via three different methods has been presented. In the first approach, accumulated histograms are exploited to avoid redundant operations for filtering with box spatial and arbitrary range kernels. A direct formula is also proposed as a second approach in which summed area tables of image powers are utilized with polynomial range and arbitrary spatial kernels. In the third approach, Gaussian range and arbitrary spatial kernels are unified by a Taylor series expansion. These approaches have been recently improved [64] in terms of computational complexity and memory requirement, providing the fastest approximation of BF in literature. In [64], piecewise linear BF in which image intensities are discretized into a number of intensity levels is proposed, and linear filters are computed for these levels. These filtered levels are defined as principle bilateral filtered image component (PBFIC), and filtered values of the pixels are calculated by the linear interpolation of the two closest quantization levels to the pixel intensity. The actual formulation of BF, i.e., the relation in (2.1), is modified to find the filtered values JkB(x) of the specific quantization levels, Lk, as
J ( x) B k
F ( x, y) F L , I ( y)I ( y)
yN ( x )
s
R
k
F ( x, y) F L , I ( y)
yN ( x )
s
R
.
(2.4)
k
The actual intensity level of I(x) in (2.1) is replaced by a fixed value and afterwards, reformulating range kernel, Jk(y) and Wk(y) which depend on only I(y), are obtained as,
J kB ( x)
F ( x, y ) J
yN ( x )
s
k
( y)
F ( x, y)W I ( y)
yN ( x )
s
.
(2.5)
k
The averaging operators in Equation (2.5) enable box filter [70] utilization over the updated version of I(y) with constant complexity. Hence, fast calculation of PBFIC for predefined intensity levels (such as 8-16) can be achieved.
13
Once, filtered values are calculated for each level (8-16 levels), final output of an arbitrary pixel is calculated by linear interpolation of the fixed levels (Lk and Lk+1) closest to the current pixel intensity I(x) according to
I F ( x) Lk 1 I ( x) J kB1 ( x) I ( x) Lk J kB1 ( x)
.
(2.6)
In this approach, color adaptive filtering is achieved by utilizing box filtering for only the specific levels and then performing basic linear interpolation. Moreover, it enables down sampling of the original image for PBFIC calculation which further decreases computational complexity. It has been shown by the detailed experiments in [64] that eight levels provide sufficient accuracy. Thus, the overall computational complexity turns out to be eight box filters (each with three additions and two subtractions per pixel) for PBFIC calculation, two weight calculations and multiplications for kernel update, and two multiplications with three additions for the final linear interpolation per pixel.
2.1.4
Guided Filter
In [47], a general linear translation-variant filtering process, the guided filter, is proposed as an alternative to adaptive edge-aware filtering. Guided filter assumes a local linear model between the guidance image and the output as
I F ( x)
A
yN ( x )
k
I ( y) Bk
,
(2.7)
where Ak and Bk are the real valued linear coefficients constant within the support window, N(x), of the center pixel. Linear transformation preserves edge characteristics of the guided image I in the filtered image IF. Determination of the linear coefficients for each pixel is the most critical step for the Guided Filter. As proposed in [47], this is achieved by minimizing the difference between the filtered value and the filter input. The filter input can be the intensity (color) image I for traditional filtering, or any data D such as depth or stereo matching cost for joint guided filtering. The coefficients (Ak and Bk) for guided filter can easily be determined for each pixel as follows:
Ak
1 N
I ( y ) D( y )
yN ( x )
k2
Bk Dk k Ak
14
k
Dk .
(2.8)
In the explicit solution, µk and σk2 are the mean and variance of the intensity image, I, among the support window while Dk is the mean of the filter input along the same support window and N is the number of pixels in the window. In Equation (2.8), ε is a small real valued number utilized to prevent division by zero. The edge-preserving characteristic of the Guided Filter, which utilizes the linear coefficients calculated in (2.8), has been shown by detailed experiments [47]. On the other hand, the determination of the coefficients in (2.8) can be performed by use of box filters, since the averaging operator depends on single parameter y that provides efficient computation of adaptive filtering. The extension of the algorithm to RGB color guidance can be achieved by including a color covariance matrix instead of the variance parameter. Once the coefficients are determined, the filtered output is achieved by applying (2.7) to each pixel through box filters. The required number of operation per pixel in the Guided Filter is 107 additions, 43 multiplications and a single (3x3) matrix inversion.
2.1.5
Cosine Integral Images
Integral images [70], which are also known as summed area tables, enable very fast convolution (box filter) of an image by uniform kernels. However, color adaptive filtering requires non-uniform filtering which cannot be achieved by a single box filter. As mentioned previously, all of the fast edge-aware filter implementations exploit multiple box filters to provide non-uniform filtering. In [48], this idea is extended to cosine integral images, which form orthogonal basis by cosine functions for various frequencies. The filtering through cosine integral images is achieved as,
I kC ( x)
cosu ( y x)I ( y)
yN ( x )
cos(uk x)
k
cos(u y) I ( y) sin(u x) sin(u y) I ( y) k
yN ( x )
k
yN ( x )
, (2.9)
k
where IkC(x) is the filter output, cos(ukx) and sin(ukx) are the kernels corresponding to specific frequencies, uk. The filtering can be re-formulated based on the following trigonometric identity: cos(α-β) = cos(α)cos(β)+sin(α)sin(β). The summation terms in (2.9) can be efficiently calculated by use of box filters. Though, cosine and sine terms, which are the scaling coefficients based on frequency and pixel locations, can be calculated initially. Then, the filtered values for the kth frequency are obtained by only two box filters.
15
According to [48], the filtered values IC(x) are obtained by linear combination of these functions as
I C ( x) k I kC ( x)
,
(2.10)
k
through the Discrete Cosine Transform (DCT) coefficients, αk, which determine the weights of the basis frequencies. The spatial and range kernel arrangement is achieved by altering the variable in the cosine terms of formula given in (2.9). Replacing cos(ukx) terms in (2.9) by cos[ukFR(x)], where FR is a range kernel as in (2.2); color similarities can also be included. Hence, unifying spatial and range kernels on the target filter input which can be the intensity image, I, or any type of data, D, the edge-aware effect can be simulated by cosine filters. In general, usage of five to 12 fundamental frequencies is sufficient to approximate BF according to experimental results given in [48]. In this approach, the overall computational complexity per pixel depends on number of cosine terms, K, where four multiplications and 2K box filters (each three additions and two subtractions) are required for operations in (2.9) which are followed by K multiplications and additions for the linear combination to obtain the final output.
2.1.6
Adaptive Box Filter
Box filters are widely utilized to enable fast processing independent of pre-defined window size. So far, the approximations are conducted on fixed window size and unification of multiple box filters which are obtained through spatial and range kernels on the filter input and guidance image. One trivial approximation to provide edge-aware filtering is utilizing a single box filter (uniform filtering) with adaptive window size. This approach is proposed in [72] to filter cost data during stereo matching, where window size depends on the local color characteristics of individual pixels. Once each pixel is analyzed to determine proper horizontal and vertical window bounds, filtering is performed by single box filter that is much more efficient in terms of computational complexity compared to the algorithms mentioned previously. It is important to note that such an approach may not provide sufficient accuracy as those algorithms; however, it is one of the fastest methods worth to examine. Among many alternative ways to determine adaptive window size, color thresholding in horizontal and vertical axes as proposed in [8] is utilized throughout this
16
chapter. In this approach, the furthest pixels are determined that have RGB values closer to the center pixel than a pre-defined threshold (T) (with max distance limit of L) in four fundamental directions. These pixels determine the bounds of the window for the center pixel, and during the box filter uniform filtering is performed within this window. In adaptive box filter, weighted averaging which is the key idea of color adaptive BF is not performed, on the other hand uniform averaging is achieved among adaptive windows involving similarly colored pixels. The complexity of this approach is 4L additions and 1 box filter with three additions and two subtractions.
2.1.7
Geodesic Support Filter
The spatial kernel in a bilateral filter and its approximations provides weighting according to pixel locations; however, it does not consider connectedness among the support pixels, which is important for geometry related applications. As illustrated in Figure 2.2, irrelevant pixels, which do not belong to the same surface, can be assigned to higher coefficients due to color similarity. Such a weight distribution may cause errors for geometry dependent applications, such as segmentation, depth data up-sampling, stereo matching and motion estimation, in addition to over-smoothing of sharp edge transitions. This problem can be solved by including Geodesic Distance [71] which is a well known reliable distance transformation. Enforcing connectedness between the center and the supporting pixels, geometrically unrelated regions are prevented from having influence during the calculation of weighted averages. This idea is recently applied to many problems [73]-[75] with an obvious performance boost-up compared to other edge-aware filters.
Figure 2.2: Non-connected regions (shown by arrows) contribute in bilateral filter
17
The calculation of geodesic distances is achieved by determining color-wise smooth paths from each pixel to the center pixel in a pre-defined filtering window; however, this step results in excessively high computational complexity. There are two main approaches to determine geodesic distances; namely raster-scan [71] and wave-front [76] algorithms. Raster-scan approach is based on kernel operations applied sequentially within the window in multiple passes (iterations), whereas wave-front algorithm, such as Fast Marching Method [76], is based on iterative propagations from the center pixels. Due to limited number of iterations, the raster-scan approach is preferred for edge-aware smoothing among regular grid structures. In this method, the weight of the center pixel is assigned to “0”, while other pixels are assigned larger weights. Then, forward and backward scanning passes are performed consecutively within the window as illustrated in Figure 2.3.a and Figure 2.3.b. In the forward pass, the weights, W, of the pixels are updated according to
W ( x) min W ( y) FR I ( y), I ( x) , yK x
(2.11)
where y is a pixel within Kx neighborhood of pixel x according to the scanning direction as given in Figure 2.3, FR is the range kernel measuring color-wise similarity between two pixels. The weights are updated during the scanning; hence, the effect is transferred immediately to the following pixels. Backward scan is performed, after the forward pass is finalized by a similar update rule over the modified neighboring set. These passes are iterated several times (3-5) and the final weights corresponds to the geodesic distance of the pixels in the window to the center pixel. Then, weighted averaging is performed by the utilization of the inverse geodesic distance, in which geodesic-wise closer neighboring pixels are assigned higher weights.
Figure 2.3: Effective calculation of approximate geodesic distances [75] via two reverse scans.
18
Compared to BF, computational complexity in geodesic support is much higher, such that for an NxN window with three iterations, for each pixel 24N2 weight calculations (each three multiplications and six additions) are required for geodesic distance calculation which is followed by N2 additions and multiplications during weighted averaging. It is clear that constraining connectedness among supporting pixels results in a high computational cost.
2.1.8
Arbitrary Shaped Cross Filter
In [8], a cross filter is proposed enabling arbitrary support window by considering connected pixel groups having similar intensity characteristics. The aggregation is performed by two passes in vertical and horizontal direction over integral images providing constant weights within each support region. The most obvious advantage of this approach [8] is the constant time filtering independent of window size that enables prompt operation. In this approach, for each pixel four bounds are determined in left, right, up and down directions, corresponding to the furthest pixels having RGB values within a specific range of the center pixel. As illustrated in Figure 2.4, for the pixel with index p, the bounds are given as (h-p, h+p, v-p and v+p). In this approach, stemming from the box filter idea, first horizontal averaging is performed by forming summed area tables among horizontal axis and taking differences of the accumulated values corresponding to the determined bounds. In Figure 2.4, each pixel on the same vertical axis with pixel p is supported among horizontal axis specified by the red boundary. Then, performing the same procedure on the updated data among vertical axis, effective arbitrary shaped 2D uniform averaging is achieved for pixel p. The presented algorithm decomposes 2D box filter into two orthogonal 1-D box filters to provide arbitrary shaped averaging window that has the same computational complexity with the adaptive box filter algorithm mentioned previously. On the other hand, in adaptive box filter rectangular 2D windows (blue support region in Figure 2.4) are utilized depending on the same bounds, while in this approach arbitrary shaped windows are exploited.
19
Figure 2.4: Effective support regions of the center pixel, p, for adaptive box and arbitrary shaped filters.
The method introduced in [8] seems to be an efficient alternative to the computationally complex geodesic support filter; providing connected averaging regions depending on local color variation among the images. However, assignment of constant weights within the support region does not yield good approximation of Geodesic Filter, since neighboring pixels are not weighted depending on the color similarities.
2.2
Shortcomings of the Prior Art
It is obvious that the problems of stereo matching and depth data up-sampling, being the challenges in this dissertation, are geometry related. It has been established by many researches [8][11][75] that exploitation of connected support regions improves the accuracy for the applications based on object geometry. On the other hand, BF and its approximations yield color adaptive edge-aware filtering without any geometric constraints on the supporting pixels. This property limits the accuracy to an extent for geometry related applications. Moreover, it has been shown [47] that BF has gradient reversal artifact around sharp edge transitions, since along edge regions few pixel have similar color distribution resulting in limited statistical data which introduces unreliability. This drawback is handled by the Guided Filter approach [47] providing better accuracy in various applications. However,
20
Guided Filter also does not exploit geometric consistency and connectedness that leads to accuracy decrease for stereo matching and depth data up-sampling. Geodesic Support Filter [71], extends color adaptive filtering by enforcing connectivity between supporting pixels, while introducing much higher computational complexity compared to traditional BF. Finally, the technique in [8] introduces an efficient connected uniform averaging method where arbitrary support regions are utilized. Although quite efficient, it cannot provide color adaptive averaging among uniform weight distribution that decreases the overall performance. In addition to the lack of efficient weighted averaging algorithm among connected support regions, the aforementioned methods exploit pre-defined window sizes which require special attention to determine. This property decreases adaptability of the algorithms for handling regions with various local color distributions. A summary of the edge-aware filter characteristics is given in Table 2.1 to provide a complete intuition. Table 2.1: Summary of state-of-the-art edge-aware filter characteristics. Algorithm
Window Size Independence
Var. Cross Filter [8]
x x x x
Proposed Approach
Bilateral Filter [7] Guided Filter [47] Geodesic Support [71]
2.3
Connected Support Regions
Adaptive Weighted Averaging
Computational Efficiency
x x
x x x
x
Proposed Approach
In this chapter, a novel paradigm, namely information permeability, engaging computationally efficient two pass integration approach by weighted and connected support regions is introduced. Successive weighted summation (SWS) is applied in horizontal and vertical directions, enabling the advantages of separate filtering to achieve 2D support regions. Such an approach enables non-iterative diffusion among adaptive support area to provide not only reliable filtering, but also to yield constant operation time. Moreover, the proposed approach does not utilize any pre-defined window and adjust filter area for each pixel according to edge criteria automatically without any explicit processing. The proposed method introduces further computational complexity reduction with limited number of operations and low latency cache memory utilization at the same time, competing quality 21
with the state of the art techniques. Though, proposed approach is an efficient alternative to edge-aware filters in many application areas. All the state-of-the-art edge-aware filters have finite impulse responses (FIR) according to their pre-defined window sizes. The main motivation behind the proposed approach is to calculate the output as a result of infinite impulse response (IIR) type filter in a recursive manner. In this manner, proposed approach involves three main steps to; the first step is the calculation of permeability coefficients in principal directions recursively. These coefficients are analogous to the percentage of the data that is to be propagated through the corresponding direction. They are utilized to perform averaging in horizontal and then vertical directions. The order of horizontal and vertical aggregation can be interchanged optionally (in this study, horizontal scanning is followed by vertical scanning, although a similar performance is also observed for the reverse option). The proposed three step approach is an extension to the two pass cross based filtering approach introduced in [8], so that weighted averaging is achieved within an effective arbitrary shaped window. Depending on the number of neighbors and transfer directions, proposed approach is classified into 4-neighbor and 8-neighbor permeability. In 4-neighbor case, filtering is achieved by a transfer among left-right-up-down directions, as in steerable filters [69]. This approach ignores diagonal information transfer; hence, it is extended to 8-neighbor in the second scenario to include diagonal axes. Although, both approaches have the same three step structure, they have fundamental differences during the horizontal and vertical information transfer. Therefore, first the 4-neighbor approach is introduced, which is extended to 8- neighbor case in the following section.
2.3.1
4-Neighbor Permeability Filter
In this approach, data transfer is achieved in four main directions that resemble decomposition of a 2D filter into two 1D filters. The work flow of the proposed algorithm is given in Figure 2.5, where permeability weight calculation, horizontal and vertical transfer are the main steps to fuse information from color-wise similar pixels. The normalization step is required to map the filtered values within the range of the input data.
22
Input Image
Horizontal Transfer
Vertical Transfer
Left-to-Right Scan
Top-to-Bottom Scan
Right-to-Left Scan
Bottom-to-top Scan
Permeability Coefficient Calculation
Normalization
Filtered Image
Normalization Coefficient Calculation
Figure 2.5: Flowchart of the proposed edge-aware filter scheme
2.3.1.1 Permeability Weight Calculation “Permeability” is a common term in biomedical engineering, used to derive mathematical model of the behaviors of cell membranes by defining percentage of the molecules that can pass through. Using this weak analogy, the same idea can be used to model the transfer ratio of data through an RGB pixel in an image depending on the application, such as edge-aware color filtering. In edge-aware filters, weighted averaging is performed over color-wise similar pixels; thus, permeability can be utilized to support data among similarly colored regions. For that purpose, a permeability metric should be constructed to set a high transition (permeability) ratio across color-wise smooth regions and a low transition ratio for discontinuous color regions. Among many alternatives, in this study, the exponential function depending on color differences is utilized to model data permeability, x y , from pixel x to y as,
x y FR I ( x), I ( y)
y N 4 ( x)
FR I ( x), I ( y) min( e R / , e G / , e B / ) ,
(2.12)
where ∆R, ∆G and ∆B indicate the absolute difference between the R, G and B values of the two spatially neighboring pixels, σ corresponds to the smoothing factor, N4(x) is the 4neighborhood of pixel x. Permeability, μ, is assigned by taking minimum data transfer-rate among three channels, forcing smooth regions to have similar color values for each channel. In order to enable information transfer in a wider range of directions, permeability weights are calculated in four directions, as illustrated in Figure 2.6, for each pixel. The absolute color differences are calculated between the center pixel and the first neighboring pixel in the corresponding direction. At that point, edge operators or median filter can be applied to the input images, before the permeability calculation to reduce possible noise and improve reliability. As a result, each pixel characteristic is modeled by four different μ weights,
23
yielding values in the range of [0, 1]. The range extends from impermeable (for μ=0) to transparent characteristics, as the value approaches to “1”.
Figure 2.6: 4-directional permeability weights
2.3.1.2 Horizontal Transfer
The main idea for horizontal transfer is to relate color-wise similar pixels to each other by consecutive propagation of the filtered data, D. It is important to note that, transfer is conducted on the data which is desired to be filtered; for color filtering, it is the color view itself, whereas, for joint filtering, it is another type of data, such as depth, stereo or motion cost. Therefore, successive weighted summation (SWS) is exploited to fuse information from the preceding pixels for the corresponding direction; SWS is a progress and update rule to accumulate values along horizontal direction. Horizontal processing is applied for each row independently; hence, inter-scan line relations are not considered at that step. This approach is similar to one-tap IIR filter with an adaptive update coefficient for each pixel. In order to fuse all available information along the horizontal axis, SWS is applied in two directions, raster scan (left-to-right) and inverse raster scan (right-to-left) as illustrated in Figure 2.7. Then, the corresponding filtered values of each scan are added together to obtain final averages in horizontal direction.
Figure 2.7: SWS is performed for two scan orders and the final horizontal support is obtained by summation for each pixel.
24
In SWS, the value of a pixel is revised by addition of the updated value of the previous pixels that is scaled by related permeability coefficient according to
D LtoR ( x) D( x) R ( x 1) D LtoR ( x 1)
,
(2.13)
where D(x) is the real valued filter input for the pixel with horizontal index x (for simplicity row index is dropped), DLtoR(x) is the updated value in raster scan, µR(x-1) is the permeability coefficient of the previous pixel indicating the transfer ratio. The data from the previous pixel is transferred to the next pixel by permeability weighted cost values. Due to this successive approach, the effect of distant pixels can be transferred by successive multiplications of the μR values. This characteristic can be observed by analyzing the update rule given in (2.13) and turning it into a closed form as:
D LtoR ( x) D( x) R ( x 1) D LtoR ( x 1)
D( x) R ( x 1) D( x 1) R ( x 2) D LtoR ( x 2)
(2.14) x 1
i
D( x) {D( x i ) R ( x j )} i 1 j 1 WeffRtoL ( x i ) x 1
D( x) D( x i ) WeffLtoR ( x i ) i 1
where the updated values are written in an explicit form at each step until the leftmost pixel is reached in this direction. The effective weight, Weff, between pixels x and y (x>y) can be obtained by successively multiplying all the right permeability weights between indices y and x. The support of the cost values may extend to large distances as long as high permeability weights are observed consecutively. Once an impermeable pixel (i.e. μ0 or sharp intensity/color discontinuity) is observed on the left of a pixel, then the data behind the impermeable region cannot be propagated to the right. Actually, this property provides support regions to be connected, i.e. a pixel is supported by previous pixels on the left as long as there is smooth color transition along the path. For the inverse raster scan, SWS starts from the last pixel on the right and the update rule with its closed form as,
25
D RtoL ( x) D( x) L ( x 1) D RtoL ( x 1) L x
i
D( x) {D( x i) L ( x j )} i 1 j 1
,
(2.15)
WeffRtoL ( x i )
where L defines the width of the row, DLtoR(x) corresponds to the left accumulated value of the pixel with column index x. In this scan order, left permeability coefficients are utilized to weight aggregated values during the transfer. The update principle of SWS is summarized in Figure 2.8, to clarify the operations along a row, where input data, D, is filtered according to the permeability coefficients of the RGB image.
...
D ( x 1)
...
D LtoR ( x 1) D
D
LtoR
D ( x )
D ( x 1)
...
D RtoL ( x 1) D RtoL
(x)
D (x 2)
...
Initial Data
D LtoR ( x 1)
D LtoR ( x 2 )
...
Left Aggregated Data
D (x 2)
...
Initial Data
D RtoL ( x 2 )
...
Right Aggregated Data
(x) D (x)
...
D
LtoR
D ( x 1)
D ( x ) RtoL
(x)
R
( x 1 ). D
LtoR
D ( x 1)
D RtoL ( x 1)
( x ) D ( x ) L ( x 1 ). D
( x 1)
RtoL
( x 1)
Figure 2.8: Update rule in left and right scan orders during SWS.
SWS in both scan orders are performed on the original data; thus. They provide independent data from the reverse direction, as in Figure 2.7. In order to obtain final horizontal weighted average of each pixel, the accumulation values are unified by summation as,
D Hor ( x) D LtoR ( x) D RtoL ( x)
26
.
(2.16)
The edge-preserving property of SWS can be illustrated by an example given in Figure 2.9, for which intensity values and corresponding permeability weights are presented. For simplicity, permeability weights are calculated according to intensity levels rather than RGB through an exponential function defined in (2.11). According to the sketch of intensity values, two discontinuities which can also be figured out in the distribution of the permeability coefficients exist. In Figure 2.9, results of the left-to-right and right-to-left SWS results, which are obtained according to the rules in Figure 2.8 are given. It is clear from the SWS plots that accumulation of data stops at edge pixels having low permeability weights that prevent data transfer from regions with different intensity variation. This behavior is exactly the property of edge-preserving filters. Though, the final horizontal accumulation which is obtained by addition of values from two scanning directions preserves the edge characteristics as well. When the accumulated values are normalized by the accumulation of weights obtained through SWS over dummy data consisting of one’s (normalization details are given in the following section), the final filtered values are obtained as illustrated in Figure 2.9. The result indicates that data (intensity values in this example) is filtered according to the intensity distribution among the row that is the desired edge-aware characteristic. According to the update rule in SWS, constant computational complexity is observed, such that for each pixel, horizontal aggregated values are calculated by two multiplications and two additions during left and right scan orders and one final addition; resulting in two multiplications and three additions per pixel. Hence, all pixels are filtered by two scans yielding an efficient calculation. Although limited number of operations is performed for each pixel, their resultant affect is weighted averaging along the entire row, as given by the closed form representation in (2.14) and (2.15). At that point, effective weight distribution of a pixel is determined by consecutive permeability coefficients. Analyzing the effective weights, it is obvious that they tend to decrease as the supporting pixels get further from the corresponding point. In addition, color (intensity) changes decreases the effective weights providing connected and weighted support for each pixel. Following the example given in Figure 2.9, the effective weight distribution for three different pixels at indexes of 4, 12 and 22 (with red, blue and green dots) are given in Figure 2.10 that are determined by two SWS in reverse order. These distributions correspond to the actual weights of the neighboring pixels to obtain the same filtered values for these pixels via weighted averaging.
27
Figure 2.9: The edge-preserving characteristics of SWS on 1D signal is clearly observed after normalization.
28
Figure 2.10: 1D effective weight distributions for three points for the intensity profile in Figure 2.9.
In Figure 2.10, it is obvious that each pixel is supported by neighboring pixels with similar intensity characteristics which enable edge-aware filtering. Moreover, connectedness is also enforced in such a way that once an impermeable region is encountered, there is no way to transfer data through, and since permeability weights reset the previous accumulation values.
2.3.1.3 Vertical Transfer
During horizontal processing, data transfer is performed for each row independently, while vertical relation is not considered. However, in order to obtain 2D effective filter, 1D horizontal transfer should be extended by use of vertical SWS, as in separable filters. Hence, SWS is performed on the horizontally accumulated data, as obtained in the previous section, along the vertical axis. In this case, scanning directions are upwards and downwards during the calculation of partial weighted accumulation values, which are then unified to obtain the final vertical accumulation. The update rule during vertical SWS is similar to its horizontal counterpart, having edge-awareness characteristics, by the use of vertical permeability coefficients in this case. For clarity, the equations for vertical SWS are given as,
DTtoB ( y ) D Hor ( y ) D ( y 1) DTtoB ( y 1) D BtoT ( y ) D Hor ( y ) U ( y 1) D BtoT ( y 1) DF ( y ) D
TtoB
( y) D
29
BtoT
( y)
,
(2.17)
where the final filter output DF(y) is obtained by the summation of top-to-bottom, DTtoB, and bottom-to-top, DBtoT, SWS values. It is important to note that horizontally filtered values are utilized during these operations.
2.3.1.4 Effective Filter
After the vertical pass, 2D support regions are provided since the vertical SWSs are performed on horizontally supported data. In Figure 2.11, final effective support regions of two pixels on the same column are illustrated. In Figure 2.11.a, the effective horizontal weight distribution of each pixel on the same column, where lighter regions correspond to higher weights is given. It is clear that, color-wise smooth regions provide strong supports within, and the information transfer is prevented along edge regions. In Figure 2.11.b, vertical effective weights of the corresponding pixels that are the result of two pass vertical transfer are illustrated. The final 2D effective support weights in Figure 2.11.c are constructed by further weighting horizontal support region with vertical weights. The presented SWS can be simulated by direct calculation of weighted summation through these weights which correspond to contribution of neighboring pixels. However, compared to computationally complex direct implementation, proposed approach requires only six additions and four multiplications per pixel. 2.3.1.5 Normalization
Horizontal and vertical SWS operations provide edge-aware weighted accumulation of data. In order to obtain the filtered values in range ([0,255] for 8-bit color filtering) with the filter input, a normalization step is required as given in (2.1). Though, the accumulated values should be normalized by the sum of effective weights for each pixel. These values can easily be calculated by applying proposed filtering steps to a dummy data consisting of ones. In this way, accumulated values correspond to permeability coefficients due to multiplicative ineffectiveness of 1s. Thus, the normalization can be calculated as;
DF
FPer ( D) FPer (1)
30
.
(2.17)
Figure 2.11: (a) Horizontal effective weights of the pixels on the same column, (b) vertical effective weights for two pixels, (c) 2D effective weights after horizontal and vertical SWS ( denotes the convolution operation).
where FPer is the proposed edge-aware filter, D is the filter input and 1 is the data consisting of only ones. This step is required for in range filtering such as color filter, de-noising, depth up-scaling, flash-no flash joint filter etc. On the other hand, normalization is useless for filtering of cost volume during stereo matching or motion vector estimation that only increases computational complexity. A typical example of color filtering to observe the effect of normalization is illustrated in Figure 2.12, where the intermediate steps of the proposed filtering are also given. In Figure 2.12.b, the resultant aggregation after horizontal and vertical SWS is illustrated; it is clear that accumulation values of the smooth regions are higher due to high transition of RGB. Moreover, object boundaries are also preserved in the aggregation data, as a desired property for edge-awareness. After normalization of the aggregated data according to the weight distribution given in Figure 2.12.c, the filter output with crisp object boundaries is obtained in Figure 2.12.d. The proposed 4-neighbor SWS, enables processing of each row and column independently with cache friendly data acquisition, due to consecutive processing. Besides, this filter does not require any iteration or pre-defined window to fuse data from the neighboring pixels. Instead, depending on local characteristics effective regions are determined automatically by the permeability coefficients. It is important to note that the
31
order of row and column scans can be interchanged; however, throughout this dissertation; row-column order is followed.
Figure 2.12: (a) input color view, (b) permeability filter output without normalization, (c) normalization coefficients, (d) final filter output after normalization.
2.3.2
8-Neighbor Permeability Filter
The separable 4-neighbor filtering cannot cover diagonal directions due to orthogonal scanning. A trivial way to accomplish this drawback could be to perform SWS along diagonal axes in addition to vertical and horizontal directions and enhance filtering capability. However, this approach can only cover additional directions with 45º rotation according to main two axes that is not sufficient to transfer information from all pixels. Instead, 8-direction approach is proposed through similar steps as in the previous section with fundamental updates.
32
2.3.2.1 Permeability Weight Calculation
In this case, permeability weights are determined for eight principal directions corresponding to all neighbors of the pixels as illustrated in Figure 2.13. The weights are calculated according to equation (2.12), for the eight neighbors.
Figure 2.13: 8-neighbor permeability weights
2.3.2.2 Horizontal Transfer
In this case, a similar progress and update rule (SWS), introduced previously, is exploited to fuse data from the preceding pixels for the corresponding direction. As illustrated in Figure 2.14, horizontal transfer is performed in two steps with left-to-right and right-to-left scanning. During the horizontal scanning operations; for each pixel, information propagation is achieved by three neighboring preceding pixels such that the updated data of these pixels are added to the current pixel with permeability coefficients given as,
D LtoR ( x, y ) D( x, y ) 1 {D LtoR ( x 1, y 1) DR ( x 1, y 1) 3 D LtoR ( x 1, y ) R ( x 1, y )
(2.19)
D LtoR ( x 1, y 1) UR ( x 1, y 1)} D RtoL ( x, y ) D( x, y ) 1 {D RtoL ( x 1, y 1) DL ( x 1, y 1) 3 , RtoL L D ( x 1, y ) ( x 1, y ) D RtoL ( x 1, y 1) UL ( x 1, y 1)} 33
(2.20)
where, DLtoR and DRtoL correspond to updated filtered data for left-to-right and right-to-left scanning directions, respectively. At that point, the filtered data, D, can be a depth map, a color image or another type of data depending on the purpose of filtering. The data transfer from the preceding pixels is achieved after the process of the previous pixels is finalized. Thus, processing order of pixels have to be column-wise such that once the operations over the pixels at a column are finished, the process of pixels at the next column starts from the top pixel to the bottom, as illustrated in Figure 2.14. Data from the updated pixels (filled circles) is transferred to the un-processed pixels (empty circles). Horizontal scan is finalized by the summation of DLtoR and DRtoL to fuse filtered values in reverse directions.
Figure 2.14: Data transfer pipe-line for horizontal transfer (a) left-to-right, (b) right-toleft.
During SWS, it is clear that effect of a pixel on the target pixel is observed through multiple paths with combination of related permeability weights and corresponding three principle directions. This is the extension of horizontal SWS in 4-neighbor version. Moreover, as the distance between pixels is increased, number of possible contributing paths increases as illustrated in Figure 2.15. In this figure, number of possible paths is given for each effective pixel in left-to-right transfer to the circled pixel. An example is given in Figure 2.15.b, illustrating two paths from a pixel, y, to another, x, among 45 alternatives according to Figure 2.15.a (five pixels along x-axis and one pixel along y-axis away from the circled pixel), where data transfer is considered in left-to-right scan.
34
Figure 2.15: (a) Number of possible contributing paths increases as the distance of the target pixel increases. (b) Two possible path configurations among 45 alternative paths between x and y. Each path yields to a transfer ration as a result of different combinations of permeabilities. For the two paths given in Figure 2.15, the effective weights are calculated as
1 3 1 2 eff ( ) 5 R ( y ) DR (5) UR (6) R (7) UR (8) 3 1 45 i eff ( y x) eff ( x y ) ( ) 5 eff 3 i 0 1 eff ( ) 5 UR ( y ) R (1) UR ( 2) DR (3) R ( 4)
(2.21)
where given the index numbers of the pixels through which paths continue, the arrows correspond to the related transfer direction of the pixel among the specified path. Depending on the transfer direction, through each pixel data is transferred by the corresponding permeability. For the first path for example, starting from pixel y, pixels with indexes of 1, 2, 3 and 4 are visited that has influence on the weight by the related permeability coefficients as given in (2.21). The scaling by the factor, 1/3, is due to the averaging in (2.19) performed to prevent over summation. The total effect, µeff, of the pixel y in Figure 2.15.b on the target pixel, x is the determined by summation of all effective weights related with all possible paths between two pixels (2.21). The effective weight of y over x is symmetric such that the same path is traversed from x to y during the data transfer in right-to-left scan order. It is important to note that, since the transfer is performed through multiple paths, data penetration continues by
35
consecutive high permeability weights, and is prevented by the impermeable pixels on the path as in 4-neighbor horizontal SWS. Hence, the edge-aware characteristic is preserved in this case with improved directional information. This property still guarantees the connectedness of the effective smoothing region which is bounded by intensity edges. The computational complexity of the extended version turns out to be eight multiplication and seven addition operations per pixel.
2.3.2.3 Vertical Transfer
The horizontal transfer symmetrically diffuses information from the left and right directions as illustrated in Figure 2.16; and should be extended to cover all directions including top-bottom axis. For this purpose, vertical transfer is performed over horizontally filtered data with similar update and progress rule. This second pass provides a wider information transfer area enabling larger smoothing regions depending on color distribution.
Top to Bottom
Right to Left
Left to Right
Bottom to Top
Figure 2.16: The space covered by horizontal and vertical transfers.
Vertical filtering is achieved in two steps as illustrated in Figure 2.17, top-to-bottom and bottom-to-top directions. In this case, propagation in vertical direction is achieved according to
36
D TtoB ( x, y ) D Hor ( x, y ) 1 {D TtoB ( x 1, y 1) DR ( x 1, y 1) 3 D TtoB ( x, y 1) D ( x, y 1)
(2.22)
D TtoB ( x 1, y 1) DL ( x 1, y 1)}
D BtoT ( x, y ) D Hor ( x, y ) 1 {D BtoT ( x 1, y 1) UR ( x 1, y 1) 3 D BtoT ( x, y 1) U ( x, y 1)
,
(2.23)
D BtoT ( x 1, y 1) UL ( x 1, y 1)} where DTtoB and DBtoT correspond to updated filtered data for the top-to-bottom and bottomto-top scan orders. In vertical filtering, the process order in horizontal filtering is transposed, in such a way that the processing of the next row starts, when all of the pixels in the corresponding row are finalized. Although the processing order of pixels is raster scan, the data is carried out along the vertical direction by the vertical permeability weights. Performing top-to-down and down-to-top propagation, the final filtered values are obtained by summation of DTtoB and DBtoT, as
DF ( x) DTtoB ( x) D BtoT ( x)
.
(2.24)
Figure 2.17: Data transfer pipe-line for vertical transfer (a) top-to-bottom, (b) bottomto-top.
37
2.3.2.4 Effective Filter The DF in (2.24) involves the weighted summation of intensity values of all of the pixels in the image, where the effective weights are determined by the consecutive multiplications among possible paths. In 8-direction case, all directions are considered without any approximation of separate filtering. However, the increase in number of possible contributing paths, as illustrated in Figure 2.15, is lower compared to the damping factor of the power of 1/3. Therefore, the effect of distant pixels is reduced that may not be desired for various applications. On the other hand, 8-neighbor extension can calculate support from different directions by use of 16 multiplications and 14 additions per pixel that is three times more complex than its 4-neighbor version. As mentioned in Section 2.3.1, normalization is also required for this approach that is achieved in a similar way by performing the filtering operation on data consisting of 1’s. Then, normalization is achieved according to the equation in (2.17).
2.4
Complexity Analysis
In this section, proposed two approaches (4- vs. 8-neighbor filters) are compared against the aforementioned state-of-the-art edge-aware filters in terms of computational complexity and memory requirement. For this purpose, a joint data-filter scenario is selected, in which single channel data (depth map, cost function) is filtered according to RGB color image within an NxN support window. This scenario is coherent with the algorithm flow for stereo matching and depth up-scaling, which are the main tools in this dissertation. The extension of this scenario to color image filtering can be achieved by processing each channel independently, and that increases computation almost three times for all analyzed filters. Computational complexity is measured by the number of operations including addition and multiplication; for the sake of simplicity subtraction and division (inverse multiplication) are considered to have the same complexity as that of addition and multiplication. Range kernel calculation is a common step in all methods and intensity difference look-up tables can be utilized to decrease the number of multiplications. The total number of computations is given in Table 2.2; it is clear that Geodesic Filter [71] unifying color adaptability and connectedness has the largest complexity that is followed by Bilateral Filter [45]. Constant Time Bilateral Filter [64] requires less number of operations compared to Guided Filter [47]
38
and Cosine Integral [48] approach. Adaptive Box Filter [72] and Arbitrary Shaped Cross Filter [8] do not have any multiplicative steps, since they utilize standard averaging among specified support regions; however, as the window size increases, they require more operations than the proposed 4-neighbor algorithm. The 8-neighbor permeability filter has much less complexity compared to the bilateral filter and its approximations. On the average, 4-neighbor permeability filter has the minimum number of operations, yielding weighted averages over connected regions. This method enables approximation of Geodesic Distance with much less computation. Memory requirement is an important factor that has an influence on the complexity of the algorithms. Hence, algorithms are also analyzed based on the required additional memory in terms of the image size, WxH, as given in Table 2.3. In Adaptive Box and Arbitrary Shaped Cross Filter memory requirement is larger compared to Bilateral Filter, since for each pixel window bounds should be stored. The same requirement is valid for permeability filters, so that for 4-neighbor case, additional 2 image area (4 image area for 8neighbor) is utilized to store permeability coefficients, due to symmetry. It is clear from Table 2.3, that apart from Guided Filter, the memory requirement is around acceptable levels for all edge-aware filters. Table 2.2: Total number of operations per pixel in terms of addition and multiplication. Complexity (NxN)
Bilateral
2-pass Bilateral
O(1) Bilateral
Guided
Cos. Int.
# of Addition
4N2
8N
66
107
88
# of M ultiplication
N2
2N
6
43
12
Adapt. Box
Geodesic
AR Cross
Proposed-4
Proposed-8
# of Addition
2N+5
145N2
2N+4
12
26
# of M ultiplication
-
73N2
-
4
16
Table 2.3: Additional memory requirement of edge-aware filters in terms of input image size (WxH), (i.e. guided filter requires additional memory of 14 input image size) Memory Requirement
Bilateral
2-pass Bilateral
O(1) Bilateral
Guided
Cos. Int.
(WxH)
1
1
2
14
4
Adapt. Box
Geodesic
AR Cross
Proposed-4
Proposed-8
5
1
5
3
5
(WxH)
39
2.5
Experimental Results
Proposed approach is compared with edge-aware filters in terms of filter characteristics, computational speed and accuracy to validate the complexity analysis. It is important to note that, all of the filters are implemented on the same platform, for which original implementations of Cosine Integral Images [48], Constant Time BF [64] and Guided Filter [47] are provided by their authors. In order to observe filter characteristics, weight distributions are also given for three different pixels as illustrated in Figure 2.18, Figure 2.19 and Figure 2.20. The support regions are determined for the blue squared pixels at the center of the selected windows. In Figure 2.18, a region with similar color distribution is chosen in which certain regions belong to different surfaces. As observed in the first row of the weight maps, bilateral filter and its approximations provide high correlation weights for the disconnected pixels having the same color variation with the center. The main reason of this result is the fact that geometry constraint is not enforced in these methods. On the other hand, Geodesic Filter, Cross Filter and proposed approaches provide connected support regions for the center pixel, where Cross Filter exploits constant weight and the others yield color adaptive weight distribution. Proposed approaches, especially 8-neighbor version, model and approximate geodesic distance unifying connected and weighted support regions. In Figure 2.19, apart from Guided Filter, all the methods provide crisp filtering area for the blue squared pixel. The support provided by the 8-neighbor permeability filter is limited compared to the remaining filters that is actually due to the scaling factor of (1/3) during propagation. In Figure 2.20, it can be easily observed that the proposed approach yields crisper support regions than Geodesic Filter in certain cases. Due to vertical edge directions, the filter area is limited for Cross Filter and permeability filter. Besides, on the first row, high weights of unrelated pixels are obvious for BF and its approximations which do not constrain geometric connectedness. According to these results, it can be concluded that permeability filter approximates Geodesic Filter effect with significantly lower computational complexity yielding geometrically consistent and weighted support.
40
Figure 2.18: The weight distribution for the center pixel a) Bilateral Filter, (b) Twopass bilateral Filter, (c) Constant time Bilateral Filter, (d) Guided Filter, (e) Cosine Integral, (f) Adaptive Box Filter, (g) Geodesic Filter, (h) Arbitrary Region Cross Filter, (i) Proposed 4-neighbor, (j) Proposed 8-neighbor.
Figure 2.19: The weight distribution for the center pixel a) Bilateral Filter, (b) Twopass bilateral Filter, (c) Constant time Bilateral Filter, (d) Guided Filter, (e) Cosine Integral, (f) Adaptive Box Filter, (g) Geodesic Filter, (h) Arbitrary Region Cross Filter, (i) Proposed 4-neighbor, (j) Proposed 8-neighbor.
41
Figure 2.20: The weight distribution for the center pixel a) Bilateral Filter, (b) Twopass bilateral Filter, (c) Constant time Bilateral Filter, (d) Guided Filter, (e) Cosine Integral, (f) Adaptive Box Filter, (g) Geodesic Filter, (h) Arbitrary Region Cross Filter, (i) Proposed 4-neighbor, (j) Proposed 8-neighbor.
Visual comparison of the effective weight distribution of 4 and 8-neighbor approaches are given in Figure 2.21, in which support regions for four different pixels (blue circled) are illustrated. In the right column, supporting pixels with high weight factors (>0.1) are illustrated to discriminate color variations among the support regions. It is important to note that for these methods, the support window area is determined automatically by the distribution of permeability coefficients; i.e., window size is not fixed initially. Using the same parameters for permeability coefficient determination, it is clear that 4-neighbor version enables much wider filter support. Moreover, support area is determined automatically based on the local color variations. This is an important property that prevents possible over-smoothing and preserves edge characteristics of the guidance image. As mentioned previously, 8-neighbor approach enables better directional handling; however, it suffers from limited support area due to scaling factor (1/3) during SWS as given in (2.18) and (2.19). This property can be critical for filtering of cost functions during stereo matching and motion vector estimation that requires larger support area. On the other hand, the effect of smoothing factor, σ, which determines the distribution of permeability coefficients, is illustrated in Figure 2.22. As this parameter increases, data
42
transfer rates increase, which increase smoothing area as well. The pixels having weights larger than 0.1 are given in Figure 2.22 to illustrate edge-preserving property based on smoothing factor. It can be observed that effective weight distribution expands to distant pixels and support regions lose crispness as well as same color distribution. Throughout this study, the range of color similarity scaling factor (σ) is set to [8-16] enabling sufficient edgeawareness as observed in Figure 2.22.
Figure 2.21: Effective weights and filter are provided by 4-neighbor (above) and 8neighbor permeability filter (below).
Figure 2.22: As smoothing parameter increases, effective support region area gets larger for each pixel that decreases edge-awareness.
43
After analyzing filter characteristics, they are compared in terms of execution times through experiments performed on a 3.06GHz Intel Core i7 CPU with 6 GB RAM. As given in Table 2.4, joint data filtering (depth up-scaling) is applied for an image resolution of (720x576) for 30x30 supporting windows. According to the results, it can be easily argued that the proposed method with its two versions has the fastest execution time which is compatible with the computational complexity analysis given in Table 2.2. One main reason of this result in addition to low number of operation is its cache friendly data access pattern, where consecutive processing is exploited during horizontal and vertical successive weighted summation in permeability filter. For the remaining techniques, box filter, which is utilized intensively, requires multiple jumps on the accumulated data in horizontal and vertical directions, increasing latency, as well as execution time to a certain extent. As expected, providing connected support regions with weighted averaging via Geodesic distance is time consuming, even compared to traditional BF. Constant Time BF has significant improvement in computational complexity with sufficient modeling accuracy as observed in weight distribution maps and detailed analysis in [64]. Further computational comparison is conducted on stereo matching chapter, which also yields correlated results with Table 2.4. Table 2.4: Computation times of edge-aware filters for joint filtering of an image with a size of 720x576 Computation Time (msec)
Bilateral
2-pass Bilateral
O(1) Bilateral
Guided
Cos. Int.
720x576
1.9 104
1480
200
470
2146
Adapt. Box
Geodesic
426
3.6 105
720x576
Var. Cross Proposed-4 Proposed-8
426
85
193
According to the geometry related applications of edge-aware filters throughout this dissertation, the experiments on accuracy comparison are conducted in two cases. In the first scenario, joint up-scaling performance is measured by using ground truth disparity (depth) maps given in Middlebury Stereo Online Benchmark [111]. The actual disparity maps are down-sampled by three factors (2, 4 and 8) then up-sampled via well-known linear Bicubic filter. This is followed by edge-aware filtering with respect to high resolution color images. Then, refined depth maps are compared to the ground truth versions by the common metric exploited to evaluate performance of stereo algorithms in the benchmark; the ratio of the pixels having depth level difference larger than 1 level. The experiments are conducted on 30 different scenes to cover various scenes and for each method parameter settings with the best performance are exploited. The average error rates are given in Figure 2.23, while the best
44
performance is obtained by Geodesic Filter. The proposed approaches have the second best performance for up-sampling level of 2. As the ratio increases, superior performance of Geodesic Filter is visible. It is interesting to note that Guided Filter and Cosine Integral approaches have worse performance compared to Bicubic interpolation. The main reason of this result is the fact that among small support windows, the model proposed by these techniques cannot approximate BF. In all cases, the proposed method outperforms Arbitrary Cross Filter and Constant Time BF, which are the fastest algorithms after permeability filter. Typical up-scaling results (scale by 4) are given for the Dolls image sequence in Figure 2.24. The joint comparison of the edge-aware filters is summarized in Figure 2.25, where x-axis corresponds to the log of the execution time in Table 2.4, and y-axis is the average error rate for three scales. According to this comparison, it can be stated that the proposed approach enables much faster processing among all techniques with the second best average performance. Therefore, it is an alternative to the state-of-the-art edge-aware filtering techniques, while unifying fast operation and high accuracy. Further comparative analyses on accuracy and execution time are conducted on the stereo estimation chapter.
Figure 2.23: Percentage of erroneous pixels whose disparity error is larger than one level compared to ground truth for three different scaling ratios
45
Figure 2.24: First row: color image, ground truth and down-sampled (by 4) disparity maps; Second row: filter results of Bilateral Filter, Two-pass bilateral Filter, Constant time Bilateral Filter, Guided Filter and Cosine Integral; Third row: filter results of Adaptive Box Filter, Geodesic Filter, Arbitrary Region Cross Filter, Proposed 4-neighbor, Proposed 8-neighbor.
Figure 2.25: Joint evaluation of accuracy and computational complexity (in logarithmic scale) for edge-aware filters
2.6
Conclusion
In this chapter, state-of-the-art edge-aware filtering techniques are examined and an efficient content-based data filtering method (permeability filter) is introduced, exploiting horizontal and vertical propagation based on local color characteristics. The proposed 46
approach improves traditional edge-preserving approaches in terms of connectivity and computational complexity. Moreover, permeability filter simulates Geodesic Support with considerable computation reduction, providing connected and weighted averages over adaptively determined support area. The separable information propagation via SWS enables constant complexity for edge-aware filtering with no specification of window sizes. Hence, totally content adaptive filtering is provided depending on color variation. In addition, successive information transfer enforces effective support regions for filtering to be connected, which prevents contribution of irrelevant pixels that do not belong to same surface. This is important for geometry related applications, such as depth up-scaling, stereo matching and motion vector estimation, providing pixels on the same surface to involve similar geometry (depth, motion) characteristics. According to experiments, the permeability filter provides high quality results for disparity map up-sampling, competitive with the state-of-the-art. Moreover, the fastest execution time is achieved by the proposed algorithm, utilizing cache-friendly data acquisition for CPU, as well as high parallelization with row and column independency, which makes GPU implementation feasible. Depending on the computational complexity analysis, memory requirement and accuracy, proposed filtering method is a strong alternative to the leading state-of-the-art edge-aware filters in many application areas with less computational complexity and high quality results. In the following chapter, further comparison is presented between permeability filter and state-of-the-art techniques for stereo matching that validates superior performance of the proposed method on geometry dependent applications.
47
CHAPTER 3
3
STEREO MATCHING
Generation of stereo images is achieved by utilizing two horizontally aligned cameras separated by a specified baseline. Separation of left and right cameras provides a parallax leading horizontal shifts between two images. This capture method resembles human vision system in which functionality of the eyes is replaced with horizontally aligned cameras as illustrated in Figure 3.1. The perception of binocular depth cues is the result of parallax between left and right views that is the most endeavored way to provide 3D perception in 2D displays and projectors. The horizontal shifts between images are related to perceived depth of the points with three types as illustrated in Figure 3.2. The points are observed behind the screen when there is positive disparity between conjugate pairs in left and right images. When there is no disparity (zero disparity), points are perceived on the screen as in 2D content. On the other hand, objects come closer to the viewer in front of the screen as the disparity between left and right pairs increase in negative direction. The relation between disparity and depth can be formulated by
Depth
Zs B Bd
,
(3.1)
where Zs corresponds to the distance between the screen and the observer, B is the baseline distance between two cameras (eyes) and d is the pixel disparity between conjugate pairs. Zs can also be considered as the distance between the focus point of stereo cameras and the center of the baseline. In this manner, the formulation in (3.1) is valid for both stereo capture and imaging devices to measure the recorded or perceived depth of a scene. It is also important to note that in stereo production or 3D display systems, there is an upper limit for the maximum value of the disparity that is the baseline distance between two cameras. This is a natural result of human visual system (HVS) where eyes can maximally converge at infinity and cannot diverge.
48
Figure 3.1: Observation of a scene through two eyes enables binocular cues for 3D perception.
Figure 3.2: Three cases for the relation of disparity and perceived depth for stereo camera systems.
Depending on the relation formulated in (3.1), depth estimation problem can be reduced to finding matching points for each pixel across stereo images, corresponding to specific disparities. At that point, horizontal alignment of cameras simplifies matching such that conjugate pairs are located on the same vertical coordinates as illustrated in Figure 3.3. In the figure, conjugate pairs (the same colored points in left and right images) lie on the horizontal
49
epipolar line with a specific parallax based on the depth structure. In certain cases, stereo cameras may not have horizontal alignment due to imperfect calibration; this requires rectification which is a pre-processing step that warps one of the stereo views with respect to the other in order to align corresponding scan-lines. Hence, stereo matching can be defined as the problem of finding parallax of each pixel in left and right images as illustrated in Figure 3.3, which provides depth distribution or perceived depth of a scene captured by a stereo camera system.
Figure 3.3: Conjugate pixel pairs between stereo views lie on the same vertical coordinates (Art stereo sequence [111]).
Stereo matching has attracted many researchers due to its wide application area in computer vision, such as 3D object modeling, robot navigation, face recognition, object tracking, automatic aviation systems, medical and military applications and consumer electronics. The emergence of 3D TVs is also expected to push the research efforts on stereo processing further by a demand on real-time systems for extraction of 3D information embedded within stereo views. In the next section, a literature survey is given on stereo matching that is followed by the motivation behind the development of a stereo matching algorithm in the scope of this dissertation. The proposed stereo matching algorithm is
50
presented in Section 3.4 and the experimental results are given in Section 3.5. Finally, this chapter concludes in Section 3.6.
3.1
Related Work
During the recent years, many algorithms have been developed for stereo matching and an excellent taxonomy for these algorithms is available in [4] where a classification is provided according to the matching cost, disparity optimization and disparity refinement stages. Actually, diversity of the algorithms mostly relies on the second stage where optimization approach determines the main characteristics (complexity, precision) of the methods. Hence, estimation algorithms can be analyzed with four fundamental optimization approaches, namely local, global, cooperative and semi-global. In local methods [5]-[11], disparity map assignment is achieved via “winner-take-all” optimization after treating each disparity candidate independently. The matching cost function is aggregated through a summation or an averaging over a support region and the disparity providing minimum cost is assigned to the corresponding pixel. As stated in the previous chapter, support region determines accuracy of this type of algorithms and the most common approach is to exploit window-based regions in order to simplify the aggregation. The local methods do not involve any iteration steps which provide simplicity and fast operations as well as low memory requirement. Thus, these methods are available for realtime implementations on special platforms such as general purpose graphics processing unit (GPGPU). In that manner, efforts on efficient window based algorithms get popularity with the requirement of disparity maps on variety of 3D systems. The second group involves global optimization algorithms [12]-[20], which are more complex and yield more precise estimates compared to the local methods. In this group, smoothness assumption of the disparity map is utilized by explicitly enforcing neighboring pixels to have similar depth assignments. These methods are formulated in an energyminimization framework and the objective is to optimize the global energy for the estimated disparity map. Markov Random Field (MRF) modeling is the most common approach for global methods, where efficient algorithms such as belief propagation [12] and graph cuts [14] have been introduced for the solution. In both of these approaches an iterative framework is exploited to provide smooth disparity maps and high visual similarity between matched pixels. In general, MRFs are constructed on regular grids and message passing is
51
achieved pixel-wise; however this approach may result in errors at object boundaries. This problem is handled by introducing region based MRFs, where each node corresponds to similarly color pixel groups, super-pixels, instead of individual pixels. This approach requires initial over-segmentation which determines piece-wise smooth units (pixel groups). Thus, message passing is achieved through an irregular grid which preserves object boundaries. In [17] and [19], the global optimization is performed over pixel groups after an initial segmentation process; homogenous pixel groups are supposed to have planar characteristics; hence piece-wise smoothness is constrained within the scene. The precision of global methods is increased especially at object boundaries and weakly textured regions with the initial over-segmentation step. However, utilization of irregular grids (pixels groups) instead of regular grids prevents the availability for fast processing due to symmetry loss. According to the test bed supplied through [111] where disparity estimation algorithms are compared in terms of accuracy, the best methods belong to the class of region based belief propagation that is an important evidence for the reliability of these methods. Cooperative methods [21]-[24] have been developed to unify advantages of local and global methods by handling occlusions, object boundaries and un-textured regions. These methods, similar to region based global algorithms, rely on the assumption that scenes are composed of non-overlapping planar patches all of which correspond to pixel groups involving color-wise similar pixels. Smoothness is enforced within each segment and depth distribution is allowed to sharply change among segment boundaries. These methods follow an iterative process to assign disparity distribution to segments by constraining pixel similarity, smoothness between similar colored neighboring segments, penalizing occlusions and overlapping regions. The computational complexity of cooperative methods is relatively high due to trial and error of various disparity hypotheses during the iterative processes. Thus, precise disparity maps are obtained with some sacrifice on simplicity. The final class is the semi-global methods [25]-[28] which involve dynamic programming (DP) optimization. These methods are provided to decrease computational complexity of global algorithms which are NP-hard in general. From that point of view, global optimization is performed for each scan-line (row) independently resulting in a polynomial complexity. The main assumption throughout dynamic programming optimization is the ordering constraint between neighboring pixels along the same row. The most important advantage of DP is that, fast processing can be obtained with globally optimized disparity assignment for a scan-line. In that manner, real time implementations can be obtained without any requirement on dedicated platforms with less precision. However, lack of inter
52
scan-line consistency breaks smoothness assumption and result in streaking artifacts. There are extensions of DP exploiting consistency between scan-lines by vertical support of cost function [29], post-processing to reduce streaking artifacts and additional vertical passes.
3.2
Motivation
Rapid execution time, robust disparity estimation and low memory requirement are the fundamental constraints of stereo matching algorithms, especially in consumer electronics applications. Moreover, for the next generation 3D TVs, robotic applications and surveillance systems, stereo estimation algorithms should require less memory, provide less computational complexity and less precision loss in the extracted 3D models. In that manner, local window-based methods are the strongest candidates for faster disparity calculations [29]-[36]. Local methods typically neither involve any iterative steps, nor utilize full cost volume and they also require low memory compared to other methods. As a result, these methods become available for real-time implementations on special platforms [35] and the efforts on efficient window based algorithms gain popularity by the requirement of disparity maps on variety of 3D systems. The increase in processing speeds supported by special platforms providing parallel processing, such as GPGPU and Nvidia Compute Unified Device Architecture (CUDA), real-time implementation of disparity estimation algorithms gained attention. Therefore, there is a trend to develop algorithms, which are prone to be implemented in parallel, whose examples are given in [27]-[36]. Most of the real-time methods [30]-[35] exploit local optimization strategy yielding most efficient results with low complexity. An evaluation between real-time local methods is given in [10], illustrating the variety of highly efficient window based methods. Pixel based belief propagation is also an alternative for real-time methods [36] to achieve global optimization on a regular grid. In [26] it is proven that dynamic programming can also be implemented in parallel to achieve real-time performance. When the variety of real-time approaches is considered, it can be argued that local optimization is the most visited technique (especially edge-aware filters) providing similar precision compared to its global and semi-global alternatives. Therefore, local methods are expected to be the strongest candidates for 3D TV systems due to their algorithmic variety and simplicity to provide satisfactory results.
53
It is important to note that edge adaptive local methods [6]-[11] with constant complexity exploit box filters which require scanning of the entire image. Two pass weighted integration approach introduced in the previous chapter resembles summed area tables phenomenon in terms of horizontal and vertical scanning, where aggregation is achieved adaptively during passes in four directions, instead of box filters. The horizontal scanning idea has also some similarities with dynamic programming [25]-[28] optimization due to scan line directions; however, there are fundamental differences. DP algorithms operate on full matching costs, requiring cost values for each disparity candidate at a certain time; on the other hand, the proposed method operates on image space, where each disparity candidate are considered, independently, as a consequence of local winner-take-all optimization. Moreover, additional vertical scan in the proposed approach extends aggregation in 2D. In [37], arbitrary support region [8] and scan line optimization ideas are unified with additional refinement stage to obtain high quality disparity maps with additional computational complexity. The diffusion based approaches [38]-[39], utilize 4-neighborhood color similarities to update cost values related to the idea introduced in this study; however, they require high number of iterations to enlarge support regions. Hence, the proposed algorithm eliminates iteration and support area dependency, while aggregates cost values effectively among large regions by single four passes, which saves computation and memory. Another important issue for stereo applications is the smooth variation of disparity assignments along time axis, as long as there is smooth motion. Hence, temporal information should also be considered to handle possible flickers due to noise, motion and lighting changes.
3.3
Proposed Approach
In general, local stereo matching methods involve similar steps consisting of cost calculation, cost aggregation, minimization and occlusion handling [9] as illustrated in Figure 3.4. The cost values are calculated for each disparity candidate based on color similarities between stereo pairs, and then aggregation of the cost values is provided by averaging or summation over various support regions. Initial disparity maps are obtained by assigning disparity values having minimum supported cost values. The simplicity of the minimization approach, winner-take-all (WTA), is one of the most important properties of local methods providing ease for implementation on different platforms. In the final step, the
54
occluded and unreliable regions are detected among initial disparity maps and handled by post processing.
Figure 3.4: The flowchart of the local stereo matching approaches.
Cost aggregation and occlusion handling steps are the most discriminative steps that determine performance of these algorithms in terms of computational complexity and accuracy. In the proposed method, the conventional approach of local stereo matching algorithms is followed with some innovative steps for cost aggregation, occlusion handling as well as temporal consistency. The key idea behind most of these innovative steps in this study is to obtain weighted averaging over support regions within constant time. Although, applications of the box filter to vision problems have led size-independent complexity for any matching or searching step, obtaining a weighted sum for the same regions requires additional iterations, further decreasing efficiency of box filter. For this purpose, permeability filtering (PF), introduced in the previous chapter, is exploited for the cost aggregation step that involves intensity-dependent two-pass integration over some cost data. The same filtering structure is further exploited with minor modifications for the occlusion handling and temporal filtering to finalize the stereo disparity estimation.
3.3.1
Cost Calculation
There are various metrics to calculate visual similarity of pixels between stereo images. In [39], an excellent analysis of the common endeavored cost functions is given in terms of computational complexity and matching reliability. According to that analysis Census Transform [40] is one of the best performing cost functions providing robust pixel matching. Census Transform, CT(x,y,n), of a pixel (x,y), is the bit stream obtained through comparison of intensity levels between neighboring pixels according to
if I ( x, y ) I ( xn , yn )
1 CT ( x, y, n) 0
else
55
,
(3.2)
where n corresponds to the clock-wise (or counter clock-wise) order of neighboring pixel (xn, yn) in the bit stream. Hence, within a specified window (kxk), the pixel is represented by a binary codeword of length k2-1, forming the transformed image. During matching stage, Hamming distances [40] between the corresponding bit streams are calculated as a cost function. The superior performance of Census Transform comes with some increase in computational complexity, especially due to Hamming distance calculation. On the other hand, sum of absolute difference (SAD) is one of the most endeavored metrics due to its computational simplicity. Hence, in this study these two metrics are exploited to provide a trade-off between accuracy and complexity, as recently proposed in [37]. Assuming that the stereo pair is horizontally aligned, the cost values corresponding to a candidate disparity d are calculated by shifting pixels in one image onto the other image along horizontal direction as, 3
CdSAD ( x, y ) min( I left ( x, y, i ) I Right ( x d , y, i ) , T ) , i 1
C
CENSUS d
( x, y ) Ham{CTleft ( x, y, n), CTRight ( x d , y, n)} ,
(3.3)
Cd ( x, y ) CdSAD ( x, y ) (1 ) CdCENSUS ( x, y ) , where CdSAD(x,y) corresponds to the SAD cost value of the pixel (x,y) in the left image for disparity d, Ileft and Iright are three-channel (RGB) left and right images. During SAD cost calculation, occluded or overlapped regions cannot be handled in a different way, since 3D structure is not known; hence, truncation of the cost values is performed to keep maximum SAD below a level (T) for enabling disparity values to be assignable depending on local neighboring support. For the census measure CdCENSUS(x,y), Hamming distance, Ham{.}, between the bit streams of the correspondences in the census transformed images, CT, is calculated. In this study, for the census transform a (5x5) window is exploited. Once the SAD and CENSUS cost measures are obtained, the cost function Cd(x,y) is set as the linear combination of both.
3.3.2
Cost Aggregation
Cost aggregation is the most important step reflecting the general performance of the proposed and all other local stereo matching algorithms. In general, for each disparity candidate aggregation is performed between spatial relations independently, and then the aggregated cost values are compared in order to determine the best disparity candidate. In
56
this step, aggregation is provided by the permeability filter which is introduced in the previous chapter. The proposed aggregation approach involves three main steps; first, for each pixel depending on color similarity between neighboring pixels, permeability weights are calculated based on the filter type (4 or 8-neighbor). These weights correspond to the ration of data that is to be carried through the corresponding direction. Then, these permeability weights are utilized to perform aggregation in horizontal and then in vertical direction. The order of horizontal and vertical aggregation can be interchanged optionally; in this study horizontal scanning is followed by vertical scan. It is important to note that during the cost aggregation, normalization step of the permeability filter is not required since, for each disparity candidate, the same normalization coefficient is exploited. Thus, relative order of the cost values is not changed by the normalization which seems to be additional computational burden. Though, the total complexity of the proposed aggregation is 6D additions and 4D multiplications per pixel without any normalization step, where D is the number of disparity candidates. The effect of the proposed filtering (4-neighbor) on the cost function can be observed in Figure 3.5, for which cost functions for four pixels are illustrated on Teddy [111] stereo image. In the figure, “blue” colored functions correspond to pixel-wise evaluated cost values and “red” colored functions correspond to the filtered data. The filtering approach provides smoother and reliable cost functions, while decreasing the effect of noise and fluctuation that may cause errors in the disparity assignment. Given the ground truth disparity values of the points by the vertical lines, it is clear that the proposed approach provides cost functions to be minimized at actual disparities. As discussed in the previous chapter, support area provided by the proposed method can be limited due to orthogonal scanning which may result in some precision loss especially along thin and tilted objects with non-vertical and non-horizontal structures. On the other hand, depending on local characteristics, such as smoothness, larger support regions can be provided through the proposed method since there is no constraint on support area limited by any pre-defined window size unlike all state-of-the-art edge-aware filters. Hence, permeability filtering extends support areas in certain cases, while loses precision along thin and tilted objects with much lower computation complexity.
57
Figure 3.5: The effect of the proposed filtering on the cost function for selected four pixels on Teddy stereo image.
3.3.3
Minimization
As a common procedure to most of the stereo algorithms, minimization procedure is performed by a winner-take-all (WTA) approach. For this aim, aggregation of cost values are calculated for each disparity candidate independently and the candidate with minimum cost is assigned to the corresponding pixel. The computational complexity of the aggregation step is 4D multiplication and 6D summation for each pixel, where D is the total number of candidate disparities. It should be noted that, most of the execution is spent for the aggregation step and less effort is required for the minimization compared to some other complex optimization methods, such as belief propagation [18] and graph cuts [20].
3.3.4
Occlusion Handling
The cost calculation, aggregation and minimization steps are performed for both of the images, and at the end of these steps two initial disparity maps are obtained for the stereo pair. As illustrated in Figure 3.6, the initial disparity maps involve errors at occluded regions in which the true correspondences cannot be obtained due to invisibility. Those regions should be handled by post-processing in such a way that reliable information is diffused to assign geometrically consistent disparity values. Hence, as a first step, reliable and occluded region detection is performed by a cross-check between two disparity maps.
58
The results of the occluded region detection between the initial disparity maps given in Figure 3.6 for the Teddy stereo image are illustrated in Figure 3.7, where unreliable and occluded regions are colored in red. It is obvious that occluded regions are observed along the image boundaries (leftmost edge regions of the left image and vice-versa for the right image) and depth discontinuities where there are large disparity differences between the local foreground and background.
Figure 3.6: The initial disparity map estimates for the Teddy stereo pair [111], bright regions correspond to large disparities (i.e. closer to camera).
Figure 3.7: The detection of occluded and unreliable disparity estimates (red color) for the Teddy stereo pair.
59
Although, there could be different ways to compensate for the occlusions, handling of those regions is performed by a novel two-pass filtering approach that is based on the proposed permeability paradigm, as it is utilized in the cost aggregation step. Permeabilitybased filtering is performed over the disparity map, taking the reliability of the regions into account and the filtered disparities are assigned to the occluded regions. Such an approach provides data diffusion over the occluded pixels based on color-wise similar and reliable pixels. In general, occluded regions are located at the local background, since foreground region is always visible in both of the images. Therefore, most of the occlusion handling algorithms [16] diffuse information from background to the occluded regions in various ways. In the proposed approach, diffusion of background information is further supported by color-wise similarity between pixels. Considering the reliability and the foreground-background characteristics of the pixels, a confidence map, Conf(x,y), is generated in such a way that the occluded regions are assigned to the value zero, whereas the reliable regions are assigned to a range of values between [ф,1] depending on the disparity values, as,
0 Conf ( x, y) f conf (d )
occluded else
,
(3.4)
where d is the disparity value of the pixel (x, y), fconf is the confidence mapping function and ф is a constant (set to 0.1 throughout the whole experiments). In this work, a linear mapping function is proposed to map reliable regions, as presented in Figure 3.8.a, so that pixels at local background are favored during occlusion handling. As illustrated in Figure 3.8.b, the confidence map is obtained for each image, while the occluded regions are assigned zero confidence. According to the resulting confidence map, it is clear that local background regions are favored with higher weights compared to foreground regions. Once the confidence maps are obtained for left and right images, the disparity maps are weighted by these maps as, weight DLeft ( x, y ) DLeft ( x, y) Conf Left ( x, y) weight DRight ( x, y ) DRight ( x, y ) Conf Right ( x, y )
.
(3.5)
The next step of occlusion handling is determination of appropriate disparity values for the occluded regions that is achieved by permeability based filtering of the weighted disparity and the confidence maps. At that step, normalization is required to assign disparity
60
values in the range of minimum and maximum disparities. The permeable filtering provides weighted summation over disparity values, possibly resulting in larger values than the disparity values.
Figure 3.8: (a) Confidence mapping function for reliable pixels based on disparities, (b) the resultant confidence map for the left image.
In order to provide range-filtered results, the filtered data should be normalized by the total effective weights calculated for each pixel, as,
D
Norm
FPer D weight ( x, y) ( x, y ) FPer Conf ( x, y )
,
(3.6)
where DNorm is the normalized disparity map at the filter output. The permeable filtering of confidence data provides total effective support weights exploited during the filtering of the weighted disparity map; hence, normalization with these values enables filtered data to remain within the range of the disparity map. It is important to note that during disparity data filtering, the same permeable weights of the cost aggregation step are utilized. The filtered and normalized disparity values, DNorm, in (3.6) are assigned to the unreliable or occluded pixels detected in cross-check. As the final step of occlusion handling, a median filter with window size of (3x3) is applied to the estimated disparity maps to remove possible noisy assignments. In Figure 3.9, the resultant disparity maps are illustrated after occlusion handling with and without background favoring. It is obvious that, occlusion handling is a critical step to increase the reliability, as some corrected regions (shown by green circles) are observed. In Figure 3.9.b; some leakage (circled in red) from the foreground object is observed when background favoring is not performed, due to color-wise similarity between foreground and background pixels; whereas, the proposed approach (with background favoring) handles these cases as illustrated in Figure 3.9.c. The method assigns geometrically 61
consistent disparity values to the large occluded regions, i.e., the leftmost circle in Figure 3.9.c, as well. Hence, unification of background favoring and color adaptive filters for the occlusion handling enable crisp and edge-preserved disparity maps which is important for high accuracy.
Figure 3.9: (a) Initial disparity map, (b) occlusion handling with no background favoring, (c) the proposed occlusion handling.
3.3.5
Temporal Consistency
In stereo video, estimated disparity maps may fluctuate between different disparity hypotheses in time due to noise, change in lighting conditions or motion. These fluctuations result with the flickering of disparity maps that is an important visual artifact reducing quality of any process which is based on disparity, such as depth based enhancement or virtual view synthesis. Thus, as proposed in [43], the disparity maps should be linked in temporal domain to obtain temporal consistency. In that manner, the proposed algorithm is extended for temporal consistency of static backgrounds, where flickers cause disturbance more than the moving regions. Modifications are performed in two stages, cost calculation step and a final filtering step with the disparity map of the previous frame. During the cost calculation step, the RGB-based cost function is updated by using a temporal consistency term based on the color similarity of the corresponding pixel with its correspondence at same coordinates in the previous frame. Ideally, the support in temporal direction should be provided by the motion information; however, such an approach increases the computation drastically. In the proposed approach, a temporal model is provided by color change of pixels in time. Hence, for each pixel, the permeability along the temporal direction is calculated by comparing RGB differences as follows:
62
t ( x, y ) min( e R / , e G / , e B / ) R
I Rt ( x, y ) I Rt 1 ( x, y )
G
I Gt ( x, y ) I Gt 1 ( x, y )
B
I Bt ( x, y ) I Bt 1 ( x, y )
,
(3.7)
where It and It-1 correspond to the current and previous images of the RGB channels, and μt(x, y) corresponds to the temporal permeability for the pixel, (x, y). The temporal permeability determines the information ratio that is to be transferred from the previous frame for each individual pixel; hence, provides high rate of data transfer from the previous frame for the pixels in which RGB change is low. The extension of the initial cost function in (3.3) is given by the relation,
Cdt ( x, y) Cd ( x, y) t ( x, y) d D t 1 ( x, y)
,
(3.8)
where Dt-1(x,y) is the disparity map of the previous frame and Cdt ( x, y) is the updated cost function of the current frame. The disparity map of the previous frame is constrained during the process of the current frame in such a way that disparity candidates which are different than the previous disparity values are penalized according to temporal similarity. Therefore, for the pixels with high temporal permeability, the disparity in the previous frame is favored in the cost function. For the regions, whose temporal similarity is low, none of the disparity values are favored. Hence, a temporal change adapted temporal data transfer is provided, enabling smooth disparity variations among non-moving regions and instant variations for moving regions. The updated cost function is utilized in the aggregation and minimization steps, providing temporal consistent disparity assignments. A second extension in the temporal domain is provided by a weighted filtering at the final step. The weighted filtering is performed between the disparity maps of the previous frame and the current frame such that the weight coefficients are determined according to the temporal permeability values for each pixel, as
D t ( x, y) 1 t ( x, y) D t ( x, y) t ( x, y) D t 1 ( x, y)
.
(3.9)
Thus, for the temporally smooth regions, disparity map of the previous frame is more weighted, and vice versa for regions in which temporal change is observed. This step corrects possible errors due to sudden changes in lighting conditions that might not be handled by updating cost function with temporal constraints as in (3.8).
63
3.4
Experimental Results
The test bench [111] provides an environment to evaluate and compare stereo disparity map estimation algorithms based on four different stereo images whose ground truth disparity maps are provided. Although the test bench lacks the comparison of algorithms in terms of computational complexity and temporal constraints, it gives an idea about the visual quality of the estimated disparity maps on static images. In order to evaluate the robustness of a stereo matching algorithm, further experiments that include various stereo scenes and consider temporal reliability should also be required. Hence, the presented experiments in this work are performed in three categories, for which in the first category the performance tests are conducted on extended static stereo images via test bench provided by [111]. Moreover, computational complexities are also compared for the proposed algorithm against the well known edge-aware filters discussed in the previous chapter. In the second category, the effect of temporal information transfer is analyzed for stereo videos where dynamic scenes are dominant. In the final category, detailed analyses of the proposed scheme are given in terms of complexity distribution of algorithmic blocks, effect of resolution and occlusion handling. Moreover, the reasoning behind the parameter selection is discussed in the final section for the sake of completeness.
3.4.1
Static Scenes
The experiments on the static scenes are divided into two sections; in the first section, the performance evaluation is conducted on the extended Middlebury stereo data whose ground truth disparity maps are available. In the second section, a detailed computational complexity comparison is presented against state-of-the-art local methods.
3.4.2
Accuracy
In this sub-section, aforementioned edge-aware filters are exploited for aggregation during disparity estimation and compared with the proposed approaches. The experiments are conducted on the extended stereo images on different scenes provided by [111] as given in Figure 3.10 and the corresponding ground truth disparity maps in Figure 3.11. The resolution of the stereo images is around 550x650 (scaled to 720x576 pixels for
64
computational tests) and the valid range between stereo pairs is around 100 disparity levels. As observed in Figure 3.10, there are various scenes with different characteristics having textured, non-textured, repetitive, highly occluded and non-occluded regions with different scene brightness. In this manner, experiments on this data set give a general intuition on the general performance of a stereo matching algorithm. During the comparative tests, the same cost function and occlusion handling techniques are utilized in order to be fair against all aggregation methods. Hence, disparity maps are calculated by only alternating the aggregation step and fixing the number of disparity candidates at 100 levels independent of stereo pair. At that point it is important to note that a well known background copying approach is exploited for occlusion handling, rather than the proposed approach, in order to provide a fair comparison. Accuracy of the disparity maps is calculated by two criteria, similar to the evaluation in Middlebury stereo benchmark, the percentage of erroneous pixels having 1 or 2 disparity level difference with respect to ground truth. The error percentage is measured for visible pixels (excluding occluded regions) and all pixels to analyze in detail. During experiments, proposed approach is compared in terms of stereo matching performance against bilateral filter [45], two-pass bilateral filter [52], constant time bilateral filter [64], guided filter [47], cosine integral images [48], adaptive box filter [72], geodesic support filter [11] and arbitrary shaped cross filter [8]which are all state-of-the-art edge-aware filtering techniques. During the accuracy comparison, optimum parameter settings are determined for each technique by trial and error (fixing the aggregation window at 30x30), reflecting the best precision they can achieve for the given configuration. The percentages of erroneous pixels are given in Table 3.1 for two different error criteria. According to these results, the proposed approach with 4-neighbor permeability has the best accuracy that is followed by the 8-neighbor version for all scenarios. Guided filter has the second best performance for the higher sensitive error metric with one disparity level difference; while for two level disparity differences, geodesic filter has the best performance after the proposed technique.
65
Figure 3.10: The extended stereo scenes provided by Middlebury online stereo test bed [111].
66
Figure 3.11: The provided ground truth disparity maps [111] where darker pixels correspond to background regions.
67
Table 3.1: The percentage of erroneous pixels for two disparity difference thresholds during stereo matching for state-of-the-art edge-aware filters.
d>1
d>2
% Error
Visible Pixels
All Pixels
Visible Pixels
All Pixels
Proposed-4
7.9
14.2
6.4
10.3
Proposed-8
8.1
15.2
6.3
10.6
Guided [47]
8.4
15.1
6.8
11.8
Geodesic [11]
9.9
17.5
8.0
12.7
Bilateral [45]
9.5
16.9
7.4
13.1
Var. Cross [8]
8.8
17.1
7.0
12.6
2-pass Bilateral [52]
9.7
17.2
8.1
13.0
Adapt. Box [72]
9.1
18.2
7.3
13.5
O(1) Bilateral [64]
11.3
18.4
9.9
14.1
Cos. Int. [48]
9.1
19.4
7.2
14.0
No Aggregation
19.1
34.5
17.4
30.9
The results for the non-aggregation scenario are also included in Table 3.1 for better understanding of the importance of edge-aware filtering. It can be clearly observed that erroneous pixel ratio is decreased by 66% through the utilization of proposed permeability filter compared to no aggregation case. The proposed approach outperforms state-of-the-art filtering techniques with an almost 10% increase in precision for one disparity level error metric, this improvement reaches up to 15%, when precision is sacrificed with additional one level difference. In Figure 3.12, estimated disparity maps for five scenes with different characteristics are illustrated for visual interpretation of the results given in Table 3.1. According to Figure 3.12, all methods perform quite well for the textured regions, such as the Dolls stereo pair in the middle; however, as the regions become un-textured, Monopoly and Midd1 pairs, the methods yield erroneous estimates except for the proposed approaches. This is due to the specific window size definition of the state-of-the-art filters which limits diffusion of information from large areas. On the other hand, the proposed techniques do not exploit any window size definition and aggregate cost values depending on the texture characteristics as discussed in the previous chapter. Therefore, for the un-textured surfaces, support regions tend to increase and that provides much more reliable estimates.
68
Figure 3.12: Top-to-bottom: color views (Aloe, Art, Dolls, Monopoly, Midd1 [111]), disparity maps via bilateral, 2-pass bilateral, O(1) bilateral, guided, cosine integral images, adaptive box, geodesic, arbitrary shaped cross filter, proposed 4-neighbor and proposed 8-neighbor correspondingly.
69
Apart from the comparative results for the extended stereo set, proposed 4-neighborhood approach is also tested on the online stereo benchmark [111] for four fundamental Middlebury pairs, Tsukuba, Teddy, Cones and Venus as given in the first row of Figure 3.13. In this benchmark, a ranking is given for the estimation results provided by the published studies. The resultant disparity maps of the proposed algorithm are illustrated in the third row of Figure 3.13. According to the error maps between the estimated and ground truth disparities given in the last row, the proposed approach preserves disparity transitions at object boundaries and provides crisp maps. In Table 3.2, quantitative results taken from the online Middlebury stereo database are illustrated for top local methods. The quality of disparity maps in Table 3.2, are calculated after comparison with the ground truth over non-occluded, visible, pixels. According to these results, the proposed method ranks 18 among 140 submissions involving complex global optimization methods (such as segment based Belief Propagation [18]); while it takes the 1st rank among local-based methods without any post-processing stage. Moreover, the proposed method provides the highest quality disparity maps for Tsukuba, Teddy and Cones stereo images compared to the other local methods that is another promising result. The rankings provided in Table 3.1 and Table 3.2 are compatible with each other. CostFilter [134], GeoSup [11], AdaptWeight [7] and VarCross [8] utilize guided, geodesic, bilateral and arbitrary cross shaped filters correspondingly and they have the same relative rankings in both of these tables. The remaining methods in Table 3.2, utilize variations of bilateral filter with specific additional refinement and approximation stages. It is also important to note that, the error ratios in Table 3.2 are smaller than the results presented in Table 3.1; this is due to the narrower baseline between left and right cameras which limits the number of disparity candidates as well as increase precision. On the other hand, proposed approach also out-performs algorithms based on Dynamic Programming optimization [25]-[27] which share some similarities in terms of scan line processing. The approach presented in [36] has the best accuracy (Rank 1) due to unification of multi-directional scan line optimization and arbitrary shaped support regions with additional post processing. Proposed approach outperforms arbitrary shaped cross filter which is included for aggregation structure in [37], according to the detailed experiments given in Table 3.1. Therefore, more precise disparity map estimates can be provided by the permeability filter with additional refinement steps and increased complexity.
70
Figure 3.13: First row: images (Tsukuba, Venus, Teddy, Cones) from Middlebury stereo database [111], Second row: ground truth disparity maps, Third row: disparity maps by the proposed algorithm using SAD+CENSUS, Fifth Row: disparity errors for (SAD+CENSUS) larger than 1 disparity level where gray corresponds to errors at occluded regions and black is for non-occluded regions.
Table 3.2: Rankings of the selected local methods in Middlebury online benchmark Error non-occluded pixels [%] Avg. Error [%] Tsukuba Venus Teddy Cones
Algorithm
Rank
Proposed (SAD+Census)
18
5.50
1.06
0.32
5.60
2.65
19 25 31 34 46 48 50 54 62 68 69 75
5.55 5.80 5.49 6.10 6.14 6.33 6.44 6.20 6.67 7.31 7.33 7.60
1.51 1.45 1.88 1.19 1.21 1.06 1.25 1.38 1.38 2.38 2.47 1.99
0.20 0.14 0.38 0.23 0.35 1.00 0.25 0.44 0.71 0.34 0.74 0.62
6.16 6.88 5.99 7.80 7.45 5.86 8.43 6.80 7.88 9.83 8.31 9.75
2.71 2.94 2.84 3.62 3.91 4.06 3.77 3.60 3.97 3.10 3.86 6.28
CostFilter[134] GeoSup [11] GeoDif [137] AdaptDisp [128] DistinctSM [132] Proposed (SAD) SegSupport [23] CostAgg + Occ [133] AdaptWeight [7] Fast bilateral [135] HistoAggr [136] Var.Cross [8]
71
According the comparative results, it is clear that proposed scheme corresponds to the best performing local aggregation method dedicated for stereo matching. Some additional results of the proposed 4-neighbor approach are also given in Figure 3.14 for visual interpretation. In the last column of Figure 3.14, error maps are illustrated for (Δd >1) criteria in black and gray for occluded and non-occluded regions. The estimated disparity maps for all of scenes by the proposed 4-neighborhood approach are illustrated in Figure 3.15.
Figure 3.14: First column: color views, second column: estimated disparity maps, last column: erroneous pixels along occluded (black) and non-occluded regions (gray).
72
Figure 3.15: Estimated disparity maps through the proposed 4-neighbor permeability filter.
73
For the sake of completeness, visual comparison of the proposed approach is also provided with Depth Estimation Reference Software (DERS) [44] which is utilized for MPEG multi-view video standardization efforts. DERS performs graph cut optimization for the estimation of disparity maps from stereo or multi-view videos. In this study, DERS is applied for stereo matching with decreased baseline, which yield much more reliable estimates compared to a larger baseline. In Figure 3.16, the estimation results of proposed method (second row) and DERS (third row) are illustrated. According to the visual interpretation, there is a clear indication that the proposed method results in better precision along object boundaries and yields crisper disparity maps. On the other hand, DERS introduces foreground enlargement with insufficient occlusion handling capability. Further comparison is conducted in the next chapter, including the effect of these approaches for virtual view rendering which is the ultimate target of this dissertation.
Figure 3.16: First row: color views, second row: disparity maps by proposed 4neighborhood approach, last row: disparity maps via DERS [44], which is utilized in MPEG activities.
74
3.4.2.1 Complexity
The other important issue for the effectiveness of stereo matching algorithms is the computational complexity. In the previous chapter, state-of-the-art edge-aware filters have been compared in terms of memory requirement and computational complexity. Such a comparison can easily be extended for stereo matching, in which the filters are applied for cost aggregation. For the local methods, unless different cost functions and occlusion handling approaches are utilized, total run time of the algorithms are mostly determined by the cost aggregation step. Hence, a fair comparison in terms of computational complexity is given by Table 3.3, where disparity dependent aggregation times are listed for image resolution of 720x576. In Table 3.3, D corresponds to the number of disparity candidates that are tested for stereo matching. Table 3.3: Computational complexity of cost aggregation approaches for stereo matching based on the number of disparity candidates, D. Computational Complexity (msec)
Bilateral
2-pass Bilateral
O(1) Bilateral
Guided
Cos. Int.
720x576
1.7 104 D
1412D
200D
220 + 250D
1143D
Adapt. Box
Geodesic
Var. Cross
Proposed-4 Proposed-8
385 + 16D
3.4 105 D
385 + 16D
34 + 20D
720x576
67 + 59D
According to the results given in Table 3.3, the most efficient methods are the proposed 4 and 8-neighbor, adaptive box [72] and arbitrary shaped cross filters [8] whose rankings alter according to the number of disparity candidates. In the complexity of these methods, there are disparity independent terms which are related to the extraction of image dependent parameters such as permeability weights. These parameters are calculated once and exploited for each disparity candidate. On the other hand, for the remaining methods, all of the process is performed for each disparity candidate independently. The complexity plot of the 4neighbor permeability and the arbitrary shaped cross filter based on the number of disparity level is given in Figure 3.17 for further analysis. According to the plot, proposed approach requires lower complexity for the number of disparity levels below 90; whereas for higher number disparity candidates, arbitrary shaped cross filter has lower complexity. This result is due to the difference between the disparity independent and dependent terms. As discussed previously, arbitrary shaped cross filter [8] does not exploit weighted averaging as the proposed approach; therefore, the disparity dependent complexity is lower.
75
Figure 3.17: Comparative complexity analysis based on number of disparity candidates: proposed 4-neighbor method (red) vs. VarCross algorithm (blue) [8].
The joint comparison of the edge-aware filters for stereo matching is summarized in Figure 3.18. Horizontal axis corresponds to the execution time of aggregation for 100 disparity levels, whereas vertical axis corresponds to the average error rate of erroneous pixels with one disparity level difference w.r.t. ground truth. According to this comparison, proposed 4-neighbor permeability filter unifies high accuracy and low computational complexity in such a way that it enables fast execution that is competitive by the fastest state-of-the-art techniques with much higher precision. On the other hand, compared to the second best performance of guided filter [47] in terms of accuracy, proposed approach almost runs faster by a factor of 20. Utilization of 8-neighbor permeability filter triples computational complexity as well as introduces a loss in accuracy compared to 4-neighbor case. However, it still provides a competitive alternative to the state-of-the-art as presented in Figure 3.18.
Figure 3.18: Joint comparison of accuracy and computational complexity for the edgeaware filters.
76
3.4.3
Dynamic Scenes
The performance in static stereo frames should be carried into temporal domain by providing consistent disparity maps in time. In order to test the performance of the proposed method in time domain, disparity values of selected pixels on two different stereo videos are illustrated among the time axis. In Figure 3.19, the variation of colored pixels in stereo video Kayala [138], which is a Russian short film, is illustrated for disparity maps one of which is obtained through temporal constraints and the other is obtained with no temporal constraint. According to these plots, proposed temporal information permeability stabilizes the disparity variation and almost constant disparity values are observed for the selected non-moving regions, as it can also be confirmed by the given video shots and disparity map of the first frame. The fluctuation of disparities, when there is no temporal constraint, is quite obvious; this may drastically affect the disparity dependent applications. Another stereo video, Newspaper [113] is given Figure 3.20, with the disparity distribution of the selected pixels among time axis. The stabilization of non-moving pixels (blue and red colored) is provided by the proposed algorithm. In addition, as observed for the purple colored pixel along which an object transition is observed by the given video shots, disparity variation is preserved when sudden disparity changes are observed. Hence, temporal permeability provides actual disparity changes to be observed as long as obvious color changes occur at the corresponding region while preventing fluctuations or false disparity changes as long as color is constant among time. According to the results presented in Figure 3.19 and Figure 3.20, it can be concluded that temporal permeability provides computationally inexpensive background stability in time.
3.4.4
Analysis of the Algorithm
In order to analyze characteristics of the proposed method for stereo matching, extensive tests are provided involving detailed time analysis, the effect of occlusion handling, an analysis on use of different resolutions and finally the reasoning behind parameter selection.
77
Figure 3.19: Stereo video Kayala [138] and the variation of disparity values for colored pixels along time, exemplar color views are given at the last row.
78
Figure 3.20: Stereo video Newspaper and the variation of disparity values for colored pixels along time, exemplar color views are given at the last row.
3.4.4.1 Complexity Analysis
The total computation time for disparity estimation of a stereo pair with resolution of 720x576 among 100 disparity levels is measured to be around 29 seconds when the proposed 4-neighbor aggregation approach is utilized. Distribution of the computational time as a chart is presented in Figure 3.21, where most of the computation is devoted to cost calculation, especially census transform. This is an important observation since for most of the traditional local methods, aggregation is the most time consuming step. In this case, however, speededup aggregation provides much efficient computation so that cost calculation remains to be the most complex stage.
79
Figure 3.21: The distribution of computation time among algorithm steps
Census transform among 5x5 window through RGB color domain requires 75 additions for each disparity candidate, compared to the complexity of the 4-neighbor permeability filter (4 multiplications and 6 additions), hence the distribution provided in Figure 3.21 is an expected result. On the other hand, utilization of SAD cost metric requires much less computation with 5 additions. Minimization and occlusion handling steps have negligible effect on the complexity with a share of 2%.
3.4.4.2 Effect of Occlusion Handling
The effect of occlusion handling is already illustrated in Figure 3.22, in which the disparity estimates are presented with and without occlusion handling. It is concluded that occlusion handling step fixes the errors at depth discontinuities where foreground objects occludes background objects and provide crisper maps preserving discontinuities. Apart from visual interpretation, the results are also compared with the Middlebury stereo benchmark, Table 3.4, and the increase in the accuracy is obvious when the left-right consistency is enforced through occlusion handling. The effect of depth favoring is also observable in Table 3.4, where the accuracy decreases tremendously as soon as depth favoring is not exploited. Hence, it is clear that depth based weighting is critical to handle occluded regions.
80
Figure 3.22: First Row: Disparity maps without occlusion handling, second Row: disparity maps after occlusion handling
Table 3.4: Effect of occlusion handling on the ratio of erroneous pixels in the estimated disparity maps. Error all pixels [%]
Algorithm
Rank
Avg. Error [%]
Tsukuba
Venus
Teddy
Cones
Full method
15 40 51
5.5 6.5 7.3
1.5 1.8 2.6
0.9 1.5 1.9
13.1 14.9 17.0
9.2 10.3 10.8
Occ. with No depth favor
No Occ
The proposed occlusion handling method is further compared with the approach utilized in Guided Stereo [134] which has the best performance in state-of-the-art. For this purpose, initial disparity estimation is conducted by the proposed aggregation over the extended stereo database; then the occlusion handling methods are applied on these same initial estimates. The precision of these approaches are evaluated for two cases, in the first scenario all pixels are considered during the error calculation. In the second scenario, frame boundaries are excluded; as illustrated in Figure 3.23, there is no available information for the completion of these large regions (around 50-100 pixel width depending on disparity distribution). Moreover, there might be color inconsistencies between the visible and nonvisible parts. Therefore, the error rates are recalculated by ignoring the left-most frame boundary which is not visible in the other view to observe the occlusion performance within the image. According to the results given in Table 3.5 for both cases, the proposed occlusion handling approach enables more reliable (20-30%) completion of missing regions compared to the method introduced in guided filter. It is expected to observe the decrease of erroneous pixel
81
percentage when the frame boundaries are discarded. Compared to the traditional background copy approach, utilized in the previous section, proposed depth favoring edgeadaptive occlusion handling method has superior performance with approximately 25% improvement in accuracy.
Figure 3.23: Left: darkened occlusion frame boundary for the left camera view, right: the right view
Table 3.5: Comparison between three occlusion handling methods in terms of average percentage of erroneous disparity assignments. Avg. Error [%]
All Pixels
Exclude Frame Boundary
Background Copy
14.2 11.2 12.9
10.6 7.6 9.6
Proposed Guided Filter
3.4.4.3 Multi-resolution Effects
The dependency of the proposed approach for different resolution levels is also examined to discuss on the scalability of the algorithm in terms of accuracy. In that manner, disparity maps are also estimated for the low resolution views which are obtained through downsampling by 2 and 4 correspondingly. In order to preserve the disparity resolution, cost calculation and occlusion handling steps are conducted on the original scales, while aggregation and minimization are provided at the down sampled domain. It is important to note that computational complexity of cost calculation is not affected for different resolutions due to utilization of original scale images. On the other hand, computational burden due to aggregation and minimization are decreased by the decimation ratio. The average error rates for the various resolutions are given in Table 3.6; accuracy drops as the
82
color images are down sampled due to detail loss along object and frame boundaries as illustrated in Figure 3.24. According to visual comparison, decrease in accuracy is not severe for the scale factor of 2, while it is obvious for scale factor of 4 with stair effects along depth discontinuities. Hence, down sampling (by 2) could be an option for various applications, such as GPU implementation, which strictly require low memory, fast computation and acceptable precision. Table 3.6: Average erroneous pixel percentage obtained by the proposed approach for three different resolutions
d>1
d>2
% Error
Visible Pixels
All Pixels
Visible Pixels
All Pixels
Original Scale
7.9
14.2
65
10.3
Down Sample by 2
8.8
16.7
7.1
12.5
Down Sample by 4
8.9
17.2
7.2
13.9
Figure 3.24: Disparity maps in (a) full resolution, (b) down sampled by 2, (c) down sampled by 4 for Aloe and Art [111]stereo pairs.
3.4.4.4 Parameter Selection
Considering the parameter set of the proposed stereo matching method, the most important parameter is the smoothing factor σ that determines permeability weights of each pixel as well as aggregation characteristics. The weight (α) between SAD and Census
83
transform costs has also an impact on the precision which has been discussed in some recent work [37] [39]. Therefore, only the effect of smoothing factor is examined by fixing the truncation value (T) at 15 and setting α to 0.2. In Figure 3.25, the average erroneous pixel percentage on the estimated disparity maps with respect to the ground truth disparity maps based on the variation of smoothness factor is illustrated. All the stereo pairs illustrated in Figure 3.10 are utilized to calculate the bad pixel percentage in order to provide a much reliable measure. The effect of smoothness parameter on stereo matching quality can be observed in Figure 3.25 for the Art sequence. It is clear that, for high σ values, smoother disparity maps are obtained and structural details are lost due to high permeability. On the other hand, as σ is decreased, salt-and-pepper type artifacts are observed in the disparity maps that reduce smoothness as well as estimation quality. According to the erroneous pixel percentages given in Figure 3.25 and visual interpretation, setting σ in the range [4, 16] provides a good matching quality that also covers the selected σ=12 value throughout this study.
Figure 3.25: Top: average bad pixel percentage plot for all Middlebury stereo pairs based on smoothness factor, Bottom: disparity maps for the Art sequence at specific σ values.
84
3.5
Conclusion
In this chapter, a novel local stereo matching algorithm which utilize permeability filter paradigm during the aggregation of cost values, occlusion handling and temporal consistency is presented. Permeability filter combines low memory requirement, fast execution and high accuracy, yielding an efficient stereo matching approach. The connected support regions provide crisp disparity maps with preserved depth discontinuities along object boundaries. Through intensive experiments to check accuracy and complexity, it is clearly observed that the proposed stereo matching algorithm outperforms state-of-the-art with significant improvements. According to the comparative results in Middlebury online test bench, the proposed algorithm has the 1st rank in terms of accuracy among the local based stereo matching algorithms. Moreover, the fastest execution time is observed with no specialized hardware among top 10 local methods, in CPU. It is important to note that the proposed method utilizes only filtering of some cost functions with no additional local-global optimizations. Therefore, its performance can be further increased by additional optimization steps after the aggregation stage. In its simplest version, the presented stereo matching approach is one of the most efficient techniques in the literature with a high precision and a fast operation. Cache friendly data acquisition, low operational complexity and high parallelization capacity of the permeability filter enable implementation of stereo matching on different platforms as well. Hence, GPU implementation of this approach is presented in the last chapter that yields real-time processing capability. Proposed algorithm is analyzed in terms of multi-resolution scalability and distribution of computation among its steps. Moreover, parameter selection is discussed that has influence on the accuracy of estimation. Significant improvement is provided for the occluded regions by the proposed depth favored occlusion handling method. Besides, extension of permeability filter to temporal domain results in flicker-free disparity maps especially within stationary background regions that is quite important for various applications of stereo video. In the following chapter, performance of the proposed stereo matching algorithm is further tested for virtual view rendering application that is the fundamental tool for extension of stereo video to multi-view.
85
CHAPTER 4
4
VIRTUAL VIEW RENDERING
Virtual view rendering (VVR) is an important tool for 3D processing that enables generation of inexistent views from a collection of images as illustrated in Figure 4.1. This tool is utilized in various areas to extend functionality of 3D systems; such as virtual reality, depth control on stereoscopic displays, virtual tour among 3D reconstructed scenes and increasing number of viewpoints in multi-view and free view TVs. The advances in 3D technology accelerated research efforts on VVR to produce various applications for consumer electronics, robotics, military and medical technology.
Figure 4.1: Inexistent views can be generated by virtual view rendering from the captured views.
Depending on alternative application areas and available 3D data formats, VVR techniques can be classified into three categories [77] as image based rendering, rendering with explicit geometry and depth image based rendering. In image based rendering, virtual views are generated among high number of images through interpolation of light fields or rays that are the bases for representing images. The well known methods in this group are light field [78] and lumigraph [79] rendering. In [78], virtual views are rendered through interpolation of
86
rays sampling the space uniformly, whereas for lumigraph, sampling of rays is non-uniform. These approaches require densely recorded data which is not feasible; hence usage of this rendering technique is limited to specific applications such as computational photography and microscopy. The second group exploits the existing geometry in terms of camera locations; i.e., external calibration parameters of the cameras are available. Then, rendering is achieved by linear combination of the source images through epipolar or tri-focal relations [80] between the cameras. Similar to image based rendering, this approach is also based on the interpolation of limited number of views without any 3D structural information of the scene. Due to lower number of cameras, in this approach, rendering performance is low and only sufficient for simple applications such as localization in surveillance cameras. In the last group, rendering with explicit geometry is achieved by depth image based rendering (DIBR) [81]-[102], in which 3D model of the scene is required to map a collection of images for a desired camera location. For this purpose, 3D information should be available through various formats [2] such as view dependent depth maps, layered depth images or triangular mesh models extracted through preprocessing of mono, stereo or multi-view data. VVR is achieved by warping 3D model to the desired viewing location. Utilization of 3D information in DIBR increases the quality and flexibility of the rendering. There are two main constraints during the conversion of stereo video to multi-view video: input 3D format has limited number of views (typically only left and right views) and visually pleasing VVR is required. As mentioned before, image based rendering methods require higher number of images and the precision is limited to the sampling of the scene by the cameras. Thus, DIBR can be argued as the best solution among the three aforementioned alternatives for the specific problem of stereo to multi-view conversion. In the next section, a literature survey is given on VVR techniques that is followed by the motivation behind the development of a VVR algorithm in the scope of this dissertation. The proposed rendering technique is presented in Section 4.4 whose performance is validated with intensive experiments in Section 4.5. Finally, Section 4.6 is devoted to conclusive remarks.
4.1
Related Work
The scenario of DIBR for stereo-to-multi-view conversion problem is illustrated in Figure 4.2, where Left and Right views are the captured original images by a stereo camera system and the remaining is the desired virtual views. There are two cases for VVR depending on
87
the locations of virtual views with respect to original views; if virtual views are within the baseline, rendering can be considered as the interpolation of actual views while for the virtual views outside baseline, rendering is defined as extrapolation. Thus, for stereo to multi-view conversion, interpolation and extrapolation of reference views are utilized to synthesize arbitrary views in a stereo camera setup. For this scenario, 3D models are the disparity maps of left and right views which can be extracted by stereo matching as explained in the previous chapter. Having view dependent disparity maps, there are two fundamental approaches for DIBR, namely forward mapping and inverse mapping as shown in Figure 4.3. In forward mapping [81]-[82], view synthesis is achieved by utilizing depth and texture data of only one of the images, left or right view. The texture is projected to the desired location through the depth information; which can be found by constructing meshes and triangulation [83] or by 3D warping [84]. During such a warping, visibility of regions is also considered by depth ordering which depends on the viewing position. Due to the occlusions and quantization issues, forward warping does not provide a one-to-one mapping between the source and target view; hence, some holes exist in the final output. In order to achieve visually pleasing rendering, these holes can be filled through pre-processing [85]-[91] on disparity maps or inpainting [92]-[95] methods over the synthesized views. Since the synthesis is achieved from one image, there are occluded regions with no available texture. Therefore, filling techniques, in general, concentrate on providing consistent and visually pleasing completion of those missing regions. In order to minimize amount of occluded regions, image source closer to the desired viewing location is selected for rendering. The advantage of forward mapping is the constant 3D structure independent of the virtual view location; saving computation with a sacrifice of rendering quality especially at occluded regions.
Figure 4.2: Virtual view rendering scenario for stereo camera systems.
88
Figure 4.3: Forward warping utilizes single source camera, while both views are exploited for inverse warping.
The other approach is inverse mapping for which both views are utilized with their disparity maps [96]-[104]. Initially, 3D structure (disparity map) of the virtual view is constructed by warping and merging disparity maps of left and right views to the desired location. At that point, some post-processing operations can be required on the merged disparity map to remove unreliable assignments and fill the occluded regions. Once 3D structure of the virtual view is settled, texture data is transferred from the visible regions of the stereo view by inverse warping. For the interpolation case, in which the rendered view is between two cameras as in Figure 4.2, most of the regions are observed by at least one of the cameras. The regions which are not observed by any of the cameras are denoted as disoccluded regions and these holes should be filled by inpainting methods, commonly utilized for forward mapping. It is important to note that during interpolation; disoccluded area is minimal compared to forward warping. Hence, completion for inverse mapping is easier and involves fewer artifacts. On the other hand, extrapolation, in which rendered views are out of the original stereo baseline, is problematic due to occlusions. The area of disoccluded regions increases as the virtual camera gets further from the input camera configuration that is a common fact for forward warping as well. For this case, the inpainting and hole filling methods become more important for improving the visual quality of the rendered views. Therefore, inverse warping has an obvious advantage over forward mapping especially for the interpolation case, for which stereo data utilization is maximized and superior occlusion handling is observed. For the extrapolation case, however, both approaches share the problem of missing data
89
completion. Therefore, inverse warping, which is the most endeavored technique for DIBR algorithms with higher visual quality, is the preferred approach in this study. The fundamental steps for the inverse warping method are illustrated in Figure 4.4, in which the dashed blocks are the post and pre-processing units, and the other blocks are the common warping and selection units. During warping, merging and texture selection steps, most of the algorithms in literature follow the same instructions. In the warping step, shifting of pixels along the epipolar line between source and target camera locations is performed; in stereo case, the epipolar line is on the horizontal axis. Once the two disparity maps of left and right views are warped to the desired location, merging is performed by depth ordering over mapped disparity values for each pixel. Texture selection is also achieved by assigning color values of the visible source pixels. Some techniques, such as position dependent blending [97] or weighted summation of texture values from stereo pairs, are exploited, as long as the regions are observed by both of the cameras. An alternative technique for texture selection is to copy all visible pixels from one of the cameras and fill the missing parts from the other camera [94].
Figure 4.4: Fundamental steps of virtual view rendering.
90
4.2
Motivation There are four fundamental problems to be solved for DIBR in order to obtain high
quality virtual views independent of the warping technique. The first problem is blank pixels and holes due to sampling of 3D scene and quantization; such problems can be observed in Figure 4.5. In general, holes are one pixel in width that makes the problem easier; and a common solution is the texture copying [94] from neighboring available pixels. The second problem is the contour artifacts occurring at highly textured depth discontinuities as illustrated in Figure 4.6. The foreground texture may be observed as a thin contour at the background. The solution to this problem relies on various post-processing operations over the synthesized view or pre-processing over the disparity maps. The third problem is the occluded and disoccluded regions, as shown in Figure 4.7, and mentioned previously. The missing information should be handled somehow, when a region in the rendered view is not observed by any original data (left and right views). Inpainting methods might cope with disocclusion regions. The final problem is the erroneous rendering due to imperfect disparity maps; a typical example is presented in Figure 4.8.
Figure 4.5: A typical rendering result involving holes due to depth discontinuity and occlusion.
91
Figure 4.6: Texture copying between foreground and background regions result in contours that decrease visual quality [103].
Figure 4.7: The black labeled pixels indicate occluded and disoccluded regions between stereo pair.
Figure 4.8: Erroneous disparity map and the corresponding rendering result. Note the degradation in the overlay text.
92
DIBR methods differentiate depending on post and pre-processing approaches for handling the fundamental problems of contour artifacts, occlusion handling and erroneous rendering. Thus, there is a variety of methods starting from simplest forms for real-time applications to very complex algorithms with off-line processing capability. One of the common solutions for contour artifacts and occlusion handling is the pre-filtering of disparity maps, such that size of the occluded regions is decreased by smoother disparity maps. This aim can simply be achieved by Gaussian filters [82]; however, smoothing the entire disparity map introduces geometric distortions. Over-smoothing is handled by edgeaware filters [85]-[88], while crisp depth transitions are preserved in case of sharp color changes; however, an extra occlusion handling step is required after such filters. This requirement is overcome by a non-symmetric bilateral filtering technique proposed in [89], so that depth discontinuities in opening regions (where new pixels from the background are visible) is smoothed to decrease the occlusion area, whereas preserved in the other regions. The edge-preserving filters, although decrease occlusion area, still result in geometric distortions especially observed as broken and curved vertical lines. Recently in [90], an adaptive edge-oriented smoothing is proposed with some non-geometric distortion. This method provides visually pleasing virtual views compared to the other filtering approaches with decreased geometric distortion. As the baseline distance between the virtual and original cameras is increased, synthesis after pre-filtering of disparity maps involves severe distortions around occlusion boundaries. When the virtual view is between left and right cameras, it is clear that the amount of occlusion is limited and almost each pixel is visible at least by one of the reference cameras. Hence, exploiting pre-filtering techniques for interpolation is not a good choice; however, such methods are more appropriate for extrapolation. In recent years, inpainting techniques have been popular to complete missing or distorted pixels in the images. The same idea is also extended for occlusion handling in [92] and [93] where exemplar-based inpainting is performed for the missing patches through compensation from local texture. Although providing high quality completion, these methods are quite complex and require off-line processing to match patches among the entire image. Actually, inpainting is typically exploited to complete large missing regions and remove objects in the images, in which the problem is more complicated than occlusion handling. Therefore, they are not applicable to fast processing systems in consumer electronics. In [94] and [95], however, inpainting is adapted to fill the occluded regions by utilizing depth priors during local texture averaging with reduced computational complexity.
93
In [96]-[102], contour artifacts due to depth bleeding of boundary pixels are removed by local filtering and morphological operations to improve visual quality. This problem is solved by separately warping background-foreground pixels. The occlusion handling in [103]-[104] is achieved by sprite background modeling of a scene captured from static cameras. The background depth and texture model is extended in temporal domain, and for an arbitrary view rendering, the occluded regions are filled by the estimated background model. This approach provides reliable completion at occluded regions; however static camera assumption is not realistic for wide range of stereo content. Considering the problem of stereo to multi-view conversion addressed in this dissertation, variation for stereo video is quite large, and exploiting model based solutions for occlusion handling covers only limited data captured by static cameras. In that manner, the solution should be completion with visually pleasing synthesis rather than searching the actual texture. Such a completion and occlusion handling is achieved in [105] by a multi-resolution approach for hole filling. The initial warped texture is iteratively down-sampled till no holes are observed in the view, then at each higher resolution, the holes are filled by interpolation at the lower resolution version. This process is iterated until the estimated image has no holes. The method proposed in [105] provides occluded regions to be filled by low pass filtering among neighboring pixels at different resolutions. The hierarchical hole filling increases robustness of rendering method against disparity map errors as well as results in virtual views free of geometric distortion. The method is actually applied for forward mapping with one texture and one depth map; however the extension to inverse mapping is trivial. The disparity maps, as the view dependent 3D representations for DIBR, may involve errors due to imperfect passive stereo matching based on color similarities. As a result, VVR algorithms could be seriously affected from these errors resulting in visually disturbing views, as illustrated in Figure 4.8. So far, the methods summarized above do not consider such errors and assume that provided disparity maps are quite reliable. However, there should be a feedback mechanism to detect and refine possible erroneous regions. Therefore the authors in [106] introduced a simple mechanism to detect errors in the disparity maps and refine virtual views through low pass filter and morphological operations. In this technique, disparity correction and remapping are not considered; therefore feedback mechanism provides incremental improvement over synthesized views with additional post processing.
94
4.3
Proposed Approach
View synthesis algorithms should have all of the steps described previously to achieve high quality virtual views. On the other hand, imperfections in disparity maps should also be considered by exploiting a feedback mechanism to correct disparities and render visually pleasing views. Moreover, real-time capability introduces a great challenge on complex postprocessing methods that provide high quality rendering. The methods should have least data dependency (iteration) and be available for scan order processing [99]. Regarding these constraints, in this study, the general work flow of DIBR methods is modified by a disparity correction mechanism with two texture warps between left and right views, as illustrated in Figure 4.9. The possible errors in disparity maps are detected and corrected to feed the traditional DIBR flow. The main components exploited in this work can be grouped into five categories as; disparity refinement, pre-processing of disparity maps, virtual view depth composition, texture selection and hole filling. 4.3.1
Disparity Map Refinement
Disparity map estimation is a matching procedure between left and right images based on color and texture similarities. Hence, the extracted depth maps are not perfect and might involve errors due to various reasons such as image noise, reflections, repeated structures, foreshortening, left-right color imbalances, etc. During VVR, these errors might yield unobservable artifacts as well as serious degradations. Especially errors at overlay text regions are clearly visible and decrease perceptual quality as illustrated in Figure 4.8. For this type of artifacts, one solution is to detect text regions and apply special filtering to assign the same depth variation among the letters; however, this would be a tailored solution dedicated to only text regions and not cover general type of errors. Instead, in the proposed refinement step, detection of possible erroneous regions is achieved by warping left and right pairs to each other by the help of the provided disparity maps. Pixels are shifted by the amount of disparity to the other view, and texture of visible pixels is copied to the corresponding pixel locations. A typical result is illustrated in the first row of Figure 4.10, for the "Moebius" stereo sequence from Middlebury database. The texture of the left image is mapped onto right view through disparity map in Figure 4.10.a which has errors around the text region. The warped view has black holes due to depth discontinuities and occlusions; at that stage these pixels are not taken into consideration. The rendered view is compared to the original view and pixels having RGB difference larger than a threshold (TRGB) are
95
detected, Figure 4.10.c. Disparity values of these pixels and their correspondences in the other view are labeled as unreliable by assigning “1”. Then, a dilation operation is performed on the disparity map to include neighboring pixels that could be missed due to utilization of hard threshold in the detection. The result of detection is given in Figure 4.10.d, where black pixels indicate erroneous regions. These operations are performed for left and right pairs independently.
Figure 4.9: Proposed VVR scheme with additional disparity refinement feedback mechanism.
96
Figure 4.10: (a) Initial disparity map, (b) warped right view from the left view according to (a), (c) the erroneous regions in the reconstructed right image, (d) detected erroneous disparity assignments.
The next step is re-calculation of disparity values for the erroneous regions. This goal is achieved by the proposed local stereo matching approach in Chapter 3. The cost values corresponding to disparity candidates are calculated for the detected pixels through, 3
CdSAD ( x, y ) I left ( x, y, i ) I Right ( x d , y, i ) , i 1
C
ERROR d
( x, y ) Eleft ( x, y ) ERight ( x d , y ) ,
(4.1)
Cd ( x, y ) .CdSAD ( x, y ) (1 )CdERROR ( x, y ) , where Ileft and IRight are the left and right color images, respectively; E corresponds to the error map extracted in the previous step. The motivation behind such a cost function is that erroneous pixels should match to the erroneous pixels in the other view with high color similarity; in addition, matching to a reliable pixel is penalized. The pixel-wise cost values can be aggregated by a simple (NxN) box filter to obtain higher confidence; this is an optional step, since the detected regions also restrict possible matches and outliers. It is important to note that re-calculation is exploited for the unreliable pixels only; therefore, the computational complexity introduced by this approach is quite low. WTA optimization is conducted to assign proper disparity values to the corresponding pixels. Finally, left-right
97
consistency of the updated disparities is provided by a simple cross check and an occlusion handling methodology. Typical refinement results are illustrated in Figure 4.11; improvement over disparity maps after such a feedback mechanism which affects the rendering quality is obvious.
Figure 4.11: First row: initial disparity maps, Second row: detected erroneous regions, Last row: the refined disparity maps
4.3.2
Pre-process of Disparity Maps
In this study, pre-processing is required to remove ghosting and contour artifacts due to disparity leakage from foreground to background as a result of estimation processes. Considering the availability of stereo content, especially for interpolation, the occlusion problem can be minimized by exploiting both images to compile missing parts. In that
98
manner, edge-aware filters that decrease the occlusion area are not considered since they introduce additional geometric distortions. The problem of disparity leakage can be solved by extending boundaries of foreground objects. Initially, 3x3 median filtering is performed on the disparity maps to remove spike noise and tiny irregularities which could be enhanced during foreground enlargement. Then, as illustrated in Figure 4.12, a dilation operation over disparity map with privilege of foreground levels according to,
D( x, y) max
D(i, j)
( i , j )N ( x , y )
,
(4.2)
provides the desired enlargement. Throughout this study, dilation is executed over 5x5 support window, N(x,y), in order to prevent possible halo around object boundaries.
Figure 4.12: Foreground enlargement prevents ghosting artifacts.
4.3.3
Virtual View Depth Composition
In inverse mapping, depth map that belongs to the desired virtual view is constructed before the texture warping in order to handle occlusions in depth domain that is easier compared to the texture domain. The pre-processed disparity maps are warped (shifted) to the desired location according to,
Dvir ( x' , y) max DC ( x, y) xA
s.t. A x; x DC ( x, y) x'
,
(4.3)
where Dvir is the disparity map of virtual view, DC is the disparity map of the closer source view and x’ is the target pixel index in the virtual view. During the warping, source view (left or right) closer to the virtual camera position has the priority, in order to minimize the occluded area. At the warping stage, visibility of the pixels is considered by assigning the
99
largest disparity to the target pixel, x’, among alternative mappings according to a Z-buffer. After warping of the prior view, there are unassigned, blank pixels, x' E due to depth discontinuities. These regions are completed by warping the other (secondary) disparity map as,
Dvir ( x' , y) max DF ( x, y) s.t. B x; x DF ( x, y) x' , x' E , xB
(4.4)
where DF is the disparity map of the distant source view, E is the set of blank pixels in the virtual view. In certain cases, there may be disoccluded pixels which are not observed by any of the left or right camera, hence unassigned to a specific disparity. These cases are handled by fusing neighboring background disparities to those regions, assuming that disoccluded regions mostly belong to background. When the virtual view is out of the baseline, it is clear that the secondary image has limited, almost no, extra information; therefore the area of the occluded regions is larger compared to the interpolation case. However, the hole filling approach which fuses local background disparity to blank regions is the same for both interpolation and extrapolation. Steps of the virtual view disparity map construction during interpolation are illustrated in Figure 4.13, where left view is considered to be the primary source. The missing pixels after the initial warp are filled by the right view, and the disoccluded pixels are assigned to proper disparity values through occlusion handling.
4.3.4
Texture Selection
Once disparity map of the virtual view is obtained, the next step is the assignment of a proper texture. As in the previous section, texture selection starts from the primary source image which is closer to the virtual camera location. Each pixel in the virtual view is mapped to the source according to disparity values, and the corresponding RGB values are gathered as long as visibility is provided. Due to occlusions, some pixels are invisible through the primary source hence remain unassigned; for those pixels, a mapping to the secondary source is performed. Proper RGB values are gathered under visibility constraint. At that point, there is an important case as illustrated in Figure 4.14, when there are color imbalances between left and right source images; there might be patches with unexpected color variation especially over un-textured regions. In Figure 4.14, this effect is observed in the sky as indicated by circles. Due to inconsistent contrast levels of the images, unassigned regions among the sky during the first mapping are filled by dissimilar blue level in the
100
Figure 4.13: Virtual view disparity map construction from left and right maps.
secondary mapping. Such an effect introduces disturbance and artifacts in the virtual view that is not a desired case. Therefore, color equalization of left and right views is required before texture selection to handle patch formation with different contrast. Stereo color calibration is achieved by a modified version of histogram based equalization introduced in [107]. The patch artifacts in the rendered view are totally removed after color calibration, as observed in Figure 4.14. Throughout this study, linear interpolation of RGB values gathered from left and right views for the pixels visible in both cameras is avoided since such an interpolation may decrease sharpness of the object boundaries as well as distort repeated structures. Therefore, the preferred scheme is to obtain the texture information from the closest view then complete the missing regions from the other view, if possible.
101
Figure 4.14: Color equalization between left-right views is vital for VVR.
4.3.5
Hole Completion
Although, each pixel in virtual view is assigned to a disparity value, there might be missing texture, if visibility is not met from either source views. Moreover, considering the extrapolation case in which information is transferred from one direction, there will certainly be missing texture due to occlusions. As the virtual camera gets further, area of the missing region increases almost linearly. For the interpolation scenario, however, the area will be limited to a certain extend due to increased visibility. In Figure 4.15, holes are illustrated for interpolation and extrapolation of Art image sequence; it is obvious that missing area is larger for virtual views out of baseline.
102
Figure 4.15: Interpolation: missing texture is due to disoccluded pixels, extrapolation: missing texture is due to occlusion and disocclusion.
Hole filling is the most critical step of VVR as long as disparity maps are accurate enough. The importance is higher for extrapolation since missing regions could be very large depending on the virtual view location. Hence, these areas should be filled with appropriate texture which is actually not available, in order to achieve visually pleasing completion. As mentioned previously, there are various inpainting methods [92]-[95]; however they are quite complex for real time systems. The hierarchical approach proposed in [105] is efficient and fast, on the other hand introduces over smoothing artifacts for the missing regions which decreases visual quality. In this dissertation, a hole filling strategy based on the modified version of permeability filtering [108]-[109], is proposed. In its original form, the filtering provides successive texture (RGB) transition along horizontal and vertical directions weighted by edge measure of each pixel in the corresponding direction. This idea is applied for texture transfer from reliable pixels to missing regions by an updated edge measure. In order to define permeability weights, indicating the transfer rates among the corresponding direction, filledunfilled condition of pixels and the disparity distribution are utilized in addition to RGB similarities. Permeability weight assignment for filled and reliable pixels is performed over RGB similarities with neighboring pixels in four fundamental directions as,
103
x, y min( e( R / ) , e( G / ) , e( B / ) )
.
(4.5)
The unfilled pixels do not have valid RGB values; therefore, the relation in (4.5) cannot be applied. On the other hand, these pixels have been assigned to proper disparity values in the virtual view depth composition stage. Hence, disparity values can be utilized to determine transition rates in four directions. As a result, reliability diffusion is forced to be provided from the same disparity levels (depth priority); i.e., missing regions which are actually at local backgrounds are completed through neighboring background pixels. The permeability weight assigned among disparity maps is achieved according to
1
if Dvir ( x, y ) Dvir ( x' , y ' ) TD
0
elsewhere
x, y
,
(4.6)
where D corresponds to disparity map of the virtual view, (x', y') is the closest neighboring pixel in the corresponding direction and TD is the disparity similarity threshold. A binary operation is utilized to assign permeability weights for the sake of simplicity. Once the weights are calculated for each pixel, the next step is the successive weighted summation of RGB values along horizontal and vertical directions independently. In [108][109], the transfer is performed consecutively, such that the vertical pass is applied over horizontally aggregated values. For the hole filling however, aggregation is executed independently to prevent over smoothing and constant color assignment for the missing regions. Filling direction of the holes depends on the location and geometric characteristics of the region. In Figure 15, several possibilities are illustrated with various filling directions; in Figure15.a and Figure15.c, the red pixel should be filled from right to left according to fuse information from background; on the other hand, for Figure15.b, the filling direction should be from top to bottom in order to preserve edge continuum. In Figure15.d, the red pixel belongs to a disoccluded region; therefore, filling can be performed by fusing information from four directions. Thus, to provide filling among proper directions, horizontal and vertical filtering should be performed independently. In that manner, update rule for successive weighted aggregation among horizontal axis is given as,
RGBLtoR ( x) RGB ( x) R ( x 1).RGBLtoR ( x 1) x 1 width
(4.7)
RGBRtoL ( x) RGB ( x) L ( x 1).RGBRtoL ( x 1) x width 1
(4.8)
104
where two reverse scanning, left-to-right and right-to-left, are conducted to obtain aggregated color vectors in the desired directions, RGBLtoR and RGBRtoL. The final horizontal aggregation value is obtained by the summation of RGBLtoR and RGBRtoL. SWS is also performed independently in vertical direction to provide aggregation of reliable texture. Then a normalization step is required to map aggregated values to proper intensity levels, i.e., 8-bit. As introduced in Chapter 2, normalization is provided according to,
RGB
FPer RGB FPer (1)
,
(4.9)
where FPer is the proposed permeability filter in, 1 is the data consisting of ones for each pixel and RGB are the normalized RGB values after permeability filtering.
Figure 4.16: The direction of texture transfer depends on local geometry characteristics (disparity similarity) of the un-filled pixels.
The successive weighted summation and normalization provide two RGB candidates for each unfilled pixel, one from horizontal and one from vertical direction. At that point, there are three possible cases for the un-filled pixels, assignment of horizontally transferred texture, vertically transferred texture or their linear combination. These possibilities could be extended by additional diagonal axes with an increase in computational complexity; however throughout this study, this selection remains as an option. Considering the computational complexity of hole filling stage so far, it is clear that permeability filtering is an efficient way
105
to determine possible RGB values by two divisions, eight multiplications and 12 additions per pixel. Moreover, separate filtering in horizontal and vertical axes enables parallelization which is an important feature for GPU implementation within this study. The next step of this stage is the determination of trusted direction for the un-filled pixels. Each pixel is analyzed in four fundamental directions by checking the first pixel with valid texture assignment and same disparity. If the spatial distance between the analyzed and the detected pixel is small compared to a threshold, then this direction is assumed to be trustable. The idea is illustrated in Figure 4.17, for four different cases the detected directions are given with green in the corresponding disparity maps. The blue colored directions are eliminated due to two fundamental conditions, the length of that arm is too long or depth discontinuity breaks the ray. According to the detection results in Figure 4.17, for (a) and (c) the horizontal transfer is proper, whereas for (b) and (d) linear combination of horizontal and vertical transfer should be preferred. For the case given in Figure 4.17.b, exploiting only vertical transfer would provide visually better filling, since there is a vertical edge continuation. In order to handle such cases, edge and texture comparison is required between detected neighboring reliable pixels. This option is considered as a future work to further refine rendering as long as the current approach has insufficient quality.
Figure 4.17: Trusted direction (green) detection under various cases.
A typical example of hole filling is illustrated in Figure 4.18, in which the missing regions are due to extrapolation. The proposed approach provides visually non-disturbing
106
completion and avoids crisp hole filling which could introduce broken lines, unexpected edges, etc. In certain cases where background has constant color variation, there could be leakage from the foreground that decreases visual quality unless depth constraints in equation 4.6 are not utilized. As illustrated in Figure 4.19, depth priors during permeability calculation prevent foreground leakage, Figure 4.19.a, during hole filling and provide visually pleasing virtual views.
Figure 4.18: (a), (b) Missing regions during extrapolation (c), (d) after hole completion.
Figure 4.19: (a) Color based hole filling, (b) color+depth based hole filling
107
4.4
Experimental Results
In this section, the results of the experiments that are conducted in three categories to evaluate performance of the proposed VVR methodology are presented. Comparison against state of the art under various static and temporal scenes is provided in the first set of experiments. The effects of algorithmic steps and parameters are analyzed in the second stage involving disparity map quality, hole filling and baseline between stereo views. Finally, the results of the overall stereo to multi-view conversion algorithm are given for the sake of completeness. In order to evaluate the rendering capability of the proposed VVR scheme, multi-view dataset from Middlebury online stereo benchmark [111] and multi-view videos (MVV) provided by HHI [112], GIST [113] and Nagoya University [114] for MPEG 3DV/FTV standardization efforts are utilized. In Middlebury multi-view set, there are around 30 different scenes with various local-global texture characteristics that are captured by horizontally aligned seven cameras. Configuration of the cameras is appropriate for the ultimate aim of this study, stereo to multi-view conversion. Hence, two of these cameras are considered as the reference, whereas all the other views are considered to be virtual views to be rendered; then a comparison between the original and rendered versions of the nonreference views is provided. Although, ground truth disparity values are available for two cameras (1st and 5th), throughout this study, estimated disparity maps are also exploited to interpret effect of stereo matching quality. On the other hand, for multi-view videos provided by [112]-[114], performance on interpolation is further investigated by rendering intermediate views between cameras having two baseline distances. For these videos, ground truth disparity maps are not available; therefore, disparity maps estimated by MPEG 3DV/FTV Depth Estimation Reference Software 5.0 (DERS) [44] are exploited to provide a fair comparison between VVR tools. In DERS, disparity maps are estimated by matching over multiple views through a global optimization which is the common convention for MPEG/FTV standardization. In addition to DERS depth maps, the proposed stereo matching algorithm in Chapter 3 is also exploited on the corresponding MVV to observe the stereo to multi-view conversion quality in the overall proposed system. Throughout this dissertation, quality of the rendered views is measured by four different metrics, which are peak-signal-to-noise ratio (PSNR), Structure Similarity Index (SSIM) [115], Multi-resolution Structure Similarity Index (MSSIM) [116] and Information Weighted Structure Similarity Index (IW-SSIM) [117]. It has been demonstrated by [115] that SSIM
108
provides superior human perception modeling for reference based quality measure compared to PSNR. The extension of SSIM for scale invariance is provided in [116] by introducing MSSIM. The perceptual modeling of SSIM is further improved by IW-SSIM [117], where structural similarity is weighted according to saliency map that models visual attention for the distorted views. These metrics are designed to measure effect of artifacts on the reference view due to coding, noise and illumination (contrast) changes. As stated in [118], artifacts introduced during VVR have different characteristics that require special attention. In that manner, the method in [118] proposes a novel approach to measure visual quality of rendered views, in which a bias is given to erroneous regions and perfectly reconstructed surfaces are not considered during visual quality calculation. Hence, as proposed in [118], MSSIM and IW-SSIM measures are modified in this study to have higher correlation with human perception for VVR. It is also important to note that, publicly available source codes (MATLAB) of these metrics are utilized during the evaluation of rendering quality.
4.4.1
Comparison with State-of-the-Art
In this section, proposed approach is compared to View Synthesis Reference Software 3.5 (VSRS 3.5) [98] which is utilized for MPEG 3DV/FTV experiments and another recent study [110] that presents extensive results for interpolation among all Middlebury multi-view set. Both approaches exploit DIBR to fuse texture from two reference views through view dependent disparity maps. The comparison against VSRS is conducted on the multi-view videos with provided configuration setup. On the other hand, the experiments on Middlebury data set are devoted to compare the proposed approach with both [110] and VSRS. It is worth to mention that, virtual views of state-of-the-art methods are provided by the corresponding studies with no additional process that could introduce imperfections. Besides, there is free access to VSRS and DERS by the given configuration files that enables VVR for various scenarios without any optimization.
4.4.1.1 Multi-view Dynamic Scenes
In this section, detailed comparison is provided over three well known MVV sequences, Cafe, Book Arrival and Newspaper, involving 200, 100 and 300, frames respectively. The experiments are conducted according to two scenarios as illustrated in Figure 4.20; in the
109
first scenario the center view is synthesized through left and right pairs by interpolation. In the second case, center view is rendered through only the left reference view simulating the extrapolation scenario where larger occluded regions exist. During the experiments, depth maps provided by DERS are utilized and VSRS results are obtained by executing the provided software with no additional tuning. The disparity maps are estimated by matching over multiple views that is the common convention for MPEG/FTV standardization. In the following section, additional experiments are also conducted by changing the disparity estimation tool, such that stereo matching is performed instead of multi-view matching which is a more realistic scenario for stereo-to-multi-view conversion. It is important to note that, ground truth center view is also available for all videos, enabling objective evaluation of the VVR tools. The average error measures are listed for the proposed and VSRS VVR tools, averaged over all frames in Table 4.1, Table 4.2 and Table 4.3 respectively.
Figure 4.20: Interpolation and extrapolation scenarios to compare proposed VVR and VSRS.
110
Table 4.1: Rendering quality comparison over Cafe sequence between the proposed approach and VSRS. CAFE Interpolation/Extrapolation
VSRS [98]
Proposed
PSNR
31.9 / 31.3
32.1 / 31.2
SSIM
0.93 / 0.91
0.92 / 0.92
M SSIM
0.93 / 0.89
0.93 / 0.91
IW-SSIM
0.94 / 0.93
0.94 / 0.94
For Café and Book Arrival sequences, both VVR techniques yield comparable results with alternating superiority based on the quality metric. In certain metrics, VSRS has slightly better performance than the proposed approach, while it is the opposite for the other metrics. Especially for IW-SSIM, having high correlation with human perception, the measured errors are close to each other with almost % 95-98 perfect reconstruction of the virtual views. This indicates the high performance of the proposed approach, being competitive with the state-of-the-art. On the other hand, proposed approach yields better visual quality for the Newspaper sequence in both interpolation and extrapolation scenarios. This is mainly due to the stereo color calibration which balances illumination imperfections between the left and right color views. In VSRS, this tool which generate visual quality degradation to a certain extend is not exploited. It is also important to note that, SSIM, MSSIM and IW-SSIM are illumination independent metrics; however, decrease in these measures are also obvious for VVR among color-wise unbalanced stereo video. This proves the importance of color calibration step for perceptually pleasing virtual views.
111
Table 4.2: Rendering quality comparison over Book Arrival sequence between the proposed approach and VSRS. BOOK ARRIVAL Interpolation/Extrapolation
VSRS [98]
Proposed
PSNR
34.7 / 30.8
34.7 / 30.9
SSIM
0.90 / 0.87
0.92 / 0.88
M SSIM
0.97 / 0.95
0.98 / 0.94
IW-SSIM
0.98 / 0.96
0.98 / 0.97
Table 4.3: Rendering quality comparison over Newspaper sequence between the proposed approach and VSRS. NEWSPAPER Interpolation/Extrapolation
VSRS [98]
Proposed
PSNR
28.9 / 26.4
31.7 / 27.8
SSIM
0.90 / 0.89
0.93 / 0.91
M SSIM
0.95 / 0.80
0.97 / 0.85
IW-SSIM
0.95 / 0.93
0.97 / 0.95
The frame-wise quality measures of the VVR tools are further illustrated in Figure 4.21 to Figure 4.26. Especially, for the extrapolation scenario in Café sequence, the proposed hole filling procedure yields slightly better quality compared to VSRS; while VSRS outperforms proposed approach for the same scenario in Book Arrival sequence. Apart from objective quality measures, typical rendering results and the corresponding errors maps are illustrated in Figure 4.27 to Figure 4.32. The error map illustrate pixels having intensity difference larger than 10 levels for images with maximum intensity level of 255, ∆I>10. According to the visual interpretation, it is obvious that proposed approach has competitive performance.
112
Figure 4.21: Frame-wise quality measures for interpolation among Café sequence.
Figure 4.22: Frame-wise quality measures for extrapolation among Café sequence.
113
Figure 4.23: Frame-wise quality measures for interpolation among Book Arrival sequence.
Figure 4.24: Frame-wise quality measures for extrapolation among Book Arrival sequence.
114
Figure 4.25: Frame-wise quality measures for interpolation among Newspaper sequence.
Figure 4.26: Frame-wise quality measures for extrapolation among Newspaper sequence.
115
Figure 4.27: Two virtual frames (3rd and 85th) from Cafe sequence rendered by (a) VSRS [98] and (b) proposed method
Figure 4.28: Erroneous regions having intensity difference larger than 10 levels for (a) VSRS and (b) proposed rendering.
116
Figure 4.29: Two virtual frames (33th and 86th) from Book Arrival sequence rendered by (a) VSRS [98] and (b) Proposed methods
Figure 4.30: Erroneous regions having intensity difference larger than 10 levels for (a) VSRS and (b) proposed rendering
117
Figure 4.31: Two virtual frames (1st and 215th) from Newspaper sequence rendered by (a) VSRS [98] and (b) Proposed methods
Figure 4.32: Erroneous regions having intensity difference larger than 10 levels for (a) VSRS and (b) proposed rendering
118
It is a common observation that hole filling requirement for interpolation scenario is minimal compared to extrapolation due to effective utilization of both left and right views. On the other hand, the area of missing regions is increased for extrapolation scenario that influences the role of hole filling. In Figure 4.33 to Figure 4.35, typical examples of the extrapolation performance of VSRS and the proposed algorithm are illustrated. In Figure 4.33.c and Figure 4.33.d, VSRS copies the foreground colors to the missing regions that degrade the natural looking, whereas proposed approach ignores foreground texture and transfers background information to the missing regions that provide visually pleasing completion. In Figure 4.34.c and Figure 4.34.d, both approaches copy some portion of the foreground; however, proposed algorithm yields slightly better background copying. The superior performance of the proposed VVR is more obvious in Figure 4.35.c and Figure 4.35.d, in which filling of missing regions is achieved with higher correlation w.r.t the ground truth texture. Hence, VSRS extrapolation and hole filling performance is visually outperformed by the proposed approach, while competitive quality is provided according to the objective metrics.
Figure 4.33: Extrapolation results for the Café sequence (a) VSRS, (b) proposed algorithm, (c) and (d) enlarged hole filling regions with ground truth, VSRS and proposed algorithm respectively.
119
Figure 4.34: Extrapolation results for the Book Arrival sequence (a) VSRS, (b) proposed algorithm, (c) and (d) enlarged hole filling regions with ground truth, VSRS and proposed algorithm respectively.
Figure 4.35: Extrapolation results for the Newspaper sequence (a) VSRS, (b) proposed algorithm, (c) and (d) enlarged hole filling regions with ground truth, VSRS and proposed algorithm respectively.
120
4.4.1.2 Multi-view Static Scenes
Apart from comparison with VSRS among well known MVVs, the proposed approach is further compared to a recent study [110], while special attention is devoted to the Middlebury multi-view data set. Hence, additional comparison through the publicly available rendering results of [110] provides a general performance overview for the proposed algorithm. For this purpose, the experimental setup illustrated in Figure 4.36 is exploited in which, virtual views of the 2nd, 3rd and 4th cameras are obtained through ground truth disparity maps and color views of the 1st and 5th cameras. The rendering quality measures are listed in Table 4.4, where the average values are calculated over 30 different scenes. On the average, the proposed approach yields higher average PSNR (around 2 dB), SSIM (0.025), MSSIM (0.07) and almost similar IW-SSIM measure compared to [110]. Besides, VSRS is also outperformed by the presented approach indicating superiority of the proposed VVR technique. Improvement over objective metrics is further verified on the visual results illustrated in Figure 4.37. In occluded regions, as circled, proposed approach maximizes the utilization of left and right views texture as well as compiles the missing texture with higher accuracy. The erroneous regions are also illustrated in Figure 4.38, where dark pixels correspond to intensity difference larger than 10 levels for images with maximum intensity level of 255. According to the overall performance, proposed approach yields visually pleasing rendering results with high MSSIM and IW-SSIM measures that have high correlation with the subjective evaluations.
Figure 4.36: Interpolation scenario for Middlebury MVV sequence.
121
Table 4.4: Rendering quality comparison over Middlebury sequences between the proposed approach, DIBR [110] and VSRS [98]. M IDDLEBURY
DIBR [110]
VSRS [98]
Proposed
PSNR
31.2
31.7
33.5
SSIM
0.92
0.94
0.94
M SSIM
0.89
0.94
0.96
IW-SSIM
0.96
0.96
0.96
Figure 4.37: (a) Proposed rendering, (b) rendering via [110], (c) VSRS rendering
122
Figure 4.38: The error maps (∆I>10) for the rendered views via (a) proposed, (b) [110] and (c) VSRS. 4.4.2
Analysis of Algorithmic Subblocks
In this section, the proposed algorithm is analyzed in detail by observing the performance of hole filling and depth refinement steps, effect of disparity estimation on rendering quality as well as dependency on baseline between stereo pair and the virtual camera locations. During the analysis, multi-view data provided by the Middlebury stereo benchmark [111] is utilized with scenes involving various complexities compared to the MVV sequences, Café, Book Arrival and Newspaper. Moreover, the scenes in [111] are more challenging with multiple objects and more complex background.
4.4.2.1 Hole Filling
In previous section, comparison with VSRS for the extrapolation scenario involves the effect of missing region completion. In this section, additional experiments are provided for hole filling to compare performance of the proposed algorithm with the well known
123
inpainting technique introduced in [92]. During the experiments, the setup, which is illustrated in Figure 4.39 is exploited, where the reconstruction of 3rd camera corresponds to two baseline rendering and the reconstruction of 2nd camera corresponds to one baseline rendering. Virtual views are obtained through the color view of the 1st camera and its ground truth disparity map. Missing regions are filled by the proposed approach with two versions, where the effect of depth favoring is also tested, besides the inpainting through [92]. The quality measures are given in Table 4.5, in which the proposed depth favoring approach outperforms [92] for PSNR, SSIM and IW-SSIM metrics. On the other hand, the compared method in [92] has the superior performance for MSSIM metric on the two baseline scenario only. Utilization of depth priority during missing region completion improves visual quality compared to the case where depth priority is ignored. Typical hole filling results for the Art stereo pair are illustrated in Figure 4.40, and the detailed version in Figure 4.40.d. Background texture is copied to the unfilled region with high accuracy when depth priority is exploited, as shown in the second column of Figure 4.40.d, while there is a leakage from the foreground for no depth prior case. On the other hand, [92] yields structured hole filling with unpleasing visual quality. In Figure 4.41, two additional results are also illustrated for Aloe and Baby stereo pairs to provide visual interpretation.
Figure 4.39: The experimental setup for comparison of hole completion.
124
Table 4.5: The visually quality after hole filling. M IDDLEBURY 2-baseline / 1-baseline
Inpaint [92]
Proposed*
Proposed**
PSNR
28.3 / 31.0
29.5 / 32.3
29.8 / 32.5
SSIM
0.91 / 0.93
0.92 / 0.94
0.93 / 0.94
MSSIM
0.80 / 0.93
0.78 / 0.94
0.78 / 0.95
IW-SSIM
0.92 / 0.95
0.94 / 0.96
0.94 / 0.96
* No Depth Prior ** Depth Prior
Figure 4.40: The rendered views after hole filling via (a) proposed with depth prior, (b) proposed with no depth prior, (c) inpainting [16]; (d) detailed illustration for the rectangle region respectively.
125
Figure 4.41: (a) No hole filling, (b) proposed hole completion with depth prior and (c) inpainting [16]; 4.4.2.2 Depth Refinement
Depth refinement feedback loop is designed to remove visually disturbing artifacts, especially at the regions involving perceptually salient texture, such as text. For this purpose, additional experiments are conducted on MVV sequences with and without depth refinement. As expected, the effect of this step is visible for scenes involving text region, such as the Café sequence, while for the other videos, Newspaper and Book Arrival, the refinement is minimal. In Table 4.6, visual quality measurements are given before and after the refinement step for Café sequence. Improvement in the accuracy of rendered views is visible for both interpolation and extrapolation among all quality metrics. Although, there is no drastic increase in metrics, perceptually much more pleasing virtual views are obtained as illustrated in Figure 4.42. Regions involving text characters are corrected in the refined version increasing visual quality. Hence, this step is crucial to detect possible errors in disparity maps and re-assign proper disparity values providing visually pleasing virtual view synthesis.
126
Table 4.6: The effect of disparity map refinement on visual quality during VVR. CAFE Stereo
Before Refinement
After Refinement
PSNR
30.5 / 29.1
30.8 / 29.4
SSIM
0.91 / 0.88
0.91 / 0.91
M SSIM
0.90 / 0.87
0.91 / 0.91
IW-SSIM
0.93 / 0.90
0.93 / 0.93
Figure 4.42: VVR results (a) before depth refinement, (b) after depth refinement
4.4.2.3 Effect of Stereo Matching
The accuracy of disparity maps has an influence on the quality of rendering. In this subsection, a comparison is provided for the local stereo matching techniques mentioned in the previous chapter, based on the VVR quality via the estimated disparity maps. For this aim, the experimental setup given in Figure 4.43 is utilized, in which stereo matching is conducted between the 1st and 5th cameras. 0th, 3rd and 6th views are reconstructed from the
127
reference views compromising interpolation and extrapolation scenarios. It is important to note that, ground truth disparity maps of these reference views that enable intuition on the performance of stereo matching approaches are also available. During disparity estimation, the same cost calculation and occlusion handling schemes are utilized, while cost aggregation step is provided by various edge-aware filters, as in the previous chapter.
Figure 4.43: Experimental setup for measuring the effect of disparity estimation.
The average quality of the interpolated and extrapolated virtual views for 30 different scenes is given in Table 4.7. According to these results, the best reconstruction is provided by the disparity maps estimated through Guided Filter, while the proposed 4-neighborhood permeability filter has the 3rd rank. However, quality difference of the proposed approach and Guided Filter is almost insignificant (around .05%). It is important to note that, the proposed filtering yields the best quality disparity maps with respect to ground truth according to the experiments provided in previous chapter. However, in terms of visual quality, this superiority does not correspond to best virtual view rendering. This is due to the tiny errors along object boundaries that introduce possible artifacts decreasing visual quality. Besides, the proposed 4-neighbor permeability filter is still the most efficient technique among the local methods for disparity estimation that enables competitive VVR quality with much less computational complexity. Compared with the ground truth disparity maps, there is a 1-1.5 dB decrease in PSNR, almost similar SSIM ad IW-SSIM measures, and 5% decrease in MSSIM for the proposed filter, which is an expected and acceptable degradation due to well known imperfections of stereo matching.
128
Table 4.7: Average VVR quality measures for different edge-aware filters during stereo matching Int. / Ext.
PSNR (dB)
SSIM
MSSIM
IW-SSIM
Bilateral
31.2 / 31.7
0.95 / 0.95
0.89 / 0.89
0.95 / 0.96
2-pass Bilateral
31.1 / 31.7
0.94 / 0.94
0.89 / 0.89
0.95 / 0.96
O(1) Bilateral
30.7 / 31.1
0.93 / 0.93
0.87 / 0.86
0.95 / 0.95
Guided
31.8 / 32.0
0.95 / 0.94
0.89 / 0.90
0.96 / 0.96
Cos. Int.
30.9 / 31.4
0.93 / 0.94
0.90 / 0.89
0.95 / 0.95
Adapt. Box
31.2 / 31.7
0.94 / 0.94
0.89 / 0.89
0.96 / 0.96
Geodesic
31.4 / 32.1
0.94 / 0.94
0.88 / 0.92
0.96 / 0.96
Var. Cross
31.3 / 31.7
0.95 / 0.94
0.89 / 0.89
0.96 / 0.96
Proposed-4
31.6 / 31.4
0.94 / 0.94
0.90 / 0.89
0.96 / 0.96
Proposed-8
31.1 / 31.5
0.94 / 0.94
0.88 / 0.88
0.95 / 0.95
Ground Truth
32.9 / 32.5
0.95 / 0.94
0.95 / 0.94
0.97 / 0.96
4.4.2.4 Effect of Baseline
The baseline between stereo pairs is an important factor that determines stereo matching accuracy as well as VVR quality. In the previous section, disparity range between the stereo pairs is around 100 levels corresponding to 200% of the width of the images. Such a range yields disturbing 3D perception that is typically out of the comfort zone. In this section, stereo views providing comfortable 3D perception are exploited to measure the rendering quality, which is a more realistic scenario for 3D TVs. For this purpose, 2 nd and 4th cameras are utilized to render 1st, 3rd and 5th views as illustrated in Figure 4.44; and a comparison is conducted between large and small baseline cases via the proposed stereo matching and VVR tools. The results are given in Table 4.8 over 30 different scenes, and improvement by the utilizations of small baseline is obvious. Especially for the interpolation case, VVR quality is almost increased by 2 dB for PSNR, 2% for SSIM, 5% for MSSIM and 1% for IWSSIM. On the average, reconstruction accuracy is larger than 95% for all of the metrics and the PSNR measure is larger than 32 dB, providing visually pleasing virtual views.
129
Figure 4.44: The experimental setup for measuring the effect of baseline.
Table 4.8: VVR quality of the proposed approach for large and small baseline scenarios. PSNR
SSIM
MSSIM
IW-SSIM
Interpolate
31.6
0.94
0.89
0.95
Extrapolate
31.4
0.93
0.89
0.95
Interpolate
34.3
0.95
0.94
0.97
Extrapolate
32.7
0.95
0.90
0.96
Large Baseline
Small Baseline
4.4.3
Stereo to Multi-view Conversion
So far, the proposed VVR tool is compared to the state-of-the-art in terms of rendering capability, hole completion, the effect of stereo matching and baseline differences between stereo pairs. It has been argued that, the proposed technique yields competitive visual quality enabling perceptually pleasing VVR. In this section, overall performance of the proposed stereo to multi-view conversion is analyzed with some additional experiments. In order to interpret capability of the proposed scheme, DERS and VSRS tools are considered as the reference techniques for stereo matching and VVR. The resultant rendering quality is compared to the virtual views obtained by the proposed stereo matching and rendering methodology.
130
For this purpose, stereo matching is conducted on MVV sequences of Newspaper, Book Arrival and Café according to the experimental setup given in Figure 4.20. Hence, multiple views are rendered from source stereo color images, as the fundamental achievement of this dissertation. The experimental results are given in Table 4.9, Table 4.10 and Table 4.11 involving four visual quality metrics respectively. Superiority of the proposed conversion scheme is obvious for interpolation and extrapolation scenarios. Among Newspaper sequence, reference software (DERS + VSRS) is outperformed by the proposed approaches for all type of metrics, while this is not valid for Café sequence according to MSSIM and IW-SSIM, although there is an obvious improvement (around 2.5-3 dB) for PSNR. The proposed approach yield better visual quality for Book Arrival in terms of PSNR, SSIM and IW-SSIM, while having MSSIM slightly below reference techniques. The proposed approach yields high quality conversion for Middlebury database, according to the analysis given in Table 4.8, such that for small or large baseline scenario, PSNR is always above 31 dB.
Typical stereo-to-multi-view conversion examples are
illustrated in Figure 4.45 and Figure 4.46 for Art and Book Arrival sequences pair with 9 interpolated views between left and right images that yields a compatible content for glassesfree Multiview displays. The improvement over DERS-VSRS for stereo-to-multi-view conversion is more visible compared to the improvement of only VVR tool. The main reason behind such a result lies in the robustness of the introduced permeability based stereo matching algorithm unified with disparity refinement during VVR. In addition to the robustness, the proposed scheme requires low computational complexity especially for stereo matching compared to state-ofthe art local methods and the reference software. Thus, in this dissertation an alternative approach for stereo-to-multi-view conversion with competitive performance in terms of accuracy and complexity is provided, fulfilling the desire of content generation for next generation 3D-TVs.
131
Table 4.9: Comparison of stereo-to-multi-view conversion performance for Newspaper sequence. NEWSPAPER Stereo
Proposed
DERS - M VV
PSNR
28.6 / 26.5
26.7 / 24.4
SSIM
0.89 / 0.89
0.88 / 0.83
M SSIM
0.93 / 0.86
0.92 / 0.86
IW-SSIM
0.94 / 0.93
0.92 / 0.87
Table 4.10: Comparison of stereo-to-multi-view conversion performance for Cafe sequence. CAFE Stereo
Proposed
DERS - M VV
PSNR
30.8 / 29.1
28.4 / 26.1
SSIM
0.91 / 0.91
0.91 / 0.88
M SSIM
0.91 / 0.86
0.96 / 0.91
IW-SSIM
0.93 / 0.92
0.95 / 0.90
132
Table 4.11: Comparison of stereo-to-multi-view conversion performance for Book Arrival sequence. BOOK ARRIVAL Stereo
Proposed
DERS - M VV
PSNR
32.2 / 31.6
26.8 / 26.0
SSIM
0.88 / 0.87
0.86 / 0.85
M SSIM
0.94 / 0.93
0.94 / 0.95
IW-SSIM
0.96 / 0.95
0.94 / 0.94
Figure 4.45: A typical example of stereo-to-multi-view conversion (from stereo to nine views) for Art stereo pair
133
Figure 4.46: A typical example of stereo-to-multi-view conversion (from stereo to nine views) for Book Arrival sequence
4.5
Conclusion
In this chapter, a novel depth image based rendering tool is presented addressing the needs for visually pleasing virtual views from stereo content. The traditional algorithm flow for VVR is modified by a feedback mechanism that provides a conjunction with stereo matching to remove visually disturbing artifacts due to imperfections of matching. Besides, edge-aware permeability filter is modified for hole filling that is an important tool to compile occluded regions in virtual views that cannot be assigned to valid texture from source cameras. In order to evaluate overall performance of the proposed VVR approach, extensive experiments was conducted through comparative analyses with state-of-the-art techniques. Various multi-views videos and static images have been exploited during experiments validating superiority of the proposed approach according to various visual quality metrics. Apart from well known PSNR measure, perceptually more robust metrics such as SSIM, MSSIM and IW-SSIM that have high correlation with human perception are also included.
134
In addition to comparative experiments on rendering quality, fundamental algorithm blocks of the proposed approach are also examined. For this purpose, hole completion step is compared to the state-of-the-art hole filling techniques, demonstrating substantial improvement. On the other hand, visual artifacts among perceptually salient regions in virtual views are obviously decreased by the depth map refinement step. The effect of disparity estimation and baseline between stereo cameras are also investigated to evaluate overall performance of the proposed stereo matching tool in terms of rendering quality. In this manner, for a more realistic scenario, where disparity range is around 10% of the horizontal resolution, accurate virtual views are obtained. Finally, stereo matching and VVR tools are unified for stereo-to-multi-view conversion, which is the ultimate aim of this dissertation, and comparative tests are conducted with MPEG/FTV reference software. These experiments indicate efficiency of the proposed methodology with competitive performance, yielding a strong alternative to meet the requirement of content generation for next generation 3D-TVs. In the following chapter, parallel implementation of the proposed conversion tool, involving stereo matching and VVR is given that enables real-time operation for specific configurations.
135
CHAPTER 5
5
GPU IMPLEMENTATION
In consumer electronics, real-time processing capability is one of the most crucial challenges that limit implementations of algorithms. As popularity of 3D TVs increases, there has been a focus on the research efforts devoted to development of efficient algorithms. At that point, stereo matching, that is the key tool to extract dense and reliable 3D structure, has been popular for various systems exploiting 3D dependent applications such as 3D TVs and robotics. It is a well known fact that, stereo matching is computationally expensive and requires large amount of hardware resources compared to remaining computer vision algorithms that limits real-time processing for CPU systems. Therefore, special platforms are required to optimize stereo algorithms and increase operational speeds to the desired frame rates. Graphics processing units (GPU) that enable use of parallel processors is one of the most endeavored platforms to map stereo matching algorithms for real-time applications. Among alternative architectures for GPU, Compute Unified Device Architecture (CUDA) [119] supported by Nvidia Corporation provides more flexibility to manage multiple processors requiring less effort to map CPU intended C codes. As illustrated in Figure 5.1, there are many Streaming Multiprocessors, SMi, for a CUDA enabled GPU, where each SMi involves a set of Streaming Processors, SPi. SPis share a limited local memory, shared memory, which enables fast data acquisition. These processors can also access global (device) memory that requires higher computational load compared to access from local memory. Thus, in CUDA, separation of the global memory into multiple small independent local memories is encouraged. The processing grid is divided into blocks which are executed sequentially as illustrated in Figure 5.2. The blocks correspond to SMis, which follow a sequential execution order; while each block is processed by threads which are the workhorse behind the parallelization of an algorithm. Thread blocks are formed in a stream processor and execute in parallel as long as they map physically to the processor. Number of threads can exceed number of SPis based on the implementation; in this case threads are split
136
into warps, where only one warp is active at a time executing all operations in parallel. The order of operation between warps is sequential such that once operations in a warp is finalized the next warp starts. Such an architecture, where parallel operations are performed by threads, requires careful attention to split an algorithm into independent blocks.
Figure 5.1: GPU structure of Nvidia Graphics Card [121].
During the last decade, there has been an attractive trend for GPU implementation of stereo matching algorithms to achieve real-time processing capabilities. Considering the limitations of parallelization, that prevent recursive structures and encourage independent operations, introduction of GPU intended constraints is a natural progress for algorithm development. It is a common observation that accurate stereo matching algorithms [18] require high computational complexity in general; on the other hand, the algorithms with high processing capability [31] yield relatively low matching accuracy. Moreover, GPU implementation of most of the high performance stereo algorithms is not efficient since the key steps such as cost aggregation, energy minimization and post-processing, are not suitable for parallel processing. Therefore, GPU friendly algorithm development has been popular [121] in recent years presenting the trade-off between accuracy and complexity. From this point of view, development of the proposed stereo-to-multi-view methodology in this dissertation has been constrained by GPU implementation which enables real-time processing for specific configurations.
137
Figure 5.2: Typical block-thread structure for GPU implementation [121].
In this chapter; literature review for GPU implemented stereo algorithms is given in the following section. Then, proposed GPU implementation scheme for stereo matching and VVR are presented. In the experiments section, improvement of GPU implementation over CPU in terms of computational speed is analyzed and comparative results with state-of-theart are provided. Finally, concluding remarks are given with future directions and additional comments for this chapter.
5.1
Related Work
Real-time execution capability for stereo matching pioneered a new research area for computer vision, with platform dependency. In this manner, GPU implementations dominate literature with various alternative techniques. In [121], an analysis is given on parallel implementations of several optimization techniques for stereo matching, in terms of running times and memory capability. Belief Propagation, which is a common tool to solve Markov Random Fields, is implemented for real-time stereo purposes in [33] and [16] with low
138
frame-rates. For global optimization, iterative solutions over full cost volumes require high memory utilization as well as sequential operations between iterations which decrease parallelization capability. On the other hand, dynamic programming, with its semi-global optimization approach, yields more efficient real-time implementations as proposed in [122][123]. Stereo matching which enables high parallelization is conducted along each row independently. Semi-global matching introduced in [123] extends row-wise operations to multi-directions in order to increase accuracy of estimation with a sacrifice on operation speed. The most endeavored optimization technique for parallel implementations is WTA approach that is exploited by local algorithms [124]-[128]. Low memory requirement and non-iterative algorithm flow are the main advantages of these techniques with adaptive support weights utilization. In these techniques [124]-[126], each pixel is supported by colorwise similar neighboring pixels independently, providing edge-awareness and smoothness for the estimated disparity maps. Adaptive weights are modeled by constant weights over arbitrary support regions in [127] that enable faster processing without violation of edgeawareness. In [128], however, geometric relations are included in adaptive support weights, i.e., geodesic support, to increase accuracy by introducing additional computation. In this case, stereo matching is achieved with near real-time capability. In [27] and [129], iterative approximations of adaptive weights are presented yielding fast execution with increased memory requirement. Accuracy of the local based real-time algorithms can be increased by unification of dynamic programming as proposed in [23] [34], where aggregated cost values are optimized through semi-global matching. Such an approach introduces additional complexity; however, real-time capability is still valid under specific configurations. Besides, in [130] and [131], a framework is introduced for virtual reality applications including depth image based rendering. Hence, real-time implementation of stereo matching and virtual view rendering are unified for a complete system, which constitutes main goal of the efforts in this chapter as well.
5.2
Proposed Implementation
In this section, implementation of the presented stereo-to-multi-view conversion tool on a commercial high end graphics card is detailed. For this purpose, one of the most common
139
graphics card for personal computers, GeForce GTX 480 with Nvidia’s Fermi architecture is utilized. Specifications of the card are summarized in Table 5.1. Number of CUDA cores and size of the shared memory per SM (block) are the key specifications that affect usage of threads during the design of parallel implementation.
Table 5.1: Specifications of the graphics card utilized in this dissertation.
Algorithmic flow and the order of processing of pixels determine the way of thread utilization. Therefore, special attention is devoted for each step to improve parallelization efficiency. In this manner, stereo matching and virtual view rendering steps require different block-thread divisions that are analyzed in the following sub-sections. It is important to note that, for GPU application, standard definition (SD) side-by-side stereo video is considered as the input, for which each left and right image have the resolution of 720x576. Stereo matching provides disparity maps in SD that are exploited to render virtual views with same resolution in the following step as the final output of the whole system.
5.2.1
Stereo Matching
As mentioned in Chapter 3, the proposed stereo matching method involves four main steps, cost calculation, aggregation, minimization and occlusion handling. Temporal consistency among stereo video is further provided by a post-processing which involves temporal filter as the additional algorithm step. Implementation of each step is conducted with various block-thread distributions according to the computation structure within each block independently. In Figure 5.3, algorithm flow for GPU implementation of stereo matching is presented. In order to enable much faster running time as well as exploit shared
140
memory more efficient, aggregation of cost values and minimization are conducted on downsampled domain with 360x288 resolution, while cost calculation, occlusion handling and temporal filter are executed on the original SD domain. Thus, an additional (2x2) upsampling is required to yield SD resolution disparity maps, after minimization. Throughout the explanation of parallelization structures, each block is stored in shared memory for maximum utilization of fast memory allocation advantages of GPU.
Figure 5.3: Revised algorithm flow of stereo matching for GPU implementation.
5.2.1.1 Permeability Weight Calculation
In this step, for each pixel two weight calculation operations are conducted along horizontal and vertical axis, by exploiting the symmetrical property of left-right and topdown permeability weights. The block and thread distribution for the parallel implementation is given in Figure 5.4, where the color image is divided into 40x6 block grids with 9x48 resolution. One block is processed through 432 threads each responsible for one pixel. RGB comparisons of a pixel with its horizontal, vertical and temporal neighboring pixels are executed by one thread independently. During the calculation of spatial weights, color values are gathered from the higher resolution views (720x576) with two pixel shifts along the corresponding directions, and the weights are stored within decremented resolution. For the temporal permeability weight, however, down-sampled views are exploited to avoid high memory storage of the previous frame. The presented structure enables maximum utilization of parallelization with proper block and thread distribution
141
Figure 5.4: Block and thread distribution for permeability weight calculation.
This step is executed once before the disparity dependent steps, for each frame, and the outcomes are utilized in the horizontal and vertical aggregation. In this manner, complexity of permeability weight calculation does not depend on the number of disparity candidates during stereo estimation. Besides, the operation is conducted for left and right images independently.
5.2.1.2 Cost Calculation
Cost calculation is executed for each disparity candidate sequentially, to utilize the advantage of low memory requirement. In this manner, cost values are calculated for one disparity level that is followed by the aggregation steps. Then, a comparison is conducted for minimization. Once the process of a disparity candidate is finalized, process of the next candidate starts where previous memory is over-written. During calculation of cost values, disparity resolution can be lost as long as the down-sampled views are exploited since 1 pixel shift in higher resolution cannot be discriminated in low resolution. For this purpose, high-resolution views are utilized to calculate cost values for each disparity candidate corresponding to original resolution depth range, as illustrated in Figure 5.5.
142
Figure 5.5: Disparity resolution is not lost when cost calculation is conducted among high resolution views.
Block and thread distribution of the cost calculation step is given in Figure 5.6, where each row is considered as the blocks involving 360 threads within. Image grid is divided along vertical direction into blocks with 1 pixel height and 360 pixels width. As discussed, each thread executes on 2x2 window in high-res view to calculate cost value for one pixel. In this implementation, pixel-wise SAD cost measure is exploited for simplicity.
Figure 5.6: Block and thread distribution for cost calculation.
143
5.2.1.3 Horizontal Aggregation
The most crucial steps of the proposed stereo matching algorithm are the horizontal and vertical aggregation. Considering successive weighted summation (SWS) approach introduced in Chapter 2, during horizontal aggregation, each row is processed recursively by a progress and update rule. For this purpose, image grid is divided into blocks as illustrated in Figure 5.7 that is similar to the cost calculation step. The aggregation structure within a row is not suitable for efficient parallel implementation, due to the recursive structure of SWS enabling only two threads for left-right and right-left scans at a time instant. In this manner, an approximation is provided by increasing number of computations as well as thread utilization for sake of faster execution capability. Instead of scanning the row in two directions to fuse preceding and proceeding information for a pixel, aggregation is performed within a pre-defined area for each pixel independently. In Figure 5.8, utilization of partial SWS is illustrated, where each arrow corresponds to scan operation of one thread. In original SWS, two threads are exploited independently to scan a row, while in the modified version the row is divided into partial regions (Lx1) for each pixel and 360 threads can execute recursive operations (left-to-right and right-to-left scans) at the same time. This approximation, although increases total number of operations per pixel, yields much more efficient parallelization due to increased number of threads. On the other hand, support areas are limited by the pre-defined areas in the modified version that could introduce some accuracy loss. However, exploiting (40x40) or (60x60) window is sufficient to obtain high quality disparity maps for stereo pairs with 720 x576 resolution. In this manner, L is chosen to be within [40, 60].
Figure 5.7: Block and thread distribution for horizontal aggregation.
144
Figure 5.8: Partial approximation of original SWS to exploit threads efficiently.
5.2.1.4 Vertical Aggregation
During vertical aggregation, each column is processed in top-to-bottom and bottom-to-top scans; thus, cost map grid is divided into blocks corresponding to columns as illustrated in Figure 5.9. One block involves 288 pixels each of which is assigned to one thread. Similar to the discussion given in horizontal aggregation section, SWS is not proper for high efficient parallel implementation in vertical domain as well. Therefore, partial SWS approximation is provided along vertical domain to accumulate horizontally aggregated cost values with effective 2D support regions. 288 threads are executed in parallel performing two scans for each pixel within a restricted area (1xL).
Figure 5.9: Block and thread distribution for vertical aggregation.
145
5.2.1.5 Minimization
Cost values of each disparity candidate are compared to minimum values obtained so far through sequential processing over disparities. The comparison and update operations are conducted according to the block-thread structure provided as in Figure 5.4, where initial grid is divided into 40x6 blocks similar to the distribution given in permeability weight calculation section. 432 threads are assigned for each block, processing same number of pixels as well. This step outputs initial disparity maps for both left and right images, after sequential comparison among disparity candidates.
5.2.1.6 Up-Sampling
Initial disparity maps are obtained in low resolution, therefore an additional up-sampling is required to have full resolution version. Nearest neighbor interpolation is utilized in this step due to simplicity and sufficient precision. The initial grid, image, has a resolution of 720x576 which is the target resolution of up-sampling for the disparity maps. For this purpose, blocks and grids are distributed according to the structure given in Figure 5.10, where number of blocks is increased by factor of four, compared to the low-resolution scenario as expected. There are 432 threads assigned to each pixel within a block, executing in parallel to increase the resolution of the initial disparity maps.
Figure 5.10: Block and thread distribution for up-sampling.
146
5.2.1.7 Occlusion Handling
Occlusion handling involves multiple steps involving cross check to determine unreliable pixels, then permeability filter to fuse information to these regions through reliable pixels located at background. These operations are conducted on full resolution disparity maps by exploiting similar block-thread distributions as in the previous stages, such as structure provided in Figure 5.10 is valid for the detection of occluded pixels. Permeability filter in horizontal and vertical directions for this step, detailed in Chapter 3, are conducted on the enlarged blocks of Figure 5.7 and Figure 5.9, where 720 and 576 threads are assigned for each block in horizontal and vertical aggregation respectively. Partial SWS is operated to maximally utilize efficiency of parallelization within these blocks.
5.2.1.8 Temporal Filter
Temporal filter is the final step of stereo matching that smoothes estimated disparity maps along time axis to remove possible flickers. This step is also performed on the full resolution according to the parallelization structure provided in Figure 5.10. Each thread processes one pixel by averaging over the disparity map of the previous frame through temporal permeability weights. 5.2.2
Virtual View Rendering
Implementation of virtual view rendering in GPU involves four main stages after several simplifications over the original version introduced in Chapter 4. However, feedback mechanism to correct erroneous disparity values is removed for sake of real-time capability. The flow chart of the modified version is illustrated in Figure 5.11, in which each step is conducted on full resolution disparity maps and color views. As in stereo matching case, shared memory utilization and large number of threads are the main constraints for the design of parallel implementation. In the following sub-sections, block-thread structure of each block is explained in detail.
147
Figure 5.11: The algorithm blocks for the GPU implementation of VVR step.
5.2.2.1 Pre-Process of Disparity Maps
In this step, disparity maps of left and right stereo pair are enlarged by favoring foreground disparity values, in order to prevent possible background-foreground leakage. This process enables highly parallel structure as given in Figure 5.12, where image grid is divided into 80x12 blocks each having 432 threads. Each thread processes one pixel within a 3x3 window to determine the largest disparity among the neighboring pixels.
Figure 5.12: Block and thread distribution for the pre-processing of disparity maps.
5.2.2.2 Virtual View Depth Composition
Virtual view depth composition in GPU is performed according to the structure illustrated in Figure 5.13. Each block is assigned to one column, in order to prevent overlapping of pixels during the warp operations of disparity values. This step constructs 3D structure of virtual camera view by fusing left and right disparity maps. There may be holes after both maps are warped to the virtual camera location; hence, hole filling is required for the occluded regions. This is handled by copying the background disparity the neighbor pixels
148
among left and right row scans. For this purpose, the structure given in Figure 5.8 is utilized, while the operations are only conducted for the pixels in occluded regions.
Figure 5.13: Block-thread structure for virtual view depth composition. 5.2.2.3 Texture Copy
Once each pixel in the virtual view is assigned to the proper disparity values, texture copying is conducted to gather RGB values from the source images. Depending on the location of virtual camera, primary source is determined to follow a sequential order to fuse color of both images. Initial RGB values are copied from the primary source, and the missing regions are compiled from the other source. Parallel implementation of this step is conducted on the same block-thread structure provided for depth composition given in Figure 5.13. Each thread is assigned to one pixel along a column block, and gathers RGB values from the corresponding location of the source images. This operation is performed twice to compile holes through the secondary source that are not visible from the primary source.
5.2.2.4 Hole Completion
Especially, for extrapolation case, the holes cannot be compiled in texture copy step from any source view. Hence, a hole filling is required to provide visually pleasing and complete virtual views as the final outcome. This is handled by performing permeability filter along RGB values, according to the same structure provided for occlusion handling in Section 5.2.1.7. Each channel are filtered independently that increases computation almost six times compared to the occlusion handling for disparity map. Block-grid structure for this step is the
149
enlarged blocks of Figure 5.7 and Figure 5.9, where 720 and 576 threads are assigned for each block in horizontal and vertical aggregation respectively. According to the presented structure, this step involves the most time consuming processes for the virtual view rendering that is also validated in the experiments section.
5.3
Experimental Results
In this section, the efficiency of the presented GPU implementation scheme is tested according to the improvement over CPU version and compared to the state-of-the-art techniques to interpret availability for real-time systems. The tests are conducted over 720x576 stereo videos on 3.06GHz Intel Core i7 with 6 GB RAM CPU and GeForce GTX 480 graphics card. A screen shot is illustrated in Figure 5.14, with a left view and its estimated disparity map. Besides, the user interface of CUDA implementation is also shown, where several parameters can be adjusted for flexibility.
5.3.1
Improvement over CPU
Execution time of each step for stereo matching (including both left and right views) is presented in
Table 5.2 that summarizes the improvement of GPU performance over CPU. Speed-up factors indicate how fast the corresponding step runs in GPU compared to CPU. This factor goes up to 90 for highly parallelizable computations, such as cost calculation and minimization. The speed-up factors for weight extraction and temporal filter are lower compared to steps with similar block-grid structure, since shared memory utilization is limited for the presented implementation. As expected, horizontal and vertical aggregation speed-up rates are also low due to increased computation to exploit more threads. Occlusion handling is the most time consuming algorithm block excluding disparity dependent steps. This is also an expected result, since occlusion handling is conducted on full resolution with multiple usage of permeability filter.
150
Comparing the overall complexity, disparity independent part for CPU requires 96 msec, while it is 2.2 msec for GPU. On the other hand, the most critical steps, executed sequentially by number of disparity candidates, (cost calculation, horizontal-vertical aggregation and minimization) require 31 msec and 0.6 msec per disparity for CPU and GPU respectively. From this analysis, it is concluded that GPU implementation can calculate 64 disparity candidates for (720x576) stereo pair with real-time capability (24 fps). On a common convention, this corresponds to 1312 million disparity estimation (MDE) per second. Alternating resolution of the stereo pair, wider range of disparity search can be conducted without violation of real-time processing. According to the number of operations per second, the overall speed-up factor of GPU implementation is 54 over CPU.
151
Figure 5.14: A screen shot of a video and user interface for CUDA implementation.
Computation times of each algorithm block devoted to render one virtual view are listed in Table 5.3. As expected, GPU speed-up factor is quite high for pre-process and texture copying, while it is limited for depth composition and hole filling. The most time consuming block for both CPU and GPU is the hole filling which requires multiple horizontal and vertical passes. Almost 80% of computation in GPU is devoted to this step, while it is 65% for CPU. Comparing to the overall computation time, GPU implementation enables 40x speed-up with 8.6 msec for rendering one virtual view of size 720x576.
152
On the average, proposed stereo-to-multi-view conversion scheme has the complexity of (2.2 + 0.63D + 8.6N msec) on GeForce GTX 480 graphics card, where D is the number of disparity candidates and N is the number of rendered virtual views. According to this complexity, two virtual views can be rendered through stereo matching among 32 disparity candidates within 24 frames per second, meeting the real-time requirement. The provided frame rate of disparity range can be increased by utilizing a simpler version of hole filling which is the most time consuming step among all processes; such that frame rate goes up to 50 fps when background copy is utilized for hole completion. On the other hand, it is important to note that more efficient implementations can be provided for each step of the presented scheme with additional efforts. However, for the time being, further optimization is not required, since real-time capability is obtained for a specific configuration that also demonstrates high efficiency of the proposed stereo matching and VVR tools.
Table 5.2: Comparsion of CPU and GPU execution times for each block of stereo matching algorithm. Computation time (msec)
CPU
GPU
Speed-up
Weight Extraction
8.50
0.213
40
Cost Calculation
9.85
0.108
91
Horizontal Aggregation
5.66
0.172
33
Vertical Aggregation
8.39
0.281
30
Minimization
6.56
0.071
92
Up Sampling
12
0.153
78
Occlusion Handling
51
1.283
40
Temporal Filter
24
0.552
43
Overall
95.5 + 30.5D
2.2 + 0.63D
-
MDE / sec
24
1312
54
153
Table 5.3: Comparsion of CPU and GPU execution times for each block of VVR algorithm.
5.3.2
Computation time (msec)
CPU
GPU
Speed-up
Pre-Process
47
0.43
90
Depth Composition
31
0.92
34
Texture Copy
16
0.24
65
Hole Filling
219
7.01
31
Overall
344
8.59
40
Comparison with State-of-the-Art
Apart from improvement over CPU, a comparison with state-of-the-art is required to interpret the capability of the developed GPU implementation. For a fair comparison, graphics cards should be compatible with each other. In [121], some well known algorithms, Block Matching, Belief Propagation, Dynamic Programming [122] and Semi-Global Matching [123] are implemented on GeForce GTX 480 which is the same card in this study. Besides, implementation of AD-Census in [34] is also conducted on the same graphics card. In Table 5.4, measures of million disparity estimations (MDE) per second are given with a ranking in terms of execution speed. The block matching implementation, which is the simplest and worst performance technique for stereo matching, provided in [121] is almost 25% faster than our implementation of block matching, achieved by omitting horizontalvertical aggregations. Proposed implementation outperforms well known Semi-Global Matching and Belief Propagation methods with 5x to 10x improvement. On the other hand, Dynamic Programming yields two times much faster execution with row independent processing. Compared to AD-Census in [34], which is a hybrid technique fusing local stereo and semi-global matching, proposed approach executes almost 12 times faster, which demonstrates the efficiency of current implementation. For the sake of completeness, additional algorithms are included in Table 5.4, Censusbased [124], Stream Centric [130] and Geodesic Support [128], which are implemented on
154
older versions of GeForce GTX. In that manner, the listed MDEs can be further increased (at most by factor of 2) when these methods are implemented on GTX 480. Especially, comparison with Geodesic Support [128] is important to interpret capabilities of the proposed stereo matching algorithm, since [128] is one of the best performing local stereo algorithms. As intensively compared in terms of accuracy in Chapter three, proposed permeability filter yields more precise estimation compared to Geodesic Support, with 30 times faster (after mapped to GTX 480) execution in GPU. On the other hand, Census-based [124] and Stream Centric [130] can perform faster than the proposed technique on the same environment. It is important to note that accuracy of these algorithms is sub-optimal due to approximation of edge-aware filters for stereo matching. Table 5.4: MDE capabilities for several stereo matching algorithms in GPU.
GPU
MDE / sec
Block Matching [122]
5696
Block Matching (Proposed)
4597
Dynamic Programming [123]
2952
Proposed
1312
Census-based* [125]
1152
Stream Centric* [131]
1040
Semi-Global Matching [124]
260
Belief Propagation [122]
122
AD-Census [34]
109
Geodesic Support* [129]
20
* Exploit older version of GeForce GTX
155
According to the comparison with state-of-the-art, proposed implementation yields comparable execution speed enabling real-time applications for particular specifications. Although there is room for further improvement in terms of running time, current implementation seems to be efficient for various applications. One important point to mention is that, presented stereo matching algorithm has also been implemented on SpartanXC6SLX9 FPGA for 3D TV applications, illustrated in Figure 5.15, providing 60 fps for stereo video with 480x270 resolution as detailed in [137]. In conclusion, proposed overall stereo-to-multi-view conversion system is one of the pioneering studies devoted to develop alternative applications for 3D TVs.
Figure 5.15: (a) TV board on which stereo matching is implemented, (b) a screen shot from a 3D TV with stereo matching output.
5.4
Conclusion
In this chapter, parallel implementations of the proposed stereo matching and virtual view rendering algorithms are presented with detailed block-thread structures. Special attention is devoted for each step that involves various characteristics of processing order, to design an efficient GPU implementation. Besides, several modifications are given to simplify and remove time consuming steps. For this purpose, Nvidia GeForce GTX 480 graphics card is exploited that provided speed-up factors of 54 and 40 over CPU implementation for stereo estimation and virtual view rendering respectively. The overall speed-up factors enables realtime capability for both of the tools such that stereo matching can be performed among 32 disparity candidates as well as two virtual views can be rendered with 24 frames per second.
156
According to the MDE comparison with state-of-the-art, the presented implementation is competitive with efficient algorithms, while outperforms methods with high accuracy matching capability. Therefore, the proposed approach seems to be an efficient alternative engaging high accuracy and fast implementation for stereo matching and VVR that is applicable for various applications. A final point that deserves attention is that, more efficient GPU implementations of the proposed algorithms can be provided with careful efforts on parallelization. This remains as a future direction, since current implementation is sufficient to execute in real-time under specific conditions that meet the requirements under the scope of this dissertation.
157
CHAPTER 6
6
SUMMARY AND CONCLUSION
In this thesis, a novel and efficient methodology for the conversion of stereo videos to multi-view that addresses the requirement of appropriate content creation for next generation 3D TVs, e.g. multi-view auto-stereoscopic displays, is presented. Such a conversion enables recycling of excessive amount of stereo video filmed for 3D cinemas and 3D TVs, for multiview displays without dedicated multi-camera (more than two cameras) capture systems. The presented approach involves two main blocks, as extraction of 3D information from stereo views and generating inexistent views by utilization of 3D structure. For this purpose, depth image based rendering is utilized to enable multiple virtual views from stereo content. In order to validate efficiency of the presented algorithms, GPU implementation which enables real-time operation through advantages of parallelization for specific configurations is also provided. A summary and conclusion of the research contributions of this dissertation are presented in the next section followed by the directions of future research.
6.1
Summary and Contributions
The idea of supporting each pixel through color-wise similar neighbors enables robust semantic models, such as depth, motion, segmentation, preserving object boundaries. Besides, they require high complexity due to color adaptive operations that limit fast operations for various purposes. Hence, significant amount of research is devoted to develop efficient edge-aware filters. As the first and fundamental achievement of this thesis, a multipurpose edge-aware filter is proposed with high efficiency that is applicable to intermediate problems of stereo-to-multi-view conversion. In this thesis, a new paradigm, namely separable successive weighted summation (SWS) along horizontal and vertical directions enabling constant operational complexity is presented. The weights are determined by 4 (8)-neighbor intensity similarity of pixels and
158
utilized to model information transfer rate, permeability, towards the corresponding direction. Aggregation is provided through two reverse scan orders in the corresponding directions with no pre-defined support area. Hence, permeability filter provides totally adaptive support region for each pixel depending on local color distribution. Information transfer is prevented across color edges, while such a transfer allowed over smooth color transitions providing 2D connected support regions for each pixel. Moreover, filtering is achieved by small number of operations compared to state-of-the-art techniques; for fourneighbor permeability filter, there are only six additions and four multiplications, while for eight-neighbor filter 14 additions and 16 multiplications are required independent of support region size. Permeability filter is utilized at each step of the presented stereo-to-multi-view conversion scheme. In the first step, stereo matching is conducted to extract 3D information from left and right color images. Constrained by low computational complexity and high accuracy requirements, the proposed approach exploits local optimization through permeability aggregation filter. Under the assumptions of smoothness and visual similarity, the best matches are estimated for each pixel in both left and right views. Utilization of edgeaware filter enables supports for each pixel among color-wise similar neighbors yielding crisp and smooth disparity maps. The presented filter is applied to aggregate cost values for each disparity candidate that is minimized through a winner-take-all optimization to assign initial estimates of disparity maps for left and right views. The same idea is also utilized to fuse consistency between left-right pair as well as along temporal domain to yield flickerfree disparity maps of stereo video. The second block of the proposed conversion tool is the generation of multiple views from stereo view through extracted disparity maps. This step is achieved by depth image based rendering. Addressing fundamental requirement of visually pleasing virtual views, the general flow of DIBR approaches is improved with a disparity error feedback mechanism in which errors along visually salient regions, such as text, are corrected. Once disparity maps are refined, a pre-processing is conducted to prevent possible foreground-background texture copy by boundary enlargement. The following step is the composition of disparity map of desired virtual view that is obtained through 3D warps of left and right disparity data. According to the constructed 3D structure, proper RGB values are gathered from source cameras through texture copy. During this step, color calibration between left and right views is conducted in order to prevent color inconsistencies in the rendered view. Some pixels are not assigned to proper texture due to invisibility through reference cameras. As the
159
final step, an efficient hole completion is proposed as an extension of the proposed edgeaware permeability filter that enables visually pleasing and consistent texture for sake of complete virtual views. The proposed virtual view rendering scheme is applied to generate multiple views that provides required content for next generation 3D TVs. As the final achievement in this dissertation, GPU implementation of the proposed stereoto-multi-view conversion scheme is conducted with computation advantage of parallel programming. For this purpose, Nvidia CUDA platform where special attention is devoted to partition each algorithmic block into independent processing units is exploited. This achievement provides real-time capability under specific configurations.
6.2
Conclusions
Extensive experiments are conducted for each algorithm block to compare with state-ofthe-art and interpret algorithm capability. Proposed edge-aware filter, permeability filter, is compared against the well known filters in terms of computational speed, memory requirement and accuracy. For this purpose, depth data up-sampling and stereo matching are considered as the fundamental applications under the scope of stereo-to-multi-view conversion. According to the detailed experiments, proposed 4-neighbor approach is the most efficient technique among various local approaches providing weighted averaging over adaptive support regions, with fastest execution for depth up-sampling and stereo matching. The main reason behind such a result is utilization of reduced number of operations per pixel, corresponding to four multiplications and six additions. Besides, highest performance is obtained with 4-neighbor and 8-neighbor permeability filters for stereo matching, with almost 15% improvement in accuracy among the state-of-the-art. Proposed approach yields competitive performance for depth data up-sampling with almost 2000 times faster execution capability compared to geodesic filter which is the best performing technique. On the other hand, required memory is low compared to constant complexity approximations of edgeaware filters. Thus, the presented edge-aware filter is a good alternative for geometry related applications with high accuracy, quite fast execution and low memory request. The presented stereo matching algorithm has superior performance compared to the stateof-the-art algorithms. Among all examined local aggregation based methods, highest
160
precision is obtained over various stereo pairs with available ground truth disparity maps. The ratio of correctly estimated disparity is over 90%, even for large baseline scenario that proves the robustness of the proposed algorithm. It is important to note that this performance can be further increased with additional post-processing rather than sole aggregation as conducted throughout this thesis. In this manner, the proposed approach is the best performing technique that exploits sole edge-aware aggregation and occlusion handling without any iterative blocks. Extension of permeability filter in time domain yields temporally smooth and consistent disparity maps that boost up overall estimation quality. Moreover, presented occlusion handling enforces left and right disparity maps to be consistent with each other. Detailed analysis of the presented algorithm indicates the importance of occlusion handling and flexibility to exploit multi-resolution for faster operations with almost 1-2% loss in precision. On the other hand, orthogonal scanning for 4neighbor permeability filter introduces some precision loss along tiled regions. This drawback is handled by 8-neighbor permeability filter with a sacrifice on the large support regions that decreases overall performance compared to 4-neighbor version. Actually, this result could be misleading for scenes involving intensive non-orthogonal structures. On average, proposed approaches yield a good alternative for the trade-off between accuracy and complexity. Virtual view rendering tool is compared to the reference software utilized for MPEG 3DV/FTV standardization efforts which is one of the most endeavored algorithms in literature. Experiments on multi-view video indicate that proposed VVR has competitive or even slightly better performance, especially based on visual quality metrics highly correlated with human perception. Disparity error feedback mechanism removes salient artifacts especially around text regions increasing visual quality. Moreover, the proposed hole filling technique provides a visually pleasing completion with a superior performance compared to the reference software. It is important to mention that during these experiments, depth maps provided by the content owners are utilized for fair comparison of VVR tools. As the main goal of stereo-to-multi-view conversion, the proposed algorithms are further compared against the reference depth estimation and virtual view rendering software along stereo video. In this case, the disparity maps are estimated from stereo pairs; improvement of the proposed scheme is more observable due to superiority of the proposed stereo matching algorithm. In terms of PSNR, there is almost a 2 dB improvement which is further supported by additional visual quality metrics. Moreover, the proposed approach has less complexity compared to the reference software as well as the remaining edge-aware filters. On the
161
average, the proposed approach yields IW-SSIM value above 0.95, which is one of the best objective visual quality metric modeling human perception for VVR. This result corresponds to 95% correct reconstruction calculated among highly erroneous regions that provides sufficient quality for the conversion of stereo-to-multi-view. In addition to high quality virtual views, efficiency of the presented scheme is another important contribution to the state-of-the-art. Parallel implementation on an Nvidia GTX 480 graphics card is conducted for stereo matching and VVR tools in order to validate the efficiency of the algorithms. For this purpose, special attention is given for each block to map algorithmic structures on independently executable small processing units. According to the current implementation, real-time capability is achieved for SD (720x576) stereo video, where 60 disparity calculations and two VVR operations can be performed for 24 frames per second. These specifications can be modified to adapt presented conversion tool for various resolutions. Compared to the state-of-the-art GPU implementations on the same graphics card, the proposed approach yields a competitive processing power with 1312 MDE per second. Besides, the proposed stereo matching step has also been implemented on SpartanXC6SLX9 FPGA for 3D TV applications providing 60 fps for stereo video with 480 x270 resolutions, which is one of the pioneering attempts for consumer electronics.
6.3
Future Directions
The presented solutions in this dissertation addressing the problem of stereo-to-multiview conversion involve generic steps that can be extended for various applications. Possible directions for the future research related with this study are given as: Permeability Filter: Efficiency of the introduced permeability filter is validated through extensive experiments. Hence, this filter can be utilized for various geometry constrained problems such as segmentation and optic flow in addition to the presented stereo matching solution. Applying permeability filter on RGB channels iteratively, pixel values converge to specific values representing characteristics of separate objects which provides some sort of segmentation. Besides, extending 1D disparity search idea two 2D, optic flow of each pixel can be estimated, as long as two consecutive frames of a video sequence are processed through presented stereo matching algorithm blocks.
162
Apart from 2D models, permeability filter can be extended to 3D filtering for voxel representations, where successive weighted summation can be performed on three main axes (x,y,z) consecutively. This may provide additional applications for volume processing in biomedical image processing or holograms. The performance of the model estimation can be further increased by giving special attention to the permeability weight extraction step. For this purpose, edge detectors can be utilized instead of 4-neighbor or 8-neighbor RGB difference only. Utilization of edge detectors increases edge-awareness of the filter providing more robust results for disparity estimation, occlusion handling, hole completion, segmentation and optic flow estimation. Stereo Matching: Proposed stereo matching algorithm is utilized for the conversion of present stereo video including 3D movies and documentaries. As they are filmed for theaters, imperfections between stereo pairs are limited such that cameras are aligned perfectly, video noise is reduced and disparity range is within certain bounds for better 3D perception. On the other hand, for various applications, such as robotics, stereo content may involve imperfections that require fine tuning and additional modifications to apply proposed stereo matching technique. In this manner, each algorithm block can be modified according to properties of the input content. The extension of the proposed stereo matching algorithm in temporal domain can be achieved in a different way by increasing memory requirement as well as complexity such that cost volume of the previous frame is transferred to the current frame through temporal permeability weights. This approach certainly improves the overall performance of stereo matching due to increased information and 3D permeability filter involving temporal axis. Permeability idea can be applied for well known stereo matching optimization techniques such as Belief Propagation (BP) and Dynamic Programming (DP), to improve their performance and decrease their computational complexity. In this manner, instead of applying iterative updates for BP over cost volume, horizontal and vertical scans can be conducted through permeability weights that carry entire information according to local color variations. Thus, edge-awareness of BP can be improved without any specific segmentation models which do not require any iteration. The well known striking artifact of DP can be removed by utilizing horizontal permeability weights to transfer information between consecutive pixels during optimal path calculation along a scan line. Hence, fusion of the presented scheme with global and semi-global optimization techniques may yield much precise stereo matching with reduced complexity.
163
GPU implementation: As stated in the related chapter, the presented parallel implementation of the proposed stereo-to-multi-view conversion tool can be further optimized to yield faster execution capability. Moreover, development in graphics card technology enables various platforms that lead more computation capacity. Hence, adaptation of the present implementation for improved products is always a direction for future studies.
164
REFERENCES [1] A.Smolic, K. Mueller, P. Merkle, P. Kauff and T. Wiegand, An overview of available and emerging 3D video formats and depth enhanced stereo as efficient generic solution, Picture Coding Symposium , pp 1-4, May 2009. [2] A. A. Alatan, Y. Yemez, et.al, Scene representation technologies for 3DTV - A survey. IEEE Trans. Circuits System. Video Techno. 17(11): pp: 1587-1605 (2007) [3] A.Smolic et'al, Disparity aware stereo 3D production tools, European Conference on Visual Media Production, pp 165-173, November 2011 [4] D. Sharstein and R. Szeliski, A taxonomy and evaluation of dense two-frame stereo correspondence algorithms, International Journal on Computer Vision, Volume 47, pp 7-42, April 2002. [5] C. Cigla and A.A. Alatan, Information Permeability for Stereo Matching, submitted to IEEE Transactions on Image Processing 2012. [6] Olga Veskler, Fast Variable Window for stereo correspondence using integral images, International Conference on Computer Vision and Pattern Recognition, Vol.1 pp 556-561, 2003 [7] Kuk-Jin Yoon and In So Kweon, Adaptive support weight approach for correspondence search, IEEE Transactions on Pattern Analysis and Machine Intelligence, vol. 28, no. 4, pp. 650-656, 2006 [8] Ke Zhang, Jiangbo Lu and Gauthier Lafruit, Cross based stereo matching using orthogonal integral images, IEEE Transactions on Circuits and Systems for Video Technology, Vol. 19 Issue 7, July, 2009 [9] Federico Tombari, Stefano Mattoccia, Luigi Di Stefano, Elisa Addimanda, Classification and evaluation of cost aggregation methods for stereo correspondence, International Conference on Computer Vision and Pattern Recognition, pp 1-8, June, 2008 [10] Liang Wang, Mingwei Gong, Minglun Gong, and Ruigang Yang, How far can we go with local optimization in real-time stereo matching, Proceedings of the Third International Symposium on 3D Data Processing, Visualization, and Transmission, pp 129-136, 2006 [11] A. Hosni, M. Bleyer, M. Gelautz, and C. Rhemann, Local stereo matching using geodesic support weights, International Conference on Image Processing 2009. [12] Pedro F. F. and Daniel P. H., Efficient belief propagation for early vision, International Journal of Computer Vision Vol. 70, No. 1, October 2006.
165
[13] Q. Yang, L. Wang, R. Yang, S. Wang, M. Liao, and D. Nistér. Real-time global stereo matching using hierarchical belief propagation, British Machine Vision Conference 2006 [14]
Kolmogorov and R. Zabih, Computing visual correspondence with occlusions using
graph cuts, International Conference on Computer Vision, pp 508-515, 2001 [15] T. Yu, R.-S. Lin, B. Super, and B. Tang, Efficient message representations for belief propagation, International Conference on Computer Vision, pp 1-8, October 2007 [16] Q. Yang, L. Wang, R. Yang, H. Stewénius, and D. Nistér, Stereo matching with colorweighted correlation, hierarchical belief propagation and occlusion handling, IEEE Transactions on Pattern Analysis and Machine Intelligence, pp 492-504, March 2008. [17] C. Cigla and A.Aydin Alatan, Multi-view dense depth map estimation, International Conference on Immersive Telecommunications, 2009 [18] A. Klaus, M. Sormann and K. Karner, Segment-based stereo matching using belief propagation and a self-adapting dissimilarity measure, International Conference on Pattern Recognition, pp 15-18, 2006. [19] L. Zitnick and S.B. Kang, Stereo for image-based rendering using image oversegmentation, International Journal on Computer Vision, pp 49-65, October 2007. [20] M.Bleyer and M. Gelautz, Graph-based surface reconstruction from stereo pairs using image segmentation, Proc. SPIE vol.5665, pp 288-299, January 2005. [21] H. Tao and H.D.Sawhney, Global matching criterion and color segmentation based stereo, IEEE Workshop Applications of Computer Vision, pp: 246-253, 2000. [22] C. Cigla, X.Zabulis and A.A. Alatan, Region-based dense depth extraction from multiview video, International Conference on Image Processing, September 2007. [23] Sang Yoon Park, Sang Hwa Li, and Nam Ik Cho, Segmentation based disparity estimation using color and depth information, International Conference on Computer Vision pp 3275-3278, October 2004. [24] M. Bleyer and M. Gelautz, A layered stereo algorithm using image segmentation and global visibility constraints, International Conference on Image Processing, pp 2997-3000, October 2004. [25] O. Veksler, Stereo correspondence by dynamic programming on a tree, International Conference on Computer Vision and Pattern Recognition, pp 384-390, 2005 [26] L. Wang, M. Liao, M. Gong, R. Yang, and D. Nistér, High-quality real-time stereo using adaptive cost aggregation and dynamic programming, International Symposium on 3D Data Processing Visualization and Transmission, pp 798-805, June 2006
166
[27] J. Salmen, M. Schlipsing, J. Edelbrunner, S. Hegemann, and S. Lueke, Real-time stereo vision: making more out of dynamic programming, Computer Analysis of Images and Patterns, pp 1096-1103, 2009 [28] H. Hirschmüller, Stereo processing by semi-global matching and mutual information, IEEE Transactions on Pattern Analysis and Machine Intelligence, pp 328-341, February 2008 [29] Minglun Gong and Yee-Hong Yang, Real-time stereo matching using orthogonal reliability based dynamic programming, IEEE Transactions on Image Processing, Vol. 16 No.3, March 2007 [30] W. Yu, T. Chen, F. Franchetti, and J. Hoe, High performance stereo vision designed for massively data parallel platforms, IEEE Transactions on Circuits and Systems for Video Technology, pp 1509-1519, November 2010. [31] M. Humenberger, C. Zinner, M. Weber, W. Kubinger, and M. Vincze, A fast stereo matching algorithm suitable for embedded real-time systems, Computer Vision and Image Understanding, pp 1180-1202, November 2010. [32] A. Ansar, A. Castano and L. Matthies, Enhanced real time stereo using bilateral filtering, International Symposium on 3D Data Processing Visualization and Transmission, pp 455-462, September 2004 [33] Wei Yu, Tsuhan Chen, James C. Hoe, Real time stereo vision using exponential step cost aggregation on GPU, International Conference on Image Processing, pp 4281-4284, September, 2009 [34] K. Zhang, J. Lu, G. Lafruit and F. Catthorr, Real-time stereo matching: A cross-based local approach, IEEE International Conference on Acoustics, Speech and Signal Processing, pp 733-736, April 2009 [35] R. Yang, M. Pollefeys and S. Li, Improved real-time stereo on commodity graphics hardware, Proceedings of the Conference on Computer Vision and Pattern Recognition Workshop, Vol.3, 2004 [36] M. Adam , C.Jung , S. Roth , G. Brunnett, Real time stereo image stitching using GPU-based belief propagation, Proceedings of Vision, Modeling, and Visualization Workshop, pp 215-224, Novemer 2009 [37] X. Mei, X.Sun, M.Zhou, S. Jiao, H. Wang and Z. Zhang, On building an accurate stereo matching system on graphics hardware, GPUCV pp 467-474, November 2011 [38] D. Sharstein and R. Szeliski, Stereo matching with non-linear diffusion, International Journal on Computer Vision, pp 343-350, June 1998
167
[39] L. De-Maeztu, S. Mattoccia, A. Villanueva and R. Cabeza, Efficient aggregation via iterative block-based adapting support weights, International Conference on 3D, 2011 [40] H. Hirschmüller and D. Scharstein. Evaluation of stereo matching costs on images with radiometric differences. IEEE Transactions on Pattern Analysis and Machine Intelligence, 31(9):1582-1599, September 2009 [41] R. Zabih and J. Woodfill, Non-parametric local transforms for computing visual correspondence, in Proc. 3rd Eur. Conf. Comput. Vision, pp. 150–158 1994. [42] Chang, N.Y.-C. Tsung-Hsien Tsai Bo-Hsiung Hsu Yi-Chun Chen Tian-Sheuan Chang, Algorithm and architecture of disparity estimation with mini-census adaptive support weight, IEEE Transactions on Circuits and Systems for Video Technology, pp 792-805, June 2010. [43] C. Cigla and A.Aydın Alatan, Temporally consistent dense depth map estimation via belief propagation, 3DTV Conference, pp 1-4, May 2009 [44] M. Tanimoto, T. Fujii, and M. Panahpour, Depth estimation reference software DERS 5.0, Rep. M16923, Oct. 2009. [45] Tomassi, C., Manduchi, R. Bilateral filtering for gray and color images, In International Conference on Computer Vision, pp 839-846, Januay 1998 [46] Aurich, V., Weule, J. Non-linear gaussian filters performing edge preserving diffusion, In Mustererkennung 17. DAGM-Symposium, pp 538–545, Springer-Verlag 1995. [47] K. He, J. Sun, and X. Tang. Guided image filtering, In European Conference on Computer Vision, pp 1-14 2010. [48] E. Elboher and m. Werman, Cosine integral images for fast spatial and range filtering, In International Conference on Image Processing, pp 89-92, September 2011. [49] P. Perona and J. Malik, Scale-space and edge detection using anisotropic diffusion IEEE Transactions Pattern Analysis Machine Intelligence, vol. 12, no. 7, pp. 629–639, July 1990. [50] J. Weickert, Anisotropic diffusion in image processing, Tuebner Stuttgart, 1998. ISBN 3-519-02606-6. [51] D. Barash, Bilateral filtering and anisotropic diffusion: towards a unified viewpoint, In International Conference on Scale Space and Morphology, pp 273-280, 2001. [52] Paris, S., Durand, F. A fast approximation of the bilateral filter using a signal processing approach, In European Conference on Compıter Vision pp 24-52, January 2006 [53] Levin, A., Lischinski, D., Weiss, Y. A closed form solution to natural image matting, International Conference on Computer Vision and Pattern recognition, pp 228-242, February 2008
168
[54] Wong, W.C.K., Chung, A.C.S., Yu, S.C.H. Trilateral filtering for biomedical images, In International Symposium on Biomedical Imaging pp 820-823, April 2004 [55] Petschnigg, G., Agrawala,M., Hoppe, H., Szeliski, R., Cohen, M., Toyama, K. Digital photography with flash and no-flash Image Pairs, In Siggraph. Volume 23, pp 664-672, August 2004 [56] Levin, A., Lischinski, D., Weiss, Y.Colorization using optimization, In SIGGRAPH pp 689-694, August 2004 [57] Farbman, Z., Fattal, R., Lischinski, D., Szeliski, R. Edge-preserving decompositions for multi-scale tone and detail manipulation, In SIGGRAPH August 2008 [58] Yoon, K.J., Kweon, I.S. Adaptive support-weight approach for correspondence search, Pattern Analysis and Machine Intelligence pp 650–656, April 2006 [59]
Bennett, E.P., Mason, J.L., McMillan, L. Multispectral bilateral video fusion, In:
Transactions on Image Processing Volume 16, pp1185–1194, 2007 [60]
Winnemoller, H., Olsen, S.C., Gooch, B. Real-time video abstraction, In: Siggraph.
Volume 25, pp 1221–1226, 2006 [61] Xiao, J., Cheng, H., Sawhney, H., Rao, C., Isnardi, M. Bilateral filtering-based optical flow estimation with occlusion detection, In ECCV, pp 211-224, 2006 [62] Yang, Q., Yang, R., Davis, J., Nister, D., Spatial-depth super resolution for range images, In: CVPR pp 1-8, June 2007 [63] Porikli, F. Constant time O(1) bilateral filtering, In CVPR, pp 1-8 June 2008 [64] Qingxiong Y., Kar-Han T. Ahuja, N. Real-time O(1) bilateral filtering, in CVPR , pp 557-564, June 2009. [65] Wei. Y., et’al. Fast bilateral filtering by adaptive block size, in ICIP, September 2010. [66] Elad, M. On the bilateral filter and ways to improve it, IEEE Transactions On Image Processing, pp 1141–1151, 2002 [67] Chen, J., Paris, S., Durand, F. Real-time edge-aware image processing with the bilateral grid, In: Siggraph.Volume 26, July 2007 [68] Pham, T.Q., van Vliet, L.J. Separable bilateral filtering for fast video preprocessing, In: International Conference on Multimedia and Expo, July, 2005 [69] William T. Freeman and EdwardH. Adelson, The design and use of steerable filters, IEEE Transcations on Pattern Analysis and Machine Intelligence, September 1991. [70] F.C. Crow, Summed-area tables for texture mapping, in Proceedings of the 11th annual conference on Computer graphics and interactive techniques. ACM, pp. 207–212, 1984.
169
[71] G. Borgefors, Distance transformations in digital images, Computer Vision, Graphics and Image Processing, vol. 34, no. 3, pp. 344–371, 1986. [72] Olga Veksler, Fast variable window for stereo correspondence using integral images, in CVPR pp 556-561, 2003. [73] G. Economou, V. Pothos, and A. Ifantis. Geodesic distance and MST based image segmentation. In XII European Signal Processing Conference, pp 941–944, 2004. [74] A. Criminisi, T. Sharp, and A. Blake. Geos: geodesic image segmentation. In ECCV, pp 99–112, 2008. [75] Hosni A., Bleyer M., Gelautz M., Image segmentation via iterative geodesic averaging, In International Conference on Image and Graphics pp 250-255, 2009. [76] Sethian, J.A.: Fast marching methods, SIAM Rev. 41 1999 [77] H. Y. Shum and S. B. Kang, A review of image based rendering techniques, IEEE/SPIE Visual Communications and Image Processing 2000 [78] M. Levoy and P. Hanrahan, Light field rendering, Proceedings of SIGGRAPH '96 [79] C. Buehler, M. Bosse, L. McMillan, S. Gortler, M. Cohen, Unstructured lumigraph rendering, International Conference on Computer Graphics and Interactive Techniques,1996 [80] S. Avidan and A. Shashua, Novel view synthesis in tensor space, In Conference on Computer Vision and Pattern Recognition, pages 1034–1040, June 1997. [81] Y. J. Jeong, Y. J. Jung and D. Park, Depth image based rendering for multi-view generation, SID International Sympossium, pp 310-316, April 2010 [82] L. Zhang and W. J. Tam, Stereoscopic image generation based on depth images for 3DTV, IEEE Trans. Broadcast., vol. 51, pp. 191–199, June 2005. [83] R. Szeliski, Video mosaics for virtual environments, IEEE Comput. Graphics Appl. 16 pp 22–30, 1996 [84] W. Mark, L. McMillan, and G. Bishop, Post-rendering 3d warping, In Proc. Symposium on I3D Graphics, pp 7–16, 1997. [85] W. Y. Chen, Y. L. Chang, S. F. Lin, L. F. Ding, and L. G. Chen, Efficient Depth Image Based Rendering with Edge Dependent Depth Filter and Interpolation, in Proc. IEEE Int. Conf. Multimedia and Expo, pp. 1314–1317, July 2005 [86] Y. K. Park, K. Jung, Y. Oh, S. Lee, J. K. Kim, G. Lee, H. Lee, K. Yun, N. Hur, and J. Kim, Depth-image-based rendering for 3DTV service over T-DMB, signal process, Image Commun., vol. 24, pp. 122–136, January 2009 [87] I. Daribo, C. Tillier, and B. Pesquet-Popescu, Distance dependent depth filtering in 3D warping for 3-DTV, in Proc. IEEE 9th Workshop Multimedia Signal Process. MMSP, pp. 312–315, October 2007.
170
[88] O. Gangwal and R. Berretty, Depth map post processing for 3D TV, International Conference on Consumer Electronics, pp. 1-2, June 2009 [89] I. Daribo and H. Saito, Bilateral depth discontinuity filter for novel view synthesis, in Proc. IEEE Workshop Multimedia Signal Process. MMSP, pp 145-149, October 2010. [90] P. J. Lee and Effendi, Non-geometric distortion smoothing approach for depth map processing, IEEE Transactions on Multimedia Vol.13, No.2 April 2011. [91] D. V. S. X. De Silva, E. Ekmekcioglu, W. A. C. Fernando and S. T. Worall, Display dependent preprocessing of depth maps based on just noticeable depth difference modeling, IEEE Journal of Selected Topics in Signal Processing Vol. 5 No.2 pp 335-351, April 2011 [92] A. Criminisi , P. Pérez , K. Toyama, Region filling and object removal by exemplar based image inpainting, IEEE Transactions on Image Processing, pp 1200-1212, September 2004 [93] L. Wang, H. Jin, R. Yang and M. Gong, Stereoscopic inpainting: joint color and depth compliation from stereo images, International conference on Computer Vision and Pattern Recognition, June 2008 [94] Luat Doa, Sveta Zingera and Peter H.N. de With, Quality improvement techniques for free-view point DIBR, Proceedings of SPIE Vol. 7524, pp 1-4, May 2010 [95] K. J. Oh, S. Yea, Y. S. Ho, Hole filling method using depth based inpainting for freeview synthesis in FTV and 3D television, Picture Coding Symposium, pp 233-236, 2009 [96] S. Rogmann, J. Lu, P. Beerkant, G. Lafruit, Real time stereo based view synthesis algorithms- A unified framework and evaluation on GPUs, Image Communication Volume 24 , Issue 1-2, Pages: 49-64 , January 2009 [97] P. Kauff et’al, Depth map creation and image based rendering for advance 3DTV services providing interoperability and scalability, Image Communication Vol. 22, Issue 2 pages 217-234, February 2007. [98] M. Tanimoto, T. Fujii, K. Suzuki, N. Fukushima, and Y. Mori, Reference softwares for depth estimation and view synthesis,”Rep. M15377, Apr. 2009. [99] H.C. Shin, Y.C. Kim, H. Park and J. Park, Fast view synthesis using GPU, IEEE Transactions on Consumer Electronics, Vol. 54 No. 4, November 2008 [100] Z. Arıcan, S. Yea, A. Sullavian and A. Vetro, Intermediate view generation for percieved depth adjustment of stereo video, Proceedings of SPIE, August 2009 [101] S. Zinger, L. Do and P. H. N. de With, Free-viewpoint depth image based rendering, Journal of Visual Communication and Image Representation, Vol. 21 Issue 5-6, 2010
171
[102] Pei-Kuei Tsung, Pin-Chih Lin, Li-Fu Ding, Shao-Yi Chien, and Liang-Gee Chen, Single iteration view interpolation for multi-view video applications, International Conference on Image Processing, pp 1-4, May 2008. [103] K. Müller, A. Smolic, K. Dix, P. Merkle, P. Kauff, and T. Wiegand, View synthesis for advanced 3D video systems, EURASIP Journal on Image and Video Processing, November 2008. [104] P. N. Nya, M. Köppel, D. Doshkov, H. Lakshman, P. Merkle, K. Müller and T. Weigand, Depth image based rendering with advanced texture synthesis for 3D video, IEEE Transactionos on Multimedia Vol.13, No.3 June 2011. [105] M. Solh and G. Alregib, Hierarchical hole filling: depth image based rendering without depth map filtering for 3D-TV, in Proc. IEEE Workshop Multimedia Signal Process. MMSP, pp 87-92, October 2010. [106] H. Furihata, T. Yendo, M. P. Tehrani, T. Fujii and M. Tanimoto, Novel view synthesis with residual error feedback for FTV, Proceedings of SPIE, Stereoscopic Displays and Applications XXI, 2010. [107] Ulrich Faker, Marcus Barkowsky and Andre Kaup, Histogram based pre-filtering for luminance and chrominance compensation of multi-view video IEEE Transactions on Circuits and Systems for Video Technology, Vol 18 No 9, September 2008. [108] C. Cigla and A. A. Alatan, Efficient edge preserving stereo matching, ICCV LDRMC Workshop pp 696-699, November 2011. [109] C. Cigla and A. A. Alatan, Edge aware stereo matching with O(1) complexity, SPIE 3D Image Processing Conference, January 2012. [110] A.K. Jain, L.C. Tran, R. Khoshabeh, and T.Q. Nguyen, Efficient stereo-to-multiview synthesis, IEEE Int. Conf. Acoustics, Speech, Sig. Process., pp. 889-892, May 2011. [111] http://vision.middlebury.edu/stereo/ Last accessed on 18/06/2012 [112] I. Feldmann et al., HHI test material for 3D video, ISO/IEC JTC1/ SC29/WG11 Doc. M15413, Apr. 2008. [113] ftp://203.253.128.142, Gwangju Institute of Science and Technology (GIST), 1 Oryong-dong, Buk-gu, Gwangju, 500-712, Republic of Korea. [114] http://www.tanimoto.nuee.nagoya-u.ac.jp/~mpegftv/mpeg3dv/CfP/,Nagoya University, Japan, Last accessed on 18/06/2012 [115] Z. Wang, A. C. Bovik, H. R. Sheikh, and E. P. Simoncelli, Image quality assessment: from error visibility to structural similarity, IEEE Trans. on Image Processing, vol. 13, no. 4, pp 600-612, April 2004.
172
[116] Z. Wang, L. Lu and A. C. Bovik, Video Quality assessment based on structural distortion measurement, Signal Processing Image Communications Vol. 19, No.1, January 2004 [117] Z. Wang and Q. Li, Information content weighting for perceptual image quality assessment, IEEE Trans. on Image Processing vol. 20 No.5 ,May 2011 [118] E. Bosc, R. Pepion, P. Callet, M. Köppel, P. N. Nya, M. Pressigout and L. Morin, Towards a new quality metric for 3-D synthesized view assessment, IEEE Journal of Selected topics in Signal Processing, Vol. 5, no. 7, November 2011 [119]
Nvidia CUDA. http://developer.nvidia.com/object/cuda.html. Last accessed on
18/06/2012 [120]
S. Ryoo, C. Rodrigues, S. Baghsorkhi, S. Stone, D. Kirk, and W. Hwu, Optimization
principles and application performance evaluation of a multithreaded GPU using CUDA, In Proc. 13th ACM SIGPLAN Symposium on Principles and practice of parallel programming, 2008. [121]
R. Kalarot, J. Morris, D. Berry and J. Dunning, Analysis of real-time stereo vision
algorithms on GPU, International Conference on Image and Vision Computing January 2011 [122]
R. Kalarot and J. Morris, Implementation of symmetric dynamic programming stereo
matching algorithm using CUDA, in Proc. 16th Korea-Japan Joint Workshop on Frontiers of Computer Vision, 2010. [123]
I. Ernst and H. Hirschmuller, Mutual information based semi-global stereo matching
on the GPU, in Advances in Visual Computing, pp. 228–239, 2008. [124] M. Weber, M. Humengerger and W. Kuninger, A very fast census-based stereo matching implementation on a graphics processing unit, IEEE ICCV Workshops, pp 786793, October 2009 [125]
C. Richardt, D. Orr, I. Davies, A. Criminisi and N. A. Dodgson, Real-time spatio-
temporal stereo matching using dual-cross-bilateral grid, European Conference on Computer Vision, pp 510-523, 2010 [126]
Y. Zhao, G. Taubin, Real-time stereo on GPGPU using progressive multi-resolution
adaptive windows, Elsevier Image and Vision Computing, pp 420-432, 2011 [127]
K. Zhang, J. Lu, Q. Yang, G. Lafruit, R. Lauwereins and L.V. Gool, Real-time and
accurate stereo: a scalable approach with bitwise fast voting on CUDA, IEEE Transactions on Circuits and Systems for Video Technology, pp 867-878, July 2011 [128]
A. Hosni, M. Bleyer and M. Gelautz, Near real-time stereo with adaptive support
weight approaches, Proceedings of the Third International Symposium on 3D Data Processing, Visualization and Transmission 2010
173
[129]
L. De-MAetzu, A. Villanueva and R. Cabeza, Near real-time stereo matching using
geodesic diffusion, IEEE Transactions on PAMI, pp 410-416, February 2012 [130]
J. Lu, S. Rogmans, G. Lafruit and F. Catthoor, Stream-centric stereo matching and
view synthesis: A high-speed approach on GPUs, IEEE Transactions on Circuits and Systems for Video Technology, pp 1598-1611, November 2009 [131]
M. Sizintsev, S. Kuthirummal, H. Sawhney, A. Chaudhry, S. Samarasekera and R.
Kumar, GPU accelerated real-time stereo for augmented reality, In Proceedings of the 5th International Symposium 3D Data Processing, Visualization and Transmission (3DPVT), 2010 [132]
K.-J. Yoon and I. S. Kweon, Stereo matching with the distinctive similarity measure,
ICCV pp 1-7, October 2007. [133]
D. Min and K. Sohn, Cost aggregation and occlusion handling with WLS in stereo
matching, IEEE Transactions on Image Processing, pp 1431-1442, August 2008. [134]
C. Rhemann, A. Hosni, M. Bleyer, C. Rother, and M. Gelautz. Fast cost-volume
filtering for visual correspondence and beyond, CVPR, pp 3017-3024, June 2011. [135]
S. Mattoccia, S. Giardino, and A. Gambin, Accurate and efficient cost aggregation
strategy for stereo correspondence based on approximated joint bilateral filtering. ACCV, pp 371-380, 2009. [136]
D. Min, J. Lu, and M. Do, A revisit to cost aggregation in stereo matching: how far
can we reduce its computational redundancy, ICCV, pp 1567-1574, November 2011. [137]
A. Aysu, M. Sayınta, C.Cigla and A.A.Alatan, Stereo matching system design on
low-cost FPGAs for 3D-TV Applications, in preparation. [138] http://www.daurov-stereo.ru/ Last accessed on 18/06/2012
174
VITA
PERSONAL INFORMATION Surname, Name: Cevahir Çığla Date and Place of Birth: 18 April 1982, Enez Email:
[email protected],
[email protected]
EDUCATION
M.S. (09/2005 - 07/2007) Department of Electrical and Electronics Engineering Middle East Technical University, Ankara, Turkey
B.S. (09/2000 - 06/2005) Department of Electrical and Electronics Engineering Middle East Technical University, Ankara, Turkey
Minor Programme on Mathematics (09/2002-06/2005) Department of Mathematics Middle East Technical University, Ankara, Turkey
WORK EXPERIENCE 06/2012 - present As a design engineer in ASELSAN Military Electronics 05/2008 - 06/2012 As a design architect and research fellow in VESTEK, a Research and Development company providing solutions for consumer electronics. 1. Designed real-time stereo disparity estimation algorithm for 3D TVs, implemented in CUDA and supported FPGA implementation
175
2. Designed color calibration algorithm in stereo videos for 3D TVs implemented in CUDA and supported FPGA implementation 3. Designed local contrast enhancement tool for LCD TVs implemented in CUDA and supported FPGA implementation 4. Designed algorithms for: Depth compensated noise reduction Depth data up-sampling and disparity range detection in stereo video Local dimming for LED displays Saliency (attention) map extraction Efficient On Screen Display (OSD) placement in stereo video Virtual view rendering in stereo/multi-view video 3D Frame Rate Up Conversion
06/2005 - 05/2008 As a researcher in Multimedia Research Group at METU/EEE Department in 3DTV Network of Excellence European 6th Frame Project 1. Stereo and multi-view depth extraction by dynamic programming. 2. Image Segmentation algorithm by region-based graph-cuts. 3. Watermark extraction from light field rendered images. 4. Segment-based stereo and multi-view dense depth map estimation. 5. Video object segmentation from multi-view data. 6. Organizing Committee of 3DTV Conference, 2008
PUBLICATIONS Master Thesis
“Dense Depth Map Estimation for Object Segmentation in Multi-view Video”, July 2007
Patents
Alper Koz, Cevahir Çığla and A.Aydın Alatan;"Watermark Detection Method for Free-view Television" Europe Patent Application 06809509.0, 2006
176
Cevahir Çığla; “Saliency Based Video Contrast Enhancement Method”, Europe Patent Application 2218 - 10189560.5, 2010
Cevahir Çığla and Can Çaycı; “Black and White Stretch Algorithm for Dynamic Range Extension”, Europe Patent Application 11156605.5, 2010
Cevahir Çığla; “Depth Compensated Noise Reduction in Multi-view Video”, Europe Patent Application 2218 - 10189764.3, 2010
Emrah TaĢlı and Cevahir Çığla; “A Method for Local Dimming Boost Up using Salient Features”, Turkey Patent 1241 - 10196045.8, 2010
Cevahir Çığla; “Disparity Range Detection for Stereo and Multi-view Video”, Turkey Patent 2010/ G289618, 2010
Cevahir Çığla; “Depth Data Up-Sampling via Adaptive Support Window”, Turkey Patent 2010/ G289621, 2010
Cevahir Çığla and A.Aydın Alatan; “Information Permeability Based Disparity Estimation in Stereo-Video” Turkey Patent 2010/ G289620
Cevahir Çığla "Stereo Video Color Calibration Method and Device for 3D TV Systems " Turkey Patent 1241 - 10196045.8, 2010
Cevahir Çığla "Depth Map Post Processing for Un-textured Surfaces" Europe Patent Application 11189515.7 and Turkey Patent Application R201107846, 2011
Cevahir Çığla, A.Aydın Alatan, Eren Somçağ and Murat Sayınta "Hardware Friendly Stereo Matching" Pending 2011
Cevahir Çığla, "Text Aware Post Processing for Virtual View Synthesis" Pending 2011
Cevahir Çığla, "Edge Aware Attention Detection in Video" Pending 2011
Journal Papers
Cevahir Çığla and A.Aydın Alatan, “Information Permeability for Stereo Matching” under review IEEE Transactions on Image Processing, 2012.
Cevahir Çığla and A.Aydın Alatan, “An Efficient Geo-Consistent Edge-Aware Filter” under review IEEE Transactions on Circuits and Systems for Video Technology, June 2012.
Emrah TaĢlı, Cevahir Çığla and A.Aydın Alatan, “Efficient Super-pixel Extraction via Convexity Induced Boundary Adaptation” under review IEEE Transactions on Image Processing, May 2012.
Alper Koz, Cevahir Çığla and A.Aydın Alatan,” Free-view Watermarking for Freeview Television” IEEE Transactions on Image Processing, June, 2010.
177
Conference Papers 2012
A. Aysu, M. Sayınta, C. Çığla and A.A. Alatan “Stereo Matching System on Low Cost FPGAs for 3D -TV Applications” submitted to VLSI-SoC , 2012.
Cevahir Çığla and A.Aydın Alatan “3B TV için Gerçek Zamanlı Stereo Eşleme Algoritması” in Sinyal Isleme ve Uygulamaları Konferansı, 2012.
Cevahir Çığla and A.Aydın Alatan “Çoklu Görüntü için Simetrik Olmayan Derinlik Kestirimi” in Sinyal Isleme ve Uygulamaları Konferansı, 2012.
Cevahir Çığla, Emrah TaĢlı and A.Aydın Alatan “Görüntü Bölütleme için Etkin Süper Piksel Çıkarımı” in Sinyal Isleme ve Uygulamaları Konferansı, 2012.
Cevahir Çığla and A.Aydın Alatan “Edge-Aware Stereo Matching” in SPIE 3D Image Processing and Applications, January 2012.
2011
Cevahir Çığla and A.Aydın Alatan “Efficient Edge-Preserving Stereo Matching” in ICCV Workshop on Live Dense Reconstruction from Moving Cameras, 2011.
2010
Cevahir Çığla and A.Aydın Alatan “Efficient Graph Based Image Segmentation via Speeded-Up Turbo Pixels” in IEEE International Conference on Image Processing 2010.
2009
Cevahir Çığla and A.Aydın Alatan “Multiple Depth Map Estimation from Multi-view Video” in International Conference on Immersive Telecommunications 2009.
Cevahir Çığla and A.Aydın Alatan “Temporally Consistent Depth Map Estimation via Belief Propagation” in 3D TV Conference 2009.
2008
Cevahir Çığla and A.Aydın Alatan “Region-Based Image Segmentation via Graph Cuts” in IEEE International Conference on Image Processing 2008.
Cevahir Çığla and A.Aydın Alatan “Region-Based Object Segmentation in Multi-view Video” in IEEE International Conference on Image Processing 2008.
Alper Koz, Cevahir Çığla and A.Aydın Alatan “Watermarking For Image-Based Rendering via Homography-Based Virtual Camera Location Estimation” in IEEE International Conference on Image Processing 2008.
Cevahir Çığla and A.Aydın Alatan “Depth Assisted Object Segmentation in Multi-view Video” in 3D TV Conference 2008.
178
Cevahir Çığla and A.Aydın Alatan “Bölge Tabanli Düzgeli Kesik Görüntü Bölütleme” (in Turkish) in SIU 2008 (2nd best paper), Turkey.
2007
Cevahir Çığla, Xenophon Zabulis and A.Aydın Alatan “Region-Based Dense Depth Extraction From Multi-view Video” in International Conference on Image Processing (ICIP) 2007,Texas/USA
Cevahir Çığla, Xenophon Zabulis and A.Aydın Alatan “Segment-Based StereoMatching via Plane and Angle Sweeping” in 3DTV Conference (3DTVCon), 2007 Greece
Alper Koz, Cevahir Çığla and A.Aydın Alatan “Watermarking for Light Field Rendering” in European Signal Processing Conference (EUSIPCO), 2007 Poland
2006
Alper Koz, Cevahir Çığla and A.Aydın Alatan “Free-view Watermarking for FreeView Television” in International Conference on Image Processing (ICIP) 2006, Atlanta/USA
179