Reality-Based 3D Modeling, Segmentation and Web-Based Visualization Anna Maria Manferdini1 and Fabio Remondino2 1
DAPT Department, University of Bologna, Italy
[email protected] 2 3D Optical Metrology Unit, FBK Trento, Italy
[email protected]
Abstract. One of the most significant consequences of the introduction of digital 3D modeling in the Cultural Heritage field is the possibility to use 3D models as highly effective and intuitive means of communication as well as interface to share and visualize information collected in databases. Due to the usual complexity of architectural and archaeological artifacts or sites, their digital models need be subdivided in sub-components and organized following semantic definitions in order to facilitate data retrieval. This paper outlines a methodology to semantically segment complex reality-based 3D models, annotate information and share the results within online open-source tools. The segmentation stage to subdivide and organize 3D models is based on both automated and manual methods, giving priority to automated procedures that can ease and speed these steps but not neglecting the user intervention to achieve accurate results. The segmented 3D models are then visualized in web-based systems to allow data access to a wider range of users and enlarge knowledge. The methodology is presented and tested on large and complex reality-based 3D models of architectural and archaeological heritage structures. Keywords: 3D modeling, photogrammetry, laser scanning, semantic, segmentation, web-based visualization.
1 Introduction During the last years, in the Cultural Heritage field, the availability of digital collections of 3D data acquired and returned in form of 3D reproductions has represented a fundamental change in our cognitive model and working approach. Indeed the availability of 3D digital replicas, compared to standard 2D photos or video or drawings, generally communicate in a more effective way information about scenes or objects that have intrinsic 3D characteristics. Moreover if metric, accuracy and photo-realism are also taken into consideration, the 3D models are of course a powerful tool in particular for archaeological and architectural applications. Indeed the opportunity given by the 3D world changes the way we can access and exchange knowledge, leads us to the recognition of connections and enlarges the possibilities to interpret and analyze the past. The trend of digitally and faithfully model in three dimensions visual Cultural Heritages helps to simulate reality in a more objective and reliable way and M. Ioannides (Ed.): EuroMed 2010, LNCS 6436, pp. 110–124, 2010. © Springer-Verlag Berlin Heidelberg 2010
Reality-Based 3D Modeling, Segmentation and Web-Based Visualization
111
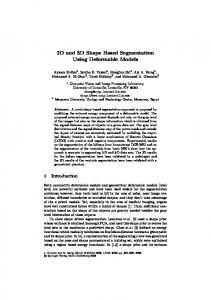
Fig. 1. The developed pipeline to (i) create reality-based 3D models, (ii) segment the geometry according to its sub-elements, (iii) define the hierarchical organization and (iv) visualize the results with an open-source 3D web-based tool
provides the opportunity to use digital 3D models for different purposes that can change through time. Recently an interesting opportunity offered by 3D models is to use them either as visualization container or as highly intuitive interface between different kinds of information. Given their usual geometric complexity and the possibility to link them to a wide range of data, 3D models can be analyzed in detail, split in their sub-components and organized following semantic rules in order to ease data retrieval. For example, following this idea, the Building Information Model (BIM) and CityGML concept were created to describe building components with respect to their geometry, topology and semantic information. The aim of the paper is to show a research pipeline (Fig. 1) developed to allow the use of reality-based 3D digital models as highly intuitive and effective graphic interface to access, share and communicate different kinds of information related to Cultural Heritage. The reality-based 3D models are produced with range-based, image-based or CAD modeling techniques. Each 3D model can contains different levels of geometry and need therefore to be semantically segmented and organized in different ways. As we employ real 3D models of complex scenes, the segmentation is often user-assisted to better recognize sub-elements and define their hierarchical organization. The semantic models and their components are then visualized in a 3D webbased open-source system to allow geo-referencing, querying and data sharing. The developed methodology was tested on different digital models (Fig. 2) produced within previous research projects undertaken for different aims. Results are shown throughout the article in order to explain recurrent problems and adopted solutions.
2 Reality-Based 3D Modeling The continuous development of new sensors, data capture methodologies, multiresolution 3D representations and the improvement of existing ones are contributing significantly to the documentation, conservation and presentation of heritage information and to the growth of research in the Cultural Heritage field. This is also driven by the increasing requests and needs for digital documentation of heritage sites at different scales and resolutions for successive applications like conservation, restoration, visualization, education, data sharing, 3D GIS, etc. 3D surveying and modeling of scenes or objects should be intended as the entire procedure that starts with the data acquisition, geometric and radiometric data processing, 3D information generation
112
A.M. Manferdini and F. Remondino
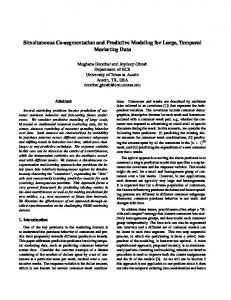
Fig. 2. Typical examples of reality-based 3D polygonal models realized for documentation, conservation and analyses purpose: a) range-based 3D reconstruction of an underground frescoed Etruscan tomb in the UNESCO site of Tarquinia, Italy; b) range-based 3D model of a corner mask in the UNESCO archaeological area of Copan, Honduras; c) CAD 3D model of the House of the Surveyors of Claude-Nicolas Ledoux; d) aerial image-based 3D reconstruction of the Angkor Wat temple, Cambodia; e) image- and range-based 3D model of the law code inscription in Gortyna, Crete; range-based 3D survey of a medieval castle in Trentino, Italy
and digital model visualization. A technique is intended as a scientific procedure (e.g. image processing) to accomplish a specific task while a methodology is a combination of techniques and activities joined to achieve a particular task in a better way. Reality-based surveying techniques (e.g. photogrammetry, laser scanning, etc.) [1] employ hardware and software to metrically survey the reality as it is, documenting in 3D the actual visible situation of a site by means of images [2], range-data [3, 4],
Reality-Based 3D Modeling, Segmentation and Web-Based Visualization
113
CAD drawing and maps (5), classical surveying (GPS, total station, etc.) or an integration of the aforementioned techniques [6, 7, 8]. Non-real approaches are instead based on computer graphics software (3D Studio, Maya, Sketchup, etc.) or procedural modeling [9, 10] and they allow the generation of 3D data without any metric survey as input or knowledge of the site. 2.1 Range-Based 3D Reconstruction Optical range sensors like pulsed (TOF), phase-shift or triangulation-based laser scanners and stripe projection systems have received in the last years a great attention, also from non-experts, for 3D documentation and modeling purposes. These active sensors deliver directly ranges (i.e. distances thus 3D information in form of unstructured point clouds) and are getting quite common in the heritage field, despite their high costs, weight and the usual lack of good texture. During the surveying, the instrument should be placed in different locations or the object needs to be moved in a way that the instrument can see it under different viewpoints. Successively, the 3D raw data needs errors and outliers removal, noise reduction and the registration into a unique reference system to produce a single point cloud of the surveyed scene or object. The registration is generally done in two steps: (i) manual or automatic raw alignment using targets or the data itself and (ii) final global alignment based on Iterative Closest Points (ICP) or Least Squares method procedures. After the global alignment, redundant points should be removed before a surface model is produced and textured. Generally range-based 3D models are very rich of geometric details and contain a large number of polygonal elements, producing problems for further (automated) segmentation procedures. 2.2 Image-Based 3D Reconstruction Image data require a mathematical formulation to transform the two-dimensional image measurements into three-dimensional information. Generally at least two images are required and 3D data can be derived using perspective or projective geometry formulations. Image-based modeling techniques (mainly photogrammetry and computer vision) are generally preferred in cases of lost objects, monuments or architectures with regular geometric shapes, small objects with free-form shape, low-budget project, mapping applications, deformation analyses, etc. Photogrammetry is the primary technique for the processing of image data. Photogrammetry, starting from some measured image correspondences, is able to deliver at any scale of application metric, accurate and detailed 3D information with estimates of precision and reliability of the unknown parameters. The image-based pipeline steps can be performed in an automated or interactive way, according to the user requirements and project specifications. Accurate feature extraction from satellite and aerial images is still a manually driven procedure while in terrestrial applications more automation is available for scene 3D reconstruction. Fully automated 3D modeling methods based on a 'structure from motion' approach [11, 11, ARC 3D Webservice, Microsoft Photosynth, Autodesk Photofly) are getting quite common in the 3D heritage community, although primarily useful for visualization, object-based navigation, annotation transfer or
114
A.M. Manferdini and F. Remondino
image browsing purposes and not for metric and accurate 3D modeling purposes. The dense 3D reconstruction step can instead be performed in a fully automated mode with satisfactory results [13, 14, 15]. But the complete automation in image-based modeling is still an open research's topic, in particular in case of complex heritage scenes and man-made objects [16] although the latest researches reported quite promising results [17]. 2.2 CAD-Based 3D Reconstruction This is the traditional approach and remains the most common method in particular for architectural structures, constituted by simple geometries. These kinds of digital models are generally created using drawings or predefined primitives with 2D orthogonal projections to interactively build volumes. In addition, each volume can be either considered as part of adjacent ones or considered separated from the others by non-visible contact surfaces. Using CAD packages, the information can be arranged in separate layers, each containing different type of elements, which help the successive segmentation phase. The segmentation, organization and naming of CAD models and their related sub-components generally require the user’s intervention to define the geometry and location of subdivision surfaces, as well as to recognize rules derived e.g. from classical orders.
3 3D Model Segmentation The segmentation of a polygonal model consists in the decomposition of the 3D geometry into sub-elements which have generally uniform properties. The semantic segmentation should be ideally performed fully automatically to imitate the human visual perception and the decision intents. But in most of the applications (Cultural Heritage, 3D city models, etc.) the user intervention is still mandatory to achieve more accurate results. Following [17], the main reasons that limit the automatic reconstruction of semantic models are related to: • • • •
the definition of a target model which restricts object configurations to sensible building structures and their components, but which is still flexible enough to cover (nearly) all existing buildings in reality; the geometric and radiometric complexity of the input data and reconstructed 3D models; data errors and inaccuracies, uncertainty or ambiguities in the automatic interpretation and segmentation; the reduction of the search space during the interpretation process.
The interpretation and segmentation of a 3D model allow to generate a topologically and semantically correct model with structured boundary. The 3D geometry and the related semantic information have to be structured coherently in order to provide a convenient basis for simulations, urban data analyses and mining, facility management, thematic inquiries, archaeological analyses, policies planning, etc. The CityGML, conceived as target data format, fulfills all these requirements and became the standard approach for 3D city models [18].
Reality-Based 3D Modeling, Segmentation and Web-Based Visualization
115
Fig. 3. Example of automated segmentation of complex and detailed polygonal model: a fast but inaccurate segmentation can be improved with geometric constraints and manual refinements to separate the narrative elements
In the literature, the most effective automated segmentation algorithms are based on 3D volumetric approaches, primitive fitting or geometric segmentation methods. While the former two approaches segment meshes by identifying polygons that correspond to relevant feature of the 3D shape, the latter segments the mesh according to the local geometrical properties of 3D surface. In the field of Cultural Heritage, the segmentation of digital 3D models is useful for a large number of applications. For example, segmented models and their sub-elements can be used in searchable databases or can be labeled and used in knowledge ontology contexts [20]. Moreover, segmentation of restored archaeological finds can suggest different locations of subelements and therefore can help to review facts and interpret history [21]. A comparative study between some segmentation algorithms and related applications have been presented in [22], where only visual results were presented, without any quantitative evaluation of the algorithm’s effectiveness. In [23] a more complete and to-date review of mesh segmentation techniques is presented. A fully automatic protocol for the quantitative evaluation of 3D mesh segmentation algorithms aimed at reaching an objective evaluation of their effects are shown in [24, 25]. In particular, they provided 3D mesh segmentation benchmark in order to help researchers to develop or improve automatic mesh segmentation algorithms. But the offered case studies were rather different and simpler from the wide range of possible cases usually encountered in Cultural Heritage applications. As automation cannot provide for satisfactory results in all the possible dataset, [26] developed a methodology which combines different automatic segmentation algorithms with an interactive interface to adjust and correct the segmented polygonal models.
116
A.M. Manferdini and F. Remondino
Our methodology follow also these concepts and uses a combination of automated and interactive segmentation tools according to the 3D model and its complexity (Fig. 3). The methodology is not aiming at the fully automation as reality-based 3D models are generally very complex and detailed and there is no automated procedure able to deal successfully with all these models. Furthermore the segmentation is generally performed according to rules or specifications given by archaeologists or architects and differs for each project. Therefore the user intervention is generally not neglected in order to derive correct subdivisions of the polygonal models. The segmentation procedure performs: • • •
an automatic geometric separation of the different mesh portions using surface geometric information and texture attributes; a manual intervention to adjust the boundaries of the segmented elements an assisted annotation of the sub-elements that constitute the segmented 3D model.
Fig. 4. Segmentation of a stone wall of a castle (Fig.2-f) with small surface irregularities. a) result derived aggregating the main surface orientations; b) result of the segmentation following planar adjacent faces.
The geometric segmentation requires recognizing the transition between the different geometric elements of a 3D model. Automatic procedures to select and group faces of 3D models are available in common modeling packages (Maya, 3DS Max, Rhino, Meshlab, etc.). Faces can be separated and grouped using constraints such as inclination of adjacent faces, lighting or shading values. The surface normals are generally a good indicator to separate different sub-elements , when semi-planar faces need to be separated from reliefs (Fig. 4 and Fig. 5). The detection of lighting or texture transitions can be instead eased applying filters or using edge detector algorithms. This can be quite useful in flat areas with very low geometric discontinuities where the texture information allow to extract, classify and segment figures or relevant features for further uses (Fig. 6). For the correct hierarchical organization and visualization of the segmented subelements, a precise identification of the transition borders in the segmented meshes is required. For complex geometric models constituted by detailed and dense meshes, the manual intervention is generally required. Another aspect that has to be considered during the geometric segmentation of complex and fully 3D models is related to the possibility of subdividing only visible surfaces or to build complete volumes of sub-element models, modeling also non- visible closure or transition surfaces.
Reality-Based 3D Modeling, Segmentation and Web-Based Visualization
117
Fig. 5. a) Image of the law code in Gortyna (Fig.2-e) with symbols of ca 3-4 mm depth; b) close view of the 3D textured polygonal model; c) automatic identification of the letters using geometric constraints; d) final segmentation and vectorialization of the letters
Fig. 6. a) The 3D model of an underground frescoed Etruscan tomb (Fig.2-a); b) filters to detect edges on the texture information of the 3D model; c,d) ease of lighting transitions and final segmentation of the polygonal model
This is for example the case of architectural buildings where interior rooms need to be divided from other geometric elements to fully semantically segment the available 3D model.
118
A.M. Manferdini and F. Remondino
The semantic segmentation of a geometric 3D model is followed by the assignation to each sub-element of characteristics and information which need to be represented, organized and managed using advanced repository of geometric and appearance components to allow visualization and interaction with the digital models as well as database queries.
4 3D Model Visualization and 3D Web-GIS 3D models can be used as graphical interfaces and containers for different kinds of information that are usually organized and collected in 2D databases. This is also one of the most interesting need and requirements of 3D geo-browser where the simple visualization should be associated to query functionalities and data retrieval. These would be the typical functions of actual GIS packages which are no more sufficient when dealing with detailed and complex 3D data. A “3D repository” can be considered an informatic tool able to: • handle geographical features (e.g. landscapes) as well as data more complex than a 2.5D surface (e.g. architectural or archaeological 3D models); • allow queries and spatial data analyses, possibly via web; • support multi-users access and interaction, multi-resolution data (LOD) and multi-representation. In the literature different authors presented possible solutions for 3D data management and visualization [27, 28, 29, 30, 31, 32, 33]. Despite the great research work, nowadays almost no powerful, reliable and flexible package with all the aforementioned capabilities is available. In the video-games domain some packages or development tools are present, adaptable to 3D geo-data and web-based applications (e.g. Unity3D, OSG, OGRE3D, OpenSG, 3DVIA Virtools, etc.) but with limited capabilities for loading and displaying large and complex 3D models. In [34] Google Earth has been used as 3D GIS web-based solution for architectural 3D models while [35] uses the NASA World Wind to deliver a web-based 3D and OGC compliant solution capable to provide interoperable access to geographical information and geospatial processing services. Nowadays a common information model is also the City Geography Markup Language (CityGML), a concept for the modeling, visualization and exchange of 3D city and landscape models that is quickly being adopted on an international level [19]. Unfortunately at the moment CityGML seems to be unable to support high-resolution architectural and archaeological 3D models as the supported geometric entities are still limited to more simple and standard representations although some Application Domain Extensions (ADE) are available or under development. The aim of enlarging knowledge and allow access to a wide range of users has guided our work towards web-based open source tools which represents a cost effective solution for both servers and clients. Moreover, the possibility to geo-reference digital models and make them available online in order to increase the coverage on virtual globes (i.e. using Google Earth) has encouraged our work towards a cooperation system. The developed visualization methodology is based on the O3D technology, a webbased application which allows a completely free interactive exploration of segmented 3D models. The O3D technology is an open-source JavaScript implementation launched
Reality-Based 3D Modeling, Segmentation and Web-Based Visualization
119
in 2009 by Google in order to create interactive 3D applications inside a web browser. O3D is actually evolving as a library that runs on WebGL, a 3D graphics API based on OpenGL, recently improved thanks to the development of some projects (as, for example, the Angle Project, http://code.google.com/ p/angleproject/) aimed at running WebGL also on computers without OpenGL drivers installed. The O3D choice was reinforced by the awareness of the possible developments of Google’s services due to its widespread and to its efforts towards content sharing. Indeed the development of projects like Google Earth and SketchUp demonstrates the wish to let users create and interact with 3D contents in a single context (the virtual globe). Using O3D the user has the possibility to geo-reference 3D models upon the most well-known free geographic information program (i.e. Google Earth) which is constantly improved and enriched with 3D contents. O3D provides also a solution to reduce 3D models file size and speed up the transmission of 3D data. Indeed, when dealing with reality-based 3D models, geometry and texture are generally very heavy, with large memory consumption. Their loading via web can therefore constitute a bottleneck during the online visualization. Despite the fact that O3D is not supporting many 3D file formats, its proprietary format (o3dtgz) allows a compression rate up to 1/3 of the original file size and so the possibility to interactively display even large and complex textured 3D models via web. The typical pipeline to import and visualize segmented 3D models is based on the COLLADA format which is then converted into the O3D gzipped tar file (o3dtgz) with a JSON file describing the scene and the textures. The model is finally loaded inside the O3D viewer for visualization, interaction and database (DB) queries. Indeed O3D allow to link the segmented 3D models with any kind of information (like drawings, maps, images, videos, text, databases, etc.) and query external DB system (PostgreSQL, ORACLE, etc.).
Fig. 7. A segmented 3D model of the frescoed tomb in Tarquinia (Fig.2-a) and its visualization in O3D
5 Further Experiments The idea of choosing a Claude-Nicolas Ledoux’s architecture (Fig. 2-c) as case study is primary due to the important role of this architecture within the debate upon the use of classical orders in architectural composition and the consequent possibility of a semantic organization of these kinds of digital models. Both in Ledoux’s built and non-built visionary architectures, it is possible to recognise clear proportions and composition codes derived from the classical orders, so that each architecture is ruled following a specific hierarchy.
120
A.M. Manferdini and F. Remondino
Fig. 8. CAD model of the House of the Surveyors by C.-N. Ledoux (a). Segmentation derived from classical orders and architectural information (b). Detail of the segmented level 0 of the house (c). Main organization of the segmented model with its sub-elements: for each level, the corresponding rooms with ceiling, floor and walls (d).
The semantic organization of these kinds of buildings can therefore take these rules into consideration in order to subdivide and name each single sub-element or groups of elements. The Ledoux’s building model was subdivided both following geolocation rules based upon a local reference system and principles derived from classical architectural orders. The complexity of this model also required the numbering of
Reality-Based 3D Modeling, Segmentation and Web-Based Visualization
121
Fig. 9. Visualization of the House of the Surveyors inside a web-browser using the O3D technology. The digital model is accessible through the hierarchical graph that shows the subelements in which the CAD model has been semantically segmented. On the right, 2D drawings and other information are linked to the model.
sub-elements that corresponds to their orientation related to the reference system (Fig. 8). Within the O3D web viewer, the segmented model of Ledoux’s building was linked to text documents and drawings for consultation and fruition (Fig. 9).
Fig. 10. Manual segmentation and naming of portions of the image-based Angkor Wat temple with its hierarchical graph
122
A.M. Manferdini and F. Remondino
The Angkor Wat temple (Cambodia), was digitally reconstructed using aerial images. The successive semantic classification was performed selecting homologues areas based upon the naming of single buildings or their functions (Fig. 10). The model can be then visualized as entire entity or as single sub-elements thanks to the hierarchical graph that shows its semantic organization. The geo-referenced and segmented 3D model is finally display using O3D, which allow also a link to Google Earth or Google Maps or to any kind of external database (Fig. 11).
Fig. 11. Visualization and geo-referencing of the Angkor Wat temple inside O3D, Google Earth and Google Maps, with its related sub-elements and attributes
6 Conclusions Despite the great development and widespread use of reality-based 3D models, the heritage community is still missing precious and reliable tools to semantically segment, connect, analyze, visualize and share different kinds of information related and belonging to 3D heritages. In this article the semantic organization of 3D information and its access through an online graphical interface was realized with a collaborative work to realize reliable, efficient and flexible tool usable by different and non-expert users. Besides the management of information through digital models, this paper showed the possibility to interact with complex and detailed 3D models, segment them and visualize the results with an online viewer. The tendency to use automatic procedures in order to subdivide geometric entities is generally not very appropriate when dealing with complex reality-based 3D models, therefore the user interaction should not be neglected. The use of O3D, an open-source web API for creating rich and interactive 3D applications inside browsers, clearly showed the purpose of sharing information with other users or project partners and to contribute to the building of a whole virtual globe conceived as a single graphic interface to various databases. Further developments of our methodology are represented by the insertion of a tool to query external database (DB) containing scene attributes and visualize the results through the same interface. Planned to be realized are (i) the implementation of tools for the metric evaluation of the segmentation procedure, (ii) a GUI for the direct selection of single sub-elements inside the web viewer and (iii) a procedure for the dynamic visualization of large models using different levels of detail (LOD).
Reality-Based 3D Modeling, Segmentation and Web-Based Visualization
123
References 1. Gruen, A.: Reality-based generation of virtual environments for digital earth. International Journal of Digital Earth 1(1) (2008) 2. Remondino, F., El-Hakim, S.: Image-based 3d modelling: a review. The Photogrammetric Record 21(115), 269–291 (2006) 3. Blais, F.: A review of 20 years of range sensors development. Journal of Electronic Imaging 13(1), 231–240 (2004) 4. Vosselman, G., Maas, H.-G.: Airborne and terrestrial laser scanning, p. 320. CRC Press, Boca Raton (2010) 5. Yin, X., Wonka, P., Razdan, A.: Generating 3d building models from architectural drawings: A survey. IEEE Computer Graphics and Applications 29(1), 20–30 (2009) 6. Stamos, I., Liu, L., Chen, C., Woldberg, G., Yu, G., Zokai, S.: Integrating automated range registration with multiview geometry for photorealistic modelling of large-scale scenes. International Journal of Computer Vision 78(2-3), 237–260 (2008) 7. Guidi, G., Remondino, F., Russo, M., Menna, F., Rizzi, A., Ercoli, S.: A multi-resolution methodology for the 3d modeling of large and complex archaeological areas. International Journal of Architectural Computing 7(1), 40–55 (2009) 8. Remondino, F., El-Hakim, S., Girardi, S., Rizzi, A., Benedetti, S., Gonzo, L.: 3D virtual reconstruction and visualization of complex architectures - The 3d-arch project. In: International Archives of the Photogrammetry, Remote Sensing and Spatial Information Sciences, 38(5/W10), on CD-ROM (2009) 9. Mueller, P., Wonka, P., Haegler, S., Ulmer, A., Van Gool, L.: Procedural modeling of buildings. ACM Transactions on Graphics 25(3), 614–623 (2006) 10. Whiting, E., Ochsendorf, J., Durand, F.: Procedural Modeling of Structurally-Sound Masonry Buildings. In: Proc. ACM SIGGRAPH, Asia (2009) 11. Goesele, M., Snavely, N., Curless, R., Hoppe, H., Seitz, S.M.: Multi-view stereo for community photo collections. In: Proc. ICCV, Rio de Janeiro, Brazil (2007) 12. Agarwal, S., Snavely, N., Simon, I., Seitz, S., Szelinski, R.: Building Rome in a day. In: Proc. ICCV 2009, Kyoto, Japan (2009) 13. Remondino, F., El-Hakim, S., Gruen, A., Zhang, L.: Development and performance analysis of image matching for detailed surface reconstruction of heritage objects. IEEE Signal Processing Magazine 25(4), 55–65 (2008) 14. Hirschmueller, H.: Stereo processing by semi-global matching and mutual information. IEEE Transactions on Pattern Analysis and Machine Intelligence 30(2), 328–341 (2008) 15. Hiep, V.H., Keriven, R., Labatut, P., Pons, J.P.: Towards high-resolution large-scale multiview stereo. In: Proc. CVPR 2009, Kyoto, Japan (2009) 16. Patias, P., Grussenmeyer, P., Hanke, K.: Applications in cultural heritage documentation. Advances in Photogrammetry, Remote Sensing and Spatial Information Sciences. In: 2008 ISPRS Congress Book, vol. 7, pp. 363–384 (2008) 17. Barazzetti, L., Remondino, F., Scaioni, M.: Automation in 3D reconstruction: results on different kinds of close-range blocks. In: ISPRS Commission V Symposium Int. Archives of Photogrammetry, Remote Sensing and Spatial Information Sciences, Newcastle upon Tyne, UK, vol. 38(5) (2010) 18. Nagel, C., Stadler, A., Kolbe, T.H.: Conceptual Requirements for the Automatic Reconstruction of Building Information Models from Uninterpreted 3D Models. In: International Archives of the Photogrammetry, Remote Sensing and Spatial Information Sciences, vol. 38(3-4/C3) (2009)
124
A.M. Manferdini and F. Remondino
19. Kolbe, T.H.: Representing and Echanging 3D City Models with CityGML. In: Lee, J., Zlatanova, S. (eds.) 3D Geo-Information Sciences. Springer, Heidelberg (2009) 20. Attene, M., Robbiano, F., Spagnolo, M., Falcidieno, B.: Semantic Annotation of 3D Surface Meshes based on Feature Characterization. In: Falcidieno, B., Spagnuolo, M., Avrithis, Y., Kompatsiaris, I., Buitelaar, P. (eds.) SAMT 2007. LNCS, vol. 4816, pp. 126– 139. Springer, Heidelberg (2007) 21. Manferdini, A.M., Remondino, F., Baldissini, S., Gaiani, M., Benedetti, B.: 3D Modeling and Semantic Classification of Archaeological Finds for Management and Visualization in 3D Archaeological Databases. In: Proc. 14th VSMM, pp. 221–228 (2008) 22. Attene, M., Katz, S., Mortara, M., Patané, G., Spagnuolo, M., Tal, A.: Mesh segmentation - a comparative study. In: Proc. IEEE International Conference on Shape Modeling and Applications 2006, p. 12. IEEE Computer Society, Washington (2006) 23. Shamir, A.: A survey on mesh segmentation techniques. Computer Graphics Forum 27(6), 1539–1556 (2008) 24. Benhabiles, H., Vandeborre, J.-P., Lavoué, G., Daoudi, M.: A framework for the objective evaluation of segmentation algorithms using a ground-truth of human segmented 3Dmodels. In: Proc. IEEE Intern. Conference on Shape Modeling and Applications 2009, p. 8. IEEE Computer Society, Washington (2009) 25. Chen, X., Golovinskiy, A., Funkhouser, T.: A Benchmark for 3D Mesh Segmentation. Proc. ACM Transactions on Graphics 28(3), 12 (2009) 26. Robbiano, F., Attene, M., Spagnuolo, M., Falcidieno, B.: Part-based annotation of virtual 3d shapes. In: Proc. of the International Conference on Cyberworlds, pp. 427–436. IEEE Computer Society, Washington (2007) 27. Wang, X., Gruen, A.: A Hybrid GIS for 3-D City Models. International Archives of Photogrammetry and Remote Sensing 33(B4), 1165–1172 (2000) 28. Pfund, M.: Topological Data Structure for a 3D GIS. International Archives of Photogrammetry and Remote Sensing 34(2W2), 233–237 (2001) 29. Nebiker, S.: Design and implementation of the high-performance 3D digital landscape server ‘DILAS’. In: Joint ISPRS, IGU, CIG Symposium on Geospatial Theory, Processing and Applications, Ottawa, Canada (2002) 30. Shi, W.Z., Yang, B.S., Li, Q.Q.: An Object-Oriented Data Model For Complex Objects in three-dimensional Geographic Information Systems. International Journal of Geographic Information Science 17(5), 411–430 (2003) 31. Calori, L., Forte, M., Pescarin, S.: Real-time interactive reconstruction of archaeological landscapes: an opensource approach - From GIS to virtual reality. In: Proc. Italy-Canada Workshop (2005) 32. Khuan, T.C., Abdul-Rahman, A., Zlatanova, S.: 3D Spatial Operations in Geo DBMS Environment for 3D GIS. In: Gervasi, O., Gavrilova, M.L. (eds.) ICCSA 2007, Part I. LNCS, vol. 4705, pp. 151–163. Springer, Heidelberg (2007) 33. Kibria, M.S., Zlatanova, S., Itard, L., Van Dorst, M.: GeoVEs as tools to communicate in urban projects: requirements for functionality and visualisation. In: Lee, Zlatanova (eds.) 3D Geo-Information Sciences. LNG&C, pp. 379–412. Springer, Heidelberg (2009) 34. Apollonio, F.I., Corsi, C., Gaiani, M., Baldissini, S.: An integrated 3D geodatabase for Palladio’s work. International Journal of Architectural Computing 2(8) (2010) 35. Conti, G., Simões, B., Piffer, S., De Amicis, R.: Interactive Processing Service Orchestration of Environmental Information within a 3D web client. In: Proc. GSDI 11th World Conference on Spatial Data Infrastructure Convergence, Rotterdam, The Netherlands (2009)