ECCOMAS Congress 2016 VII European Congress on Computational Methods in Applied Sciences and Engineering M. Papadrakakis, V. Papadopoulos, G. Stefanou, V. Plevris (eds.) Crete Island, Greece, 5–10 June 2016
REASSESS V1.0: A COMPUTATIONALLY-EFFICIENT SOFTWARE FOR PROBABILISTIC SEISMIC HAZARD ANALYSIS Iunio Iervolino1, Eugenio Chioccarelli2, and Pasquale Cito1 1
Università degli Studi di Napoli Federico II Via Claudio 21, 80125 Naples, Italy e-mail: {iunio.iervolino, pasquale.cito}@unina.it 2
Istituto per le Tecnologie della Costruzione ITC-CNR, URT Napoli c/o DiSt Via Claudio 21, 80125 Naples, Italy e-mail:
[email protected]
Keywords: site-specific PSHA, logic tree, disaggregation, conditional hazard, conditional mean spectrum. Abstract. A stand-alone software for the probabilistic assessment of seismic hazard is developing. In its final version, it shall be structured in three modules for: (i) site-specific, (ii) scenario-based and (iii) multi-site (regional) analyses. This paper focuses on (i), which is devoted to single-site probabilistic seismic hazard analysis (PSHA). Seismic sources can be either zones or individual faults. The algorithm to compute PSHA is implemented assuming, classically, that the process of occurrence of earthquakes on each seismic source follows a homogeneous Poisson process; the processes for different sources are independent. The required input data are: (1) the source(s) geometry and the annual rate(s) of occurrence of earthquakes in the magnitude interval of interest; (2) the distribution of magnitude given the occurrence of one earthquake; (3) the ground motion propagation model (GMPM); (4) the soil classification at the site for which hazard is evaluated. Regarding (1-3), the user is aided by some library implemented in the software. REASSESS also is able to account for model uncertainty, in fact, logic trees can be built based on alternatives for the source’s annual rate of earthquake occurrence, magnitude distribution and GMPM. The strength of REASSESS, beyond the user-friendly interface, stays in the PSHA computation algorithms. These have been coded in MATLAB®, targeting accuracy and reduced computing time. Its potential for earthquake engineering and engineering seismology applications is illustrated by a few applications discussed in the paper.
Iunio Iervolino, Eugenio Chioccarelli and Pasquale Cito
1
INTRODUCTION
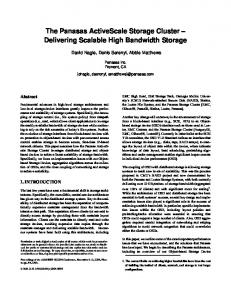
The case of probabilistic seismic hazard assessment for a specific site is consolidated [1, 2] and acknowledged by the most advanced national and international seismic codes (e.g., [3, 4]). Indeed, there are several computer programs for site-specific probabilistic seismic hazard analysis (PSHA) publicly available or produced as proprietary codes. On the other hand, the attention toward the seismic hazard assessment for multiple sites is growing recently (e.g., [5, 6, 7]) and the developed knowledge has not found yet its direct application in the engineering practice. The aim of the work partially presented in this study is to develop a user-friendly software for both site-specific and multi-site PSHA. The name of the tool is REgionAl, Site-SpEcific and Scenario-based Seismic hazard analysis (REASSESS) and, as the name suggests, it will be divided in three modules. The one preliminarily presented in this contribution is about sitespecific PSHA, while the others are under-development. The flow chart in Figure 1 schematically summarizes the main features of the site-specific module. Input parameters, defined by the user or selected from embedded databases, are the geographical coordinates and soil condition of the site of interest, the seismic sources, the magnitude distributions and the annual rates of earthquake occurrence (within the magnitude limits of interest) for each source, and the models of ground motion propagation (parameters and GMPMs can be multiple if a logic tree is adopted [8]). The primary outputs are the hazard curves for the selected intensity measures, which, along fragility curves (e.g., [9]), can be the input for seismic risk assessment software (e.g., [10]). Additionally, the software is able to provide the disaggregation of seismic hazard [11] and, according to the latter, the distribution of conditional hazard [12] (i.e., the distribution of a secondary intensity measure conditional to the occurrence or exceedance of a primary one). Moreover, when spectral ordinates are chosen as intensity measures, REASSESS provides the uniform hazard spectrum (UHS) [2] for a given return period and the conditional mean spectrum (CMS) [13] (in which disaggregation is also involved). Each of these issues is analyzed in the following sections providing the essential basics of PSHA and the details about the software implementation. In the final part, the main features of the graphical interface and some results of illustrative analyses are shown. Site of interest Disaggregation
Seismic sources
Ground motion propagation model(s)
Magnitude distributions
PSHA
Conditional hazard
Hazard curves UHS
Rates of earthquake occurrence
Input
CMS
Output
Figure 1. Flow chart of the first module of REASSESS
Iunio Iervolino, Eugenio Chioccarelli and Pasquale Cito
2
PROBABILISTIC SEISMIC HAZARD ANALYSIS
PSHA aims at computing the rate im of seismic events exceeding a ground motion intensity measure (IM) threshold im at a specific site. When more than one seismic source affects the site, the rate is due to superposition of the contributions from each source, as illustrated in Equation 1 where ns is the number of sources. In the equation, M is the event magnitude, R is the source-to-site distance, i is the mean annual rate of earthquakes within a magnitude range of interest at source i, f R ,M ,i is the joint probability density function (pdf) of R and M for the i-th source. The exceedance probability of an intensity measure threshold, given a magnitude and distance pair, P IM im r, m , is the complementary cumulative distribution function of the IM, which is provided by a ground motion propagation model. ns
im i P IM im r, m f R ,M ,i r, m dr dm i
(1)
r m
Equation 1 accounts for the uncertainties related to seismic hazard. In some cases, however, the choice for models and distributions to be used in PSHA may not be straightforward. In these cases, the use of a logic tree, which is also implemented in REASSESS, allows to deal with model uncertainty [8]. Indeed, according to the logic tree, im is computed as a weighted average of alternative models; the weight assigned to each model is the probability of that model being correct (see Section 2.4 for further details). Plotting im as a function of im provides the hazard curve. In the following section, it is described how computation of hazard curves has been coded in REASSESS, targeting accuracy and reduced computing time. 2.1
Calculation of PSHA via matrix algebra
The algorithms of REASSESS have been developed in MATLAB® [14] and the hazard integral is approximated by matrix operations, for which MATLAB® is especially effective [15]. Such operations are described in this section referring to the case of a single source, for the sake of simplicity. Moreover, it has to be clarified that in the algorithms of REASSESS the joint magnitude-distance distribution in Equation 1, is computed as the product of the distribution of distance conditional on magnitude and the marginal distribution of magnitude itself (Equation 2): f R , M r, m f R M r m f M m
(2)
In the following, the discretized values of event magnitude and source-to-site distance involved in PSHA will be indicated as M m1 , m2 ,, mk and R r1 , r2 ,, rs of dimensions 1 k and 1 s , respectively. The ground motion intensity measure at the site is discretized in the vector IM im1 , im2 ,, imq of dimension 1 q . The GMPM is accounted for via a k s q matrix, A , in which each column represents the exceedance probability of a specific IM value conditional to magnitude and distance arranged in the form of Equation 3. Different columns of the matrix only differ by the IM threshold considered.
Iunio Iervolino, Eugenio Chioccarelli and Pasquale Cito P IM P IM P IM A P IM P IM P IM
im1 | m1 , r1 im1 | m2 , r1
im1 | mk , r1
im1 | m1 , rs im1 | m2 , rs
im1 | mk , rs
P IM imq | m1 , r1 P IM imq | m2 , r1 P IM imq | mk , r1 P IM imq | m1 , rs P IM imq | m2 , rs P IM imq | mk , rs
(3)
The pdf of magnitude, f M m , is approximated by finite probabilities of event’s magnitude belonging to k intervals; i.e., P m1 , P m2 , , P mk . These probabilities, arranged in the form of a column vector, are the elements of the B matrix in Equation 4. In fact, this matrix has q identical columns, each of which is made of the magnitude probability vector repeated s-times. P m1 P m2 P mk B P m1 P m 2 P mk
P m1 P m2 P mk P m1 P m2 P mk
(4)
Similarly, the C matrix is a row vector with k s elements. The first k elements are the conditional probabilities of r1 conditional to the k magnitude values. The elements from k 1 until 2k are the probabilities of r2 conditional to the each of the magnitudes and so on, until rs conditional to all magnitudes; i.e., Equation 5.
C P r1 m1
P r1 m2 P r1 mk P rs m1 P rs m2 P rs mk (5)
At this point, the operation of pointwise multiplication between two matrices of the same dimensions has to be recalled (i.e., the Hadamard product [16]). It is here indicated by the symbol and provides a resulting matrix of the dimensions of those multiplied. Its elements are the products of the corresponding elements in the original matrices. More specifically, D A B implies that the resulting matrix has each element of the type: dij aij bij . Therefore, the unit-time rates of exceedance of the im values considered, im , im , , im , 1
2
q
can be obtained by the product in Equation 6, where the dot represent matrix multiplication.
im im
1
im
2
imq C A B
(6)
Iunio Iervolino, Eugenio Chioccarelli and Pasquale Cito
2.2
Soil effect
The GMPMs provide the (usually lognormal) cumulative density function of the IM at the site of interest given the magnitude of the earthquake, the source-to-site distance and some possible additional seismic parameters (e.g., soil site condition). In most cases, the different soil conditions at the site are considered in the GMPMs through modification factors that operate only on the mean of the (lognormal) distribution. When such kinds of GMPMs are chosen for PSHA, i.e. when the standard deviation of the residuals of the GMPM does not depend on the soil class, a deterministic relationship between the hazard curves for different soils exists [17]. This allows REASSES to provide hazard curves for any kind of soil conditions performing a single analysis. In particular, it has been demonstrated that, if the soil in the GMPM only affects the mean given magnitude and distance, for example via addition of a coefficient soil , as it often happens, then once the hazard curve is obtained for a reference condition (e.g., rock), the hazard curve for soil, im , is obtained by horizontally translating, in log scale of the abscissa, the soil
original curve, im , by a factor equal to the soil coefficient in the GMPM (Equation 7). rock
if log imsoil log imrock soil imsoil imrock
2.3
(7)
Seismic sources and magnitude distributions
In REASSESS, seismogenic zones and/or finite tridimensional faults can both be inputs for PSHA. Seismogenic zones are geographic areas with homogeneous seismicity; i.e., each location has the same probability to be the location of the earthquake and the magnitudes of events in each location are independent and identically distributed random variables. For the characterization of seismogenic zones, the software requires the following input parameters: (i) the geographic coordinates of the vertexes of the source, (ii) the seismic parameters and (iii) the predominant faulting style, if known. Regarding (ii), it is assumed that the distribution of the magnitude of the earthquakes is described by a truncated exponential distribution consistent with the Gutenberg-Richter (GR) relationship [18]; hence, the seismic parameters of (ii) are the slope of such a relationship, together with minimum and maximum magnitude and the mean annual rate of earthquake occurrence in the seismic source zone. The pdf of the epicentral distance is derived from the uniform distribution of the epicenters within the fault. However, the GMPM may refer to one among a variety of distance metrics; e.g., the minimum distance from the horizontal projection of the rupture, known as Joiner and Boore distance R jb [19]. In the V1.0 of REASSESS the epicentral distances are converted into R jb according to [20]. The definition of the zones is not the only possibility in REASSESS. In the software, some known databases of seismogenic zones are already implemented. These are, referring to Italy, the seismogenic zones described in [21] with the seismic parameters taken from [22, 23]. At the European scale, the database of seismogenic zones provided by the SHARE research project (available at http://www.share-eu.org/, last accessed 22/02/2016) is embedded. On the other hand, finite tridimensional faults can also be considered. The geometry and location of the single fault have to be known in this case. The required input parameters are the geographical coordinates of the vertexes of the fault and the rake, strike and dip angles (see [8] for example). A uniform probability distribution of the epicenter on the fault plane is assumed. Regarding the distribution of magnitude, apart from the GR, REASSESS V1.0 al-
Iunio Iervolino, Eugenio Chioccarelli and Pasquale Cito
lows the definition of a characteristic model [24] that may be more appropriate in the case of individual faults. 2.4
Logic tree and GMPMs
PSHA is often implemented considering a logic tree, which allows accounting for model uncertainty [2, 8]: indeed, it allows the use of alternative models, each of which is assigned a weighing factor that is interpreted as the probability of that model being correct. The sum of the weights of all the alternative models must be equal to one. When the logic tree is of concern, im , is computed through Equation 8 in which p j and im , j are the weight and the result of each branch of the logic tree, respectively; nb is the total number of branches. nb
im im , j p j
(8)
j 1
In REASSESS accepted models’ heterogeneity refers to: (i) parameters of the magnitude distributions (i.e., magnitude range and b-value), (ii) mean annual frequency of earthquake occurrence on the sources and (iii) GMPMs. In particular, (i) and (ii) may be from direct input of the user, while GMPMs have to be chosen among a set of already implemented models. To guide the user, general indications about the tectonic regime each GMPM refers to [25] are provided. An example of logic tree is shown in Figure 2 in which two alternatives for the total rates 1 , 2 , Gutenberg-Richter parameters (synthetically identified as GR1 and GR2) and propagation models (GMPM1 and GMPM2) are adopted. The relative likelihood of each alternative model is arbitrarily chosen and reported in parentheses. REASSESS requires the user to provide the total weight of each branch skipping the implementation of a relative likelihood for each alternative model. Hence, the software automatically verifies that all the weights of the branches sum up to one. GR1 (0.5)
1 (0.6) GR2 (0.5)
GR1 (0.5)
2 (0.4) GR2 (0.5)
GMPM1 (0.7)
im ,1
p1 0.21
GMPM2 (0.3)
im ,2
p2 0.09
GMPM1 (0.7)
im ,3
p3 0.21
GMPM2 (0.3)
im ,4
p4 0.09
GMPM1 (0.7)
im ,5
p5 0.14
GMPM2 (0.3)
im ,6
p6 0.06
GMPM1 (0.7)
im ,7
p7 0.14
GMPM2 (0.3)
im ,8
p8 0.06
Figure 2. Example of logic tree.
Iunio Iervolino, Eugenio Chioccarelli and Pasquale Cito
3
DISAGGREGATION, CONDITIONAL HAZARD AND CONDITIONAL MEAN SPECTRA
Once hazard curves are ready, REASSESS also allows enhancing the characterization of the seismic threat for the site in three ways. The first is the disaggregation of the seismic hazard [11] that can be calculated for several exceedance rates; i.e., several values of the intensity threshold. Disaggregation is a procedure that allows the computation of the pdf of M , R, given the exceedance, or occurrence, of a chosen hazard threshold, f M ,R , m, r, IM im , being the number of standard deviations im is away from its median value estimated by the assumed GMPM. Analytically, such a distribution can be computed through Equation 9 that refers to the case of single seismic source and multiple-branches arranged in a logic tree. In the equation, in the case of disaggregation of the exceedance hazard, I is an indicator function equal to one if IM is larger than the threshold and zero otherwise. The subscript refers to the jth branch of the logic tree. nb
f M ,R , m, r, IM im
j
I IM im m, r, f M ,R , , j m, r , p j
j
im
(9)
A discussion of the possible uses of disaggregation (e.g., [26]) is out of the scope of this paper however it is worth noting that, although disaggregation for the exceedance of the hazard threshold is a traditional choice, in the context of performance based earthquake engineering disaggregation for the occurrence of the IM may be more appropriate. REASSESS allows to compute disaggregation of both ground motion intensity exceedance and occurrence hazards. The software also allows the computation of conditional hazard [12] and uniform hazard spectra and conditional mean spectra [13]. The former is the distribution of a secondary IM conditional on the exceedance (or occurrence) of a primary IM for which the hazard has been calculated. This allows assessing the hazard consistent distribution of more than one IM, which is equivalent to vector-valued PSHA [27]. In REASSESS, once the UHS for a fixed return period has been calculated, it is possible to choose a spectral period defining as primary parameter, IM 1 , the corresponding pseudo-spectral acceleration and asking for the conditional distribution of the secondary intensity measure, IM 2 , chosen among a few considered. The distribution of conditional hazard, f log IM 2 log IM 1 , is computed under the assumption of joint lognormality of the two IMs conditional to the hazard variables and according to Equation 10 in which f log IM 2 log IM 1 , M , R, depends on the GMPM of IM 2 and f M , R, log IM 1 is the disaggregation of the seismic hazard (occurrence or exceedance) for
IM 1 . f log IM 2 log IM 1
f log IM
2
log IM 1 , M , R, f M , R, log IM 1 dm dr d
(10)
M R
Finally, the conditional mean spectrum can be computed. It is a target response spectrum able to account for the statistical correlation of residuals between different spectral ordinates of the same GMPM. This issue, which is disregarded in UHS, is believed helpful for hazardcompatible record selection [28].
Iunio Iervolino, Eugenio Chioccarelli and Pasquale Cito
The analytical definition of CMS is reported in Equation (11) in which log Sa T and 2
log Sa T are the mean and the standard deviation of the logarithm of the pseudo-spectral ac2
celeration log Sa at the vibration period T2 and depend on the selected GMPM; log Sa T log Sa T is the model of correlation between spectral ordinates at two different periods 2
1
(the one implemented in REASSESS is [29]). The values of M , R and are taken from the disaggregation of log Sa T1 . In fact, if M , R and are chosen to be representative of the whole disaggregation distribution (e.g., modal values). Equation 11 can also be the basis for marginalization with respect to M , R and , via f M , R, log Sa T1 , to obtain log Sa T log Sa T (this is the case of the REASSESS). 2
1
log Sa T log Sa T , M ,R , log Sa T M , R log Sa T M log Sa T log Sa T T1 2
4
1
2
2
2
1
(11)
GRAPHIC USER INTERACE
The main features of the graphic user interface (GUI) of REASSESS are described in this section.1 The GUI is conceptually divided in three sections identified in Figure 3 with the dotted red lines. The first section is dedicated to the definition of input parameters required for PSHA. The site is defined by the geographical coordinates and the soil class. The latter is provided through the Vs30 (expressed in m/s2) that is, the shear wave velocity of the top 30 m of the subsurface profile (see Section 2.2).
Figure 3. Graphic interface of REASSESS V1.0. (Tentative)
The GMPM is selected with a pull-down menu in which all the implemented GMPMs are reported (see Section 2.4). Then the seismic sources have to be characterized. The user is first required to choose between embedded databases of known seismogenic sources, user-defined seismogenic sources and individual faults. These three choices are not exclusive so it is possible, as an example, to integrate sources from databases with information derived from specific studies. For each seismic source, a separate window with all the required parameters (see Section 2.3) appears. Site and source locations are shown in a map. The user is also required to 1
The development of the other two modules of the software may cause some modification to the GUI. However, the main features described in this section will be maintained.
Iunio Iervolino, Eugenio Chioccarelli and Pasquale Cito
choose between single- or multiple-branch of logic tree; the features of the different branches of the logic tree are specified in a separate window. A return period of interest is also required. Hitting the run button, PSHA is performed and the hazard curves are plotted in the second section of the GUI. In the illustrative case of Figure 3, selected GMPM refers to pseudospectral accelerations. Hence, the UHS is computed for the selected return period Tr 1 im and reported in same section. Finally, the third section is for the analyses that can be performed after PSHA. These are disaggregation, conditional hazard and conditional mean spectra (see Section 3). 5
ILLUSTRATIVE EXAMPLES
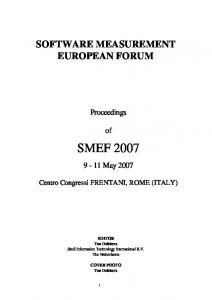
In this section, how the site-specific module of REASSESS works is shown via some illustrative examples. A site (40.982N, 14.297E) close to Naples, in the Campania region (southern Italy), is selected and reported in Figure 4 with a star. Seismic sources are the seismogenic zones of [21]. The limiting magnitudes for each zone as well as the slope of the GutenbergRichter relationship and the mean annual rate of earthquake occurrence on the zones are those reported in [22, 23]. In the same papers, the prevalent faulting style for each zone is also reported. These are divided in four categories: normal (N), reverse (R), strike-slip (SS) and undetermined (U). The selected GMPM is that of [30] that provides the distribution of peak ground acceleration (PGA) and pseudo-spectral accelerations for forty-six oscillation periods between 0.1 and 2.0s. The model is defined within the intervals of magnitude and distance equal to [4.0, 7.6] and [0km, 200km], respectively. In REASSESS, the GMPMs are always applied in their definition ranges. Hence, the seismogenic zones contributing to the hazard are those (or their portions) within 200km from the site. Moreover, although in the original paper [30], the attenuation model was independent on the rupture mechanism, the latter is considered via the modification factors provided by [31]. According to these criteria, the seismogenic zone within 200 km from the site are reported in Figure 4. Seismic parameters of these zones are summarized in Table 1. Zone 917 918 920 922 923 924 925 926 927 928
45 ° N 917 920 918
922
923
924 925
40 ° N
926
928 927
35 ° N° 5 E
10° E
° 15 E
Mmin Mmax 4.3 4.3 4.3 4.3 4.3 4.3 4.3 4.3 4.3 4.3
6.1 6.4 5.5 5.2 7.3 7 7 5.8 7.3 5.8
ν
b
RM
0.121 0.217 0.317 0.09 0.645 0.192 0.071 0.061 0.362 0.054
0.794 0.84 1.503 1.409 0.802 0.945 0.508 1.017 0.557 1.056
R U N N N SS SS SS N N
° 20 E
Figure 4. Selected site (star) and the seismogenic zones involved in the hazard analysis.
Table 1. Parameters associated to each zone: minimum (Mmin) and maximum magnitude (Mmax), annual rate of earthquake occurrence (ν), negative slope of GR relationship (b) and rupture mechanism (RM).
Iunio Iervolino, Eugenio Chioccarelli and Pasquale Cito
For the selected site, the UHS are here derived. Referring to rock site, Figure 5a shows the UHS’ for the annual exceedance probabilities equal to about 2%, 0.2% and 0.04%, corresponding to return periods of 50, 475 and 2475 years, respectively. On the other hand, the UHS’ for Tr equal to 2475 years and the three different soil conditions provided by [30] are reported in Figure 5b: rock, stiff and soft soil. 1
(a)
(b) 1 Tr=50 yrs Tr=475 yrs
0.8
Rock Stiff Soil Soft Soil
0.8
0.6
Sa [g]
Sa [g]
Tr=2475 yrs
0.4 0.2 0
0.6 0.4 0.2
0 1 1.5 2 0 0.5 1 1.5 2 T [s] T [s] Figure 5. (a) UHS for different return periods on rock soil and (b) for a Tr = 2475 years and different soil conditions. 0
0.5
A simple case of logic tree is also discussed. Two GMPMs are selected: GMPM1 [30] and GMPM2 [32] (and [33]) with associated weights equal to 0.7 and 0.3 respectively. No other sources of model variability are considered. Hence, resulting logic tree is a simplified form of that reported in Figure 2 (Figure 6a). The UHS for Tr 2475 years and rock soil condition are derived from the two alternative branches of the logic tree and shown in Figure 6b together with their weighted mean (note that the spectrum is computed only at the spectral periods common to both GMPMs). (a)
GR1 (1)
n1
GMPM1 (0.7)
(b)
GMPM2 (0.3)
1
GMPM
1
(1)
GMPM1
GMPM
0.8
GR2
2
GMPM2 GMPM1
S [g] a
Weighted Mean
0.6 0.4
GR1 GMPM2
n1
GMPM1 GR2
0.2 0 0
0.5
1 T [s]
1.5
2
GMPM2
Figure 6. (a) Simplified adopted logic tree and (b) resulting UHS.
Referring to the case of single-branch (Figure 5), the occurrence disaggregations of the UHS for Tr 2475 years, rock soil condition and three spectral periods equal to 0.2s, 0.5s and 1.0s are reported in Figure 7 (a, b, and c, respectively). According to these disaggregation distributions, the CMS’ are computed and reported in Figure 7d together with the UHS.
Iunio Iervolino, Eugenio Chioccarelli and Pasquale Cito
Figure 7. Disaggregation distributions for the occurrence at Tr = 2475: spectral period equal to (a) 0.2s, (b) 0.5s and (c) 1.0s. (d) Corresponding conditional mean spectra for rock and UHS.2
6
CONCLUSIONS
A stand-alone software for the probabilistic assessment of seismic hazard is developing. The first module is dedicated to site-specific probabilistic seismic hazard analysis (PSHA), and a preliminary description of it was provided with this paper. PSHA is consolidated, but hazard assessment may still be demanding for earthquake engineering researchers and is very rare for practitioners. In this context, the REASSESS software is presented as a user-friendly and computationally-efficient option to tackle PSHA. The present version of REASSESS is able to address the following issues: PSHA for several intensity measures accounting for model uncertainty; disaggregation for occurrence or exceedance hazard; conditional hazard for secondary intensity measures, when spectral acceleration is the primary one; 2
As a general comment to Figure 7, it is to recall that the REXEL, a software for record selection [34], also provides disaggregation distributions for Italian sites [35]. Although REXEL relies on the same models used in these illustrative applications, the disaggregations of REASSESS are expected to present some differences with respect to those of REXEL. These are due to different computational choices between the two software, which, however, provide comparable outputs.
Iunio Iervolino, Eugenio Chioccarelli and Pasquale Cito
uniform hazard and conditional mean spectra. REASSESS, so far, only deals with site-specific PSHA; however, in some cases, the assessment of the seismic hazard requires considering multiple sites at once. This happens when the analysis of spatially distributed systems is of concern, or when aggregated losses for portfolio of structures and/or supply chains are of interest. The need to account for all the uncertainties and the statistical dependencies involved, make the seismic hazard for multiple sites a not straightforward task. It is a specific goal of the ongoing developments of REASSESS to address multi-site probabilistic hazard assessment, which will include, as special cases, scenario-based regional analyses.
ACKNOWLEDGMENTS The work presented in this paper was developed within the AXA-DiSt (Dipartimento di Strutture per l’Ingegneria e l’Architettura, Università degli Studi di Napoli Federico II) 20142017 research program, funded by AXA-Matrix Risk Consultants, Milan, Italy.
REFERENCES [1] C.A. Cornell, Engineering seismic risk analysis. Bulletin of the Seismological Society of America, 58, 1583-1606, 1968. [2] R.K. McGuire, Seismic hazard and risk analysis, Report MNO-10. Oakland, CA, USA. Earthquake Engineering Research Institute Publication, 2004. [3] CEN, European Committee for Standardization TC250/SC8/(2003) Eurocode 8: Design provisions for earthquake resistance of structures, Part 1.1: general rules, seismic actions and rules for buildings, PrEN1998-1. [4] CS.LL.PP. DM 14 gennaio 2008 Norme Tecniche per le Costruzioni. Gazzetta Ufficiale della Repubblica Italiana, 29, 2008 [in Italian]. [5] R. Lee, A.S. Kiremidjian, Uncertainty and correlation for loss assessment of spatially distributed systems. Earthquake Spectra, 23(4), 743–770, 2007. [6] S. Esposito, I. Iervolino, A. d'Onofrio, A. Santo, P. Franchin, F. Cavalieri, Simulationbased seismic risk assessment of gas distribution networks. Computer-Aided Civil and Infrastructure Engineering, 30(7), 508-523, 2015. [7] M. Giorgio, I. Iervolino, On multi-site probabilistic seismic hazard analysis. Bulletin of the Seismological Society of America, 2016. (in press) [8] S.L. Kramer, Geotechnical earthquake engineering, Prentice Hall, 1996. [9] I. Iervolino, D. Vamvatsikos, G. Baltzopoulos, R. Baraschino, SPO2FRAG V1.0: software for pushover-based derivation of seismic fragility curves. Paper submitted to ECCOMAS Congress 2016: VII European Congress on Computational Methods in Applied Sciences and Engineering. M. Papadrakakis, V. Papadopoulos, G. Stefanou, V. Plevris (eds.), Crete Island, Greece, 5–10 June 2016. [10] F. Petruzzelli, I. Iervolino. FRAME V.1.0: A rapid fragility-based seismic risk assessment tool. Proceedings of the Second European Conference on Earthquake Engineering and Seismology, 2ECEES, Istanbul, Turkey, 24-29 August, 2014.
Iunio Iervolino, Eugenio Chioccarelli and Pasquale Cito
[11] P. Bazzurro, C.A. Cornell, Disaggregation of seismic hazard. Bulletin of the Seismological Society of America, 89, 501–520, 1999. [12] I. Iervolino, M. Giorgio, C. Galasso, G. Manfredi, Conditional hazard maps for secondary intensity measures. Bulletin of the Seismological Society of America, 100(6): 3312– 3319, 2010. [13] T. Lin, S.C. Harmsen, J.W. Baker, N. Luco, Conditional spectrum computation incorporating multiple casual earthquakes and ground motion prediction models. Bulletin of the Seismological Society of America, 103(2A), 1103-1116, 2013. [14] MATLAB Release 2015b, The MathWorks, Inc., Natick, Massachusetts, United States, 2000. [15] G. Recktenwald, Numerical methods with Matlab: implementation and applications. Prentice Hall, 2000, ISBN 0201308606. [16] G.H. Golub, C.F. Van Loan, Matrix computations, 4th Edition. The Johns Hopkins University Press, 2013. [17] I. Iervolino, Soil invariance of site specific hazard and disaggregation, 2016. (under review) [18] B. Gutenberg, C.F. Richter, Earthquake magnitude, intensity, energy, and acceleration. Bulletin of the Seismological Society of America, 32, 163–191, 1942. [19] W.B. Joyner, D.M. Boore, Peak horizontal acceleration and velocity from strongmotion records including records from the 1979 Imperial Valley, California, Earthquake. Bulletin of the Seismological Society of America, 71, 2011–2038, 1981. [20] V. Montaldo, E. Faccioli, G. Zonno, A. Akinci, L. Malagnini, Treatment of groundmotion predictive relationships for the reference seismic hazard map of Italy. Journal of Seismology, 9(3), 295-316, 2005. [21] C. Meletti, F. Galadini, G. Valensise, M. Stucchi, R. Basili, S. Barba et al., A seismic source zone model for the seismic hazard assessment of the Italian territory. Tectonophysics, 450, 85-108, 2008. [22] S. Barani, D. Spallarossa, P. Bazzurro, Disaggregation of probabilistic ground motion hazard in Italy. Bulletin of the Seismological Society of America, 99, 2638–2661, 2009. [23] S. Barani, D. Spallarossa, P. Bazzurro, Erratum to disaggregation of probabilistic ground-motion hazard in Italy. Bulletin of the Seismological Society of America, 100, 3335–3336, 2010. [24] V. Convertito, A. Emolo, A. Zollo, Seismic-hazard assessment for a characteristic earthquake scenario: an integrated probabilistic-deterministic method. Bulletin of the Seismological Society of America, 96(2), 377-391, 2006. [25] J.P. Stewart, J. Douglas, M. Javanbarg, Y. Bozorgnia, N.A. Abrahamsons, D.M. Boore et al., Selection of ground motion prediction equation for the global earthquake model. Earthquake Spectra, 31(1), 19-45, 2015. [26] I. Iervolino, E. Chioccarelli, C. Convertito, Engineering Design Earthquakes from Multimodal Hazard Disaggregation, Soil Dynamics and Earthquake Engineering, 31(9), 1212-1231, 2011.
Iunio Iervolino, Eugenio Chioccarelli and Pasquale Cito
[27] J.W. Baker, Probabilistic structural response assessment using vector-valued intensity measures. Earthquake Engineering and Structural Dynamics, 36, 1861–1883, 2007. [28] J.W. Baker, C.A. Cornell, Spectral shape, epsilon and record selection. Earthquake Engineering and Structural Dynamics, 35, 1077-1095, 2006. [29] J.W. Baker, N. Jayaram, Correlation of spectral acceleration values from NGA ground motion models. Earthquake Spectra, 24(1), 299-317, 2008. [30] N.N. Ambraseys, K.A. Simpson, J.J. Bommer, Prediction of horizontal response spectra in Europe. Earthquake Engineering and Structural Dynamics, 25, 371–400, 1996. [31] J.J. Bommer, J. Douglas, F.O. Strasser, Style-of-faulting in ground-motion prediction equations. Bulletin of Earthquake Engineering, 1, 171-203, 2003. [32] S. Akkar, J.J. Bommer, Empirical equations for the prediction of PGA, PGV, spectral acceleration in Europe, the Mediterranean region, and the Middle East. Seismological Research Letters 81(2), 195-206, 2010. [33] J.J. Bommer, S. Akkar, S. Drouet, Extending ground-motion prediction equations for spectral accelerations to higher response frequencies. Bulletin of Earthquake Engineering, 10, 379-399, 2012. [34] I. Iervolino, C. Galasso, E. Cosenza, REXEL: computer aided record selection for codebased seismic structural analysis. Bulletin of Earthquake Engineering, 8, 339-362, 2010. [35] I. Iervolino, C. Galasso, E. Chioccarelli, REXEL 3.3: Closing the Loop of Computer Aided Record Selection. 15th World Conference on Earthquake Engineering (15WCEE 2012), Lisbon, Portugal, September 24-28, 2012.