May 25, 1998 - dium using inversion recovery (with TI = I, 2, and 3 RR intervals) obtaining ... images was noted in gel phantom images acquired with otherwise identical .... myocardium can be evaluated by following the distortion. Figure 4. .... a surface coil at a heart rate of 125 bpm, phase interval 30 msec, tag spacing of ...
Journal of Cardiovascular Magnetic Resonance, 1(2), 185- 193 (1999)
Recent Progress in Radiofrequency-Tagged Left Ventricular Function Studies Edward G. Walsh, Mark Doyle, M. Eduardo Kortright, Ingrid M. Straeter-Knowlen, and Gerald M. Pohost Department of Medicine, Division of Cardiovascular Disease, University of Alabama at Birmingham School of Medicine, Birmingham, Alabama
INTRODUCTION TO RADIOFREQUENCY TAGGING Magnetic resonance imaging (MRI) is the optimal tool for the evaluation of ventricular function due to improved contrast, spatial resolution, and signal-to-noise performance over other imaging modalities. The ability to select oblique tomographic planes allows long- and shortaxis views of the heart to be obtained from any patient. With the advent of multiphase (cine), electrocardiogramgated cardiac imaging, it became possible to evaluate the overall function of the ventricle. The desire for quantitative regional contractile performance information has led to the development of means to automatically encode the motion of the myocardium. These methods fall into two classes: phase velocity mapping and radiofrequency (RF) tagging methods. In RF-tagged ventricular function studies, the myocardium receives a selective saturation excitation immediately on the R-wave trigger. This excitation, an example of which is shown in Fig. 1, produces a series of parallel saturation bands in the field of view (FOV) that appear as parallel dark lines. The direction of the lines is determined by the direction of the applied tagging gradient. Delivering two such excitations (each using one of the in-plane gradients) will produce a tag grid (1-6). For the grid tag excitation, the second set of RF pulses is phase
shifted by 90 degrees relative to the pulses of the first excitation to prevent the formation of stimulated echoes that can lead to problematic artifacts. A spoiler gradient follows the tagging excitation to eliminate (by dephasing) residual transverse magnetization before the initiation of image readout. Tissue motion can then be assessed by observing the distortion of the tag lines. In addition, the tag lines fade in the course of the cardiac cycle as the result of longitudinal relaxation (TI). As a result of tag line fading, high-field imaging can offer an important advantage in that myocardial TI increases with field strength. At 4.1 T, we have measured the TI of myocardium using inversion recovery (with TI = I , 2, and 3 RR intervals) obtaining a value of 1200 msec (versus 800 msec at 1.5 T). This increase in T1 over 1.5 T results in an improvement in tag line contrast ( ~ 3 8 % for ) image frames acquired 800 msec after the R-wave trigger. This comparison was based on images acquired using read and tag angles selected to maximize the sum of tag contrast across all image frames. Such a comparison is important because tagged images are typically intended for use in automated motion analysis programs. A common method of delivering tag excitations is the SPAMM (SPAtial Modulation of Magnetization) technique (1,2). This method uses a train of RF pulses with binomial intensity distribution separated by gradient pulses as shown in Fig. 1. The total flip angle of the exci-
Received May 25, 1998; Accepted December 4 , 1998 Address reprint requests to E. G . Walsh.
Copyright.0 1999 by Marcel Dekker, Inc
www .dekker.com
Walsh et al.
186 10 1-0
1010
5
5
5
5
RF G.
I A
.-IMnnn
A
Figure 1. Example of a grid tag pulse sequence for tagging studies. After the six-pulse binomial tag excitation and spoiler, gradient-echoreadouts were used for individual phases. Second set of tagging pulses are shifted in phase by 90 degrees to suppress stimulated echoes. Typical parameters: echo time, 3.9 msec; tag gradient duration, 1.5 msec; tag spoiler duration, 5 msec; read excitation angle, 20 degrees; composite tag excitation angle, 150 degrees. In the common k-space method, only one tagging excitation is needed to produce a grid tag pattern.
tation is equal to the sum of the individual flip angles. In frequency space (k-space), this excitation produces a series of delta (6)functions whose separation is determined by the area under the tag gradient waveforms. This result, in turn, determines the tag line spacing, which is given as 1
Ax=
Y
[
G(t)dt
where T is the duration of the gradient pulse and y is the gyromagnetic ratio. A characteristic of SPAMM tagging is a lack of tag intensity falloff near the edge of the FOV. Because the k-space velocity is zero during delivery of RF excitations, rapid gradient switching is required during the interpulse interval to provide adequate k-space coverage. The SPAMM method has been implemented on most commercial scanners. Another tagging method is the DANTE (Delays Alternating with Nutations for Tailored Excitations) technique (7). This method differs from SPAMM in that a string of short RF pulses of equal amplitude is delivered in the presence of a constant gradient. Again, the tag lines are perpendicular to the direction of the applied gradient. In the DANTE case, the applied gradient results in a constant transit through k-space, allowing adequate coverage in less time than required for SPAMM. However, intensity falloff near the edge of the FOV can be evident with
DANTE excitations. In addition, the tag line spacing and thickness are calculated in the same manner as for SPAMM. Because the tagging gradient does not vary during the excitation, it is more feasible to deliver a larger number of RF pulses, producing thinner tag lines. To increase the number of RF pulses in the S P A M M excitation requires increased gradient switching. A DANTE/SPAMM hybrid has been implemented that combines the advantages of both techniques (8). Using this strategy, a binomial RF excitation is delivered in the presence of a gradient (intensity of which is selected to reduce tag line intensity falloff by reducing k-space velocity during excitations). The gradient is switched to a higher intensity between pulses to increase k-space velocity in the manner of SPAMM tagging. This hybrid delivers tag excitations in less time than a SPAMM excitation (because gradient ramp times are shorter). The robustness of this technique depends on the performance of the scanner's gradient system and the degree of tag inhomogeneity that can be tolerated. For close tag line spacing ( I 5 mm), the use of 512' acquisitions is beneficial in improving tag contrast through reduced partial volume effects. The tag contrast in diastole is improved by partial inversion of tagged tissue at the start of the cardiac cycle. When close tag spacing is used, the contrast expected with partial tag inversion is generally not achieved at typical resolution (9). Improved contrast in 5 12' images compared with 256' images was noted in gel phantom images acquired with otherwise identical parameters. The k-space representation of gel phantom images (Fig. 2) indicate that for 2.5mm line spacing, the 256' acquisition does not capture some significant higher spatial frequency information found in the 5 12' example. Thus, acquiring data at 256' compared with 512' effectively introduces a blurring effect to the tag lines. Under such circumstances, simply increasing the tag inversion angle will not generate the expected improvements in tag contrast and may actually decrease contrast. The use of more elaborate RF excitations will also fail to generate expected improvements in tag contrast under conditions in which significant high spatial frequency information is not bcing sampled. There are several schemes for encoding k-space with tag information using the above excitations. A grid is produced by application of two excitations (using orthogonal in-plane gradients), with the resulting lines parallel to the image frame boundaries. Another method, described by McVeigh and Atalar (8),involves two line tag scans, each acquired with a reduced matrix of as little as 25%, as shown in Fig. 3 (because for a line tag data set most tag information is confined to a narrow region close to a k-
W Tagging in LV Function Studies
187
so 100
300 3x1
400 450
500 50
loo
150
200
250
too
xx)
300
400
500
Figure 2. k-space representations of tagged gel phantom images with 2.5-mm line spacing and FOV of 160 mm. All acquisition parameters for the two examples are the same except the size of the acquisition manix. The center of the 512’ example (right) is identical to the 256’ example (left), as expected. Some information, however, is seen in the high-order k-space region, which was sampled only by the 5 12’ acquisition. Failure to acquire this higher spatial frequency information will compromise tag contrast when close tag line spacings are used.
space axis). Typically, this method is designed for use with breathhold approaches. Such a technique requires switching of the read and phase-encode gradient assignments between the two line tag scans, which introduces constraints in the FOV to prevent foldover in the superior-inferior direction. Orthogonal line tag images can be combined to form a grid tag image data set. A third technique produces a grid, which appears as a “diamond” pattern because of the rotation of the tag grid by 45 degrees, seen in Fig. 4.
The location of delta functions projections onto the kspace axes (k, = 0, k, = 0) are moved closer to the center by a factor of allowing a reduced acquisition of kspace on the order of 40%. This approach produces the contrast-to-noise ratio (CNR) of the grid tag method but does not require switching in-plane gradient assignments. A fourth method is the common k-space technique (9). In this method, a single tag excitation is used to produce a grid tag pattern by exploiting tag information redundancy near the center of k-space. In the common k-space
6.
Figure 3. Left: Two short acquisitions may be used to obtain the orthogonal tag component information. Resulting images can be combined to produce grid tag information. Right: The “diamond” grid tag pattern as seen in the images at left is produced by using both tag gradients for each excitation to produce a 45-degree rotation of tag lines.
188
Walsh et al.
RF Tagging in LV Function Studies
method, the tag gradient is applied in the read direction for the center 25% (typically) of k-space, for the remaining k-space, the tag gradient is switched to the phase encode direction. The common k-space method results in an improvement in tag CNR compared with the twoexcitation grid tag as only one tag excitation is applied per cardiac cycle (8,9).Thus, the contrast advantage of the line tag method is realized without the FOV constraints imposed by the exchanging of the read and phaseencode gradient assignments of a two-acquisition approach. This technique produces an undistorted grid pattern provided that the first tag delta function in k-space along the phase-encode direction lies outside of the region in which the tag gradient is set in the read direction. If this requirement is not observed, the result is a grid in which one set of lines appears faded. The position of kspace tag delta functions is given by n(F0V)
6, = ___ Ax
where 6, is the position of delta functions in lines from the center of k-space, FOV is the field of view, Ax is the tag line spacing, and n = I , 2, 3. . . . For example, if the tag line spacing is 4 mm and the FOV is 25 cm, the kspace delta functions will appear 63 and126 lines from the center of k-space in a 256* image. Thus, switching the direction of the tag gradient at 25% (232) lines will satisfy the sampling condition. As the tag lines spacing increases, delta functions will move closer together, with 6 , moving closer to the center of k-space, which could require adjusting the tag gradient switch partition. In general, for clinical FOV and tag line spacings of 6 mm or less, the 25% boundary is suitable. A fifth method allows for variable tag spacing to tailor the initial separation of tag lines to the expected motion of the heart (10). For example, in regions experiencing tag separation over the course of systole, the tag lines can be initially closely spaced. Those regions in which circumferential shortening is expected in systole would receive tag lines with increased initial spacing. This technique is adaptable to individual heart sizes. Tagging excitations are delivered at the start of the cardiac cycle (on the R-wave trigger) with the result that in a multiphase imaging study, the rcgional motion of the myocardium can be evaluated by following the distortion
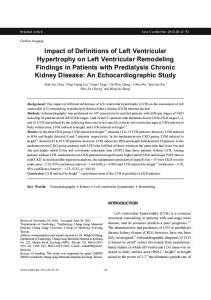
Figure 4. (A) Short-axis end-diastolic image with tags identified. (B) Long-axis end-diastolic images with tags identified. (C) Short-axis end-systolic image with tags identified. (D) Long-axis end-systolic image with tags identified.
189
of the grid lines as the myocardium moves. Multiphase image acquisitions typically use a gradient-echo readout (in which the ventricular blood pool appears bright). Typically, phase intervals of 20-40 msec are used, with the number of phases selected to fill enough of the cardiac cycle to observe diastolic filling. Some recovery time will be allowed after the acquisition of the last cardiac phase to permit reliable triggering on every heartbeat in the presence of small heart rate variations. Acquisitions can be performed in which one k-space line per phase per heartbeat is acquired or in a segmented manner in which multiple k-lines will be taken to correspond to each cardiac phase. Use of segmentation will result in a shorter acquisition time, but at some sacrifice in tag contrast due to tagged and untagged tissue being driven closer to the steady state by the increased number of RF excitations within the cardiac cycle (5,6). In either case, the result is a series of images representing the position of the myocardium at time points across the cardiac cycle. The tag lines fade over the cardiac cycle as the result of longitudinal relaxation of the tagged tissue. Tag line persistence is proportional to T1. which increases with main magnetic field strength. In a multislice short-axis study, grid tagging can provide for hundreds of material points that can be automatically tracked by analysis programs to provide a whole-heart analysis of myocardial motion and thickening as long as the tag lines persist into the cardiac cycle with sufficient contrast for tracking. Validation of the ability of RF tagging to accurately measure material motion has been validated both in stationary deforming phantoms and in moving phantoms (11-13).
EXPERIENCE WITH VENTRICULAR FUNCTION STUDIES IN PATIENTS As discussed by McVeigh (14), the information to be extracted from tagged data sets relates to the six components of the strain tensor as a function of position in the cardiac cycle. This parameter permits analysis of the local deformations in the myocardium in the presence of bulk motion (rotation and translation) that may be greater in magnitude than local deformations but do not provide indications of regional contractile performance. The analysis process begins with the identification of tag positions for each frame of the multiphase data set (10,11,15-17). Because a deforming tag line only gives displacement information perpendicular to the tag line direction, a grid tag pattern can be used to provide complete in-plane displacement information by tracking of the grid intersec-
Walsh et al.
190
tions. An additional consideration in RF tagging relates to the through-plane motion. Specifically, the material tagged and imaged in the first phase is not necessarily associated with that imaged in end systole. This problem can be addressed by imaging in the orthogonal direction (i.e., long axis) over the entire ventricle with tagging (18-20). with phase velocity mapping (21,22), or by a subtraction technique to isolate a tagged slice in a thicker reference (23). It is interesting to note that tag position resolution can be estimated to a resolution of 0.1 pixel provided the CNR > 10 and the tag has a full-width/ half-maximum of 1.5 pixels (1 1). In the ventricular function imaging of 10 normal volunteers, analysis of RF tagged images has shown that the pattern of circumferential shortening was consistent, with a low standard deviation of shortening when comparing corresponding regions among the 10 subjects (14). Significant differences were observed when comparing different regions, such as lateral wall versus septum. The study indicated that a typical regional ventricular function could be defined quantitatively for normal subjects. RF-tagged ventricular function imaging has been used for analysis of a number of conditions that produce wall motion abnormalities. An important example of such a condition is the compensatory increase in contraction in regions remote from an early infarct (24). In this study, which used aged-matched volunteers, an increase in the first principal strain of approximately 9% (possibly the result of the Frank-Starling mechanism) was noted in remote regions, whereas a decrease of 13% was seen in the early infarct regions. This study demonstrated the ability of RF-tagged imaging to delineate regions of normal function, dysfunction, and increased function in a quantitative manner using the parameters lengthening and shortening eigenvalues, direction of lengthening, and displacement. With adequate spatial and temporal resolution for motion analysis, it is possible to produce graphic renditions of the three-dimensional myocardial performance (13,25-29), examples of which are shown in Fig. 5. One example of clinical application would be in the diagnosis of left ventricular hypertrophy, which strongly predicts subsequent morbidity and mortality in patients with hypertension. Left ventricular hypertrophy is both a major adaptive response to chronic pressure overload and an important risk factor in patients with hypertension. Furthermore, conventional analyses of left ventricular pump function generally show normal to supernormal systolic function in patients with hypertensive left ventricular hypertrophy (30,3 1). However, numerous studies
of myocardial contractile function of isolated papillary muscles taken from hypertrophied left ventricles in experimental animal models suggest that myocardial performance may in fact be depressed in left ventricular hypertrophy with normal ejection fraction (32). A similar analysis of segmental myocardial function in humans has been limited to date by dependence on highly invasive methods such as surgical implantation of sonomicrometry crystals or metallic markers in the myocardium. The potential for application of R F tagging studies in electrophysiologic studies has been demonstrated in imaging of the left ventricular mechanical activation during paced studies (33). Such a technique could be applied to the detection of abnormal conduction pathways and testing the efficacy of pacing techniques. In canine studies, an MR-compatible pacing system was used with filtered leads (to eliminate potentials induced by RF signals and gradient switching) placed on the heart. Multiple tag data sets (to obtain three-dimensional motion information) were acquired with temporal resolution as short as 13 msec using a segmented k-space acquisition and breathholding. In this study, right atrial pacing was found to produce a uniform ventricular activation. When paced from a ventricular site, a heterogeneous and asynchronous mechanical activation pattern was observed. These abnormalities were visible both in cine loops and in left ventricular strain evolution maps.
-
HIGH-FIELD TAGGING RF tagging studies are compatible with surface coil use in animal research protocols, particularly when adiabatic tagging is used to reduce tag contrast dependence on the B , distribution of the surface coil (34). Figure 6 shows a 12-phase data set taken with a 20-cm surface coil at 4.1-T with 512’ resolution and a 30-msec phase interval (heart rate, 125 bpm). For a myocardial TI of 1200 msec (our measurements, using double-gated inversion recovery with TI = 1, 2, 3 RR intervals), the optimum tag contrast for the entire cardiac cycle is achieved using a read flip angle of approximately 10 degrees and a composite tag flip angle of 140 degrees (based on phantom studies in which overall contrast was defined as the sum of tagluntag CNR across the multiphase data set). In these studies, the peak CNR was as high as 100, with peak CNR of 75-100 typical over the cardiac cycle from the proximal region of myocardium. Distal myocardium typically had a peak tag CNR of 20-30. This gradientecho acquisition (nonsegmented) used a low-high phase-
-
RF Tagging in LV Function Studies
A
C
191
B
D
Figure 5. (A) Finite element model at end diastole, as seen from posterior wall with septum to the right. Surface is shaded at endocardium. FE model fitted using a previous method (23). (B) FE model at end systole, note longitudinal shortening and ventricular torsion. (C) FE model at end diastole with an LA and an SA texture mapped onto their respective planes in 3D. (D) As with ED FE model with principal strains between ED and ES marked as cross hairs. Note maximum contraction strain is in the direction of the epicardial muscle fibers. FE, finite element; LA, long axis; SA. short axis; ED. end diastole; ES, end systole.
encode acquisition order. The distribution of high spatial frequency information in k-space has important implications for the use of certain respiratory motion compensation methods such as respiratory ordered phase encoding (35,36) in which higher order phase-encode lines are ac-
quired during periods of substantial diaphragmatic displacement. This phase-encode reordering is done under the assumption that the higher order lines contain very little signal and thus contribute minimally to observed image quality. ASshown in Fig. 2, however, high-resolu-
Walsh et al.
192
The identification of abnormal myocardial deformation in the setting of a normal left ventricular ejection represents a biologically important event that may herald the transition to heart failure. A significant milestone in the clinical applicability of RF tagging for ventricular function studies will be the inclusion of on-line analysis programs as a part of clinical scanner software (38). Such analysis packages will permit quantitative diagnosis of regional ventricular function while the patient is in the magnet, allowing for carefully targeted imaging protocols on an individual basis.
ACKNOWLEDGMENTS
Figure 6. In vivo canine images (zoomed regions) taken with a surface coil at a heart rate of 125 bpm, phase interval 30 msec, tag spacing of 2.5 mm. Pixel resolution is 0.46 mm (512?acquisition, 240 mm FOV).
We thank Dr. Hoby Hetherington for technical assistance in the initial implementation of these experiments on the 4.1-Twhole-body scanner at UAB. Valuable assistance in the animal preparations was provided by Charlye Brocks and Clarence Forrest. Funding for the high-field imaging study was provided by the National Institutes of Health though the NCRR grant P41- 14 8 1 1 Core Project III. Figures 4 and 5 were provided by Dr. Alistair Young, University of AucMand, New Zealand.
REFERENCES 1.
tion tag studies do produce significant information at the higher spatial frequencies, and because their omission affects tag line definition to a noticeable degree, their reordering to periods of high respiratory motion could compromise the tag information.
3.
CONCLUSION
4.
Availability of reliable tracking and analysis software will permit increased use of RF-tagging techniques in research and clinical ventricular function studies. MRI tissue tagging permits precise analysis of deformation of myocardial tissue by monitoring the motion of identifiable material points distributed throughout the myocardium. Although left ventricular ejection fraction and estimated mean midwall end-systolic stress are normal in compensated hypertensive left ventricular hypertrophy, direct studies with MRI tissue tagging demonstrate reduced intramural deformation, even in patients with only mild echocardiographic left ventricular hypertrophy, normal electrocardiogram, and normal ejection fraction (37).
2.
5.
6.
7. 8.
9.
Zerhouni EA, Parish DM, Rogers WJ, Yang A and Shapiro EP. Human heart: Tagging with MR imaging-a method for non-invasive assessme_ntof myocardial motion. Radiology, 1988; 16959-63. Zerhouni EA and Parrish DN. Tissue tagging of the human heart by MRI.U.S.Patent 4953554, 1990. Axel L and Dougherty L. Heart wall motion: Improved method of spatial modulation of magnetization for mr imaging. Radiology, 1989; 172:349-350. Axel L and Dougherty L. MR imaging of motion with spatial modulation of magnetization. Radiology, 1989; 17 1:841-845. Reeder S L and McVeigh ER. Tag contrast in breathhold cine cardiac MRI. Magn Reson Med, 1994; 3 1521525. Tang C, McVeigh ER and Zerhouni EA. Multi-shot EPI for improvement of myocardial tag contrast: Comparison with segmented SPGR. Magn Reson Med, 1995; 33:143447. Mosher TJ and Smith MB. A DANTE tagging sequence for the evaluation of translational sample motion. JMagn Reson, 1990; 15:334-339. McVeigh ER and Atalar E. Cardiac tagging with breath hold cine MRI. Magn Reson Med, 1992; 28:318-327. Doyle M, Walsh EG, Foster RE and Pohost GM. Com-
RF Tagging in LV Function Studies
10.
11.
12.
13.
14.
15.
16.
17.
18.
19.
20.
21.
22.
23.
24.
mon k-space acquisition: A method to improve myocardial grid-tag contrast, Mugn Reson Med, 1997; 37:754763. McVeigh ER and Bolster BD. Improved sampling of myocardial motion with variable separation tagging. Magn Reson Med, 1998; 39:657-661. Atalar E and McVeigh ER. Optimum tag thickness for the measurement of position with MRI. IEEE Trans Med Imaging, 1994; 13,1:152-160. Moore CC, Reeder SB and McVeigh ER. Tagged MR imaging in a deforming phantom-photographic validation. Radiology, 1994; 190:765-769. Young AA, Axel L, Dougherty L, Bogen DK and Parenteau CS. Validation of MRI tagging to estimate material deformation. Radiology, 1993; 188: 101- 108. McVeigh ER. MRI of myocardial function: motion tracking techniques. M a p Reson Imaging, 1996; 14: 137-150. McVeigh ER and Zerhouni EA. Noninvasive measurement of transmural gradients in myocardial strain with magnetic resonance imaging. Radiology, 1991; 180:677683. Guttman M, Prince JL and McVeigh ER. Contour estimation in tagged cardiac magnetic resonance images. IEEE Trans Med Imaging, 1994; 13:74-88. Kraitchman DL, Axel L and Young AA. Springs: A fast method for detection and correspondence of cardiac magnetic resonance tags. Magn Reson Med, 1993; 725. O’Dell WG, Moore CC, Hunter WC, Zerhouni EA and McVeigh ER. Displacement field fitting for calculating 3D myocardial deformations from tagged MR images. Radiology, 1995; 195:829-835. Young AA and Axel L. Three-dimensional motion and deformation of the heart wall: Estimation with spatial modulation of magnetization-a model-based approach. Radiology, 1992; 185:241-247. O’Dell WG, Moore CC and McVeigh ER. Displacement field fitting approach to calculate 3D deformations from parallel-tagged MR images. J Mugn Reson Itnag, 1993; 3: 124. Axel L and Dougherty L. System and method for magnetic resonance imaging of 3 dimensional heart wall motion with spatial modulation of magnetization. U.S. Patent 51 11820, 1994. Perman WH, Creswell LL, Wyers SG. Moulton MJ and Pasque MK. Hybrid DANTE and phase-contrast imaging technique for measurement of three-dimensional myocardial wall motion. J Mrign Reson Imng. 1995; 5: 101- 106. Fischer SE, McKinnon GC, Scheidegger MB, Prins W, Meier D and Boesiger P. True myocardial motion tracking. Magn Reson Med, 1994; 31:403-413. Marcus JT, Gotte MJW, van Rossurn AC, Kuijer JPA, Heethaar RM, Axel L and Visser CA. Myocardial function in infareted and remote regions early after infarction in man: Assessment by magnetic resonance tag-
193
25.
26.
27.
28.
29.
30.
31.
32.
33.
34.
35.
36.
37.
38.
ging and strain analysis, Magn Reson Med, 1997: 38: 803-8 10. Young AA and Axel L. Three-dimensional motion and deformation of the heart wall: Estimation with spatial modulation of magnetization-a model-based approach. Radiology, 1992; 185:241-247. Young AA, Imai H, Chang C-N and Axel L. Two-dimensional left ventricle motion during systole using MRI with SPAMM. Circulation, 1993; 89:740-752. Young AA, Kramer CM, Ferrari VA, Axel L and Reichek N.Three-dimensional left ventricular deformation in hypertrophic cardiomyopathy. Circulation, 1994; 90354867. Young AA, Kraitchman DL, Dougherty L and Axel L. Tracking and finite element analysis of stripe deformation in magnetic resonance tagging. IEEE Trans Med h a g , 1995; l4:4 13-42 1. Young AA, Fayad FA and Axel L. Right ventricular midwall surface motion and deformation using magnetic resonance tagging. Am J Physiol, 1996; 271:H2677H2688. Strauer BE. Ventricular function and coronary hemodynamics in hypertensive heart disease. Am J Cardiol, 1979; 44~999-1006. Hartford M, Wikstrand JCM, Wallentin I, Ljungman SMG and Berglund GL. Left ventricular wall stress and systolic function in untreated primary hypertension. Hypertension, 1985; 7:97- 104. Bing OHL, Matsushita S. Fanburg BL, Levine BL and Levine HJ. Mechanical properties of rat cardiac muscle during experimental hypertrophy. Circ Res, 197 1 ; 28: 234-245. McVeigh ER, Prinzen FW, Wyman BT, Tsilik JE, Halperin HR and Hunter WC. Imaging asynchronous mechanical activation of the paced heart with tagged MRI. Magn Reson Med, 1998; 39507-513. Tsekos NV, Garwood M, Merkle H, Xu Y, Wilke N and Ugurbil K. Myocardial tagging with B, insensitive adiabatic DANTE inversion sequences. Mayn Reson Med, 1994; 34:395-40 I . Bailes DR, Gilderdale DJ. Bydder GM, Collins AG and Firmin DN. Respiratory ordered phase encoding (ROPE): A method for reducing respiratory motion artifacts in MR imaging. J Comp Assist Tomogr, 1985; 9:835-838. Haacke EM and Patrick JL. Reducing motion artifacts in two-dimensional Fourier transform imaging. Mugn Reson Imaging. 1986; 4:359-376. Palmon LC, Reichek N, Yeon SB, Clark NR, Brownson D, Hoffman E and Axel L. Intramural shortening in hypertensive left ventricular hypertrophy with normal pump function. Circulation, 1994; 89: 122- 13I . Guttman MA, Zerhouni EA and McVeigh ER. Fast techniques for on-line analysis of cardiac MR tagged images. Book of Abstracts, Society of Magnetic Resonance, Nice, France, 1995:41.