1702
JOURNAL OF CLIMATE
VOLUME 15
Recent Temperature Changes in the Western Arctic during Spring* JAMES E. OVERLAND NOAA/Pacific Marine Environmental Laboratory, Seattle, Washington
MUYIN WANG
AND
NICHOLAS A. BOND
Joint Institute for the Study of the Atmosphere and Oceans, University of Washington, Seattle, Washington (Manuscript received 28 August 2001, in final form 2 January 2002) ABSTRACT The lower troposphere of the western Arctic (eastern Siberia to northern Canada) was relatively warm during spring in the 1990s. Based on the NCEP–NCAR reanalysis, supplemented by the Television Infrared Observational Satellite (TIROS) Operational Vertical Sounder (TOVS) Polar Pathfinder dataset, this warmth is a result of a recent increase in the frequency of warm months, compared to the previous four decades. The primary difference between four notably warm springs in the 1990s and four cold springs in the 1980s was the sense of the horizontal advection term in a lower-tropospheric heat budget for northern Alaska/southern Beaufort Sea. While the horizontal advection of heat was highly episodic, it was related to changes in the mean circulation at low levels, in particular a shift from anomalous northeasterly flow in the 1980s to anomalous southwesterly flow in the 1990s during March and April. This change in the low-level winds in the western Arctic coincided with a systematic shift in the Arctic Oscillation (AO) near the end of the 1980s, and reflects the equivalent barotropic nature of the AO. The stratospheric temperature anomalies associated with the AO were greatest in March; the low-level wind anomalies brought about near-surface temperature anomalies in northern Alaska that peaked in April. In addition to substantial decadal differences, there was considerable month-to-month and yearto-year variability within the last two decades.
1. Introduction Much of the recent work on Arctic climate variability has focused on the winter period (e.g., Thompson and Wallace 1998; Monahan et al. 2000; Shindell et al. 2001). But at least in the western Arctic, here defined as the region extending from eastern Siberia across Alaska to northern Canada, many striking changes in surface conditions have occurred in the spring. Stabeno and Overland (2001) note an early and rapid ice melt in the Bering Sea in the 1990s compared to the 1980s. The duration of open water in Resolute Bay, Canada, is over 50 days longer in the 1990s than earlier decades (Canadian Ice Service 2000, personal communication). Stone (1997) found a prominent, long-term warming trend in springtime surface temperature records at Barrow, Alaska. Native communities report that recent * Fisheries–Oceanography Coordinated Investigations Contribution Number B401; Pacific Marine Environmental Laboratory Contribution Number 2348; Joint Institute for the Study of the Atmosphere and Oceans Contribution Number 801. Corresponding author address: James E. Overland, NOAA/Pacific Marine Environmental Laboratory, Building 3, 7600 Sand Point Way NE, Seattle, WA 98115. E-mail:
[email protected]
q 2002 American Meteorological Society
springs have featured earlier retreat of ice and a faster rate of breakup, increased depth of the active permafrost layer, and less predictable weather (Riedlinger and Berkes 2001). Spring may be a critical season with respect to climate change because the return of the sun at high latitudes initiates potential positive feedbacks. These include effects related to interactions between atmospheric dynamics and chemistry in the stratosphere, and between albedo and the melt of snow and sea ice. Regarding the stratosphere, Pawson and Naujokat (1999) found that the 1990s included years that had stratospheric temperatures cold enough to support polar stratospheric clouds, which had not been characteristic of the Arctic. The presence of these clouds tends to exacerbate the destruction of stratospheric ozone in the spring, which in turn tends to reduce the local absorption of UV radiation, and hence promotes cold anomalies. Regarding surface albedo effects, an 8-day advancement of the timing of snowmelt in the Barrow region has occurred since the 1960s. This absence of snow cover has caused the net radiative heat flux at the surface to increase by more than 100 W m 22 locally over that 8-day period (Stone et al. 2002). In this paper we conduct a diagnostic study of changes that have occurred in the western Arctic near the surface
1 JULY 2002
OVERLAND ET AL.
and in the lower stratosphere. A primary aspect of this study is to examine whether the characteristic signature of the Arctic Oscillation (AO) carries over into spring. Special attention is devoted to comparing the 1980s with the 1990s, and how this decadal change was manifested in individual years. We pursue the dynamics behind the observed changes through analysis of the principal contributions to the low-level thermodynamic energy budget. We begin by discussing the data sets used in our analysis, the National Centers for Environmental Prediction–National Center for Atmospheric Research (NCEP–NCAR) reanalysis and the Television Infrared Observational Satellite (TIROS-N) Operational Vertical Sounder (TOVS) Polar Pathfinder (Path-P) product. We illustrate decadal and monthly variability in the western Arctic using time series at Barrow, Alaska, and Eureka, Canada. These time series show striking differences during spring between the 1990s and the previous four decades. We then explore the hemispheric patterns of temperature differences between these decades as a function of season, both aloft and near the surface. Finally, we document the mechanisms responsible for the anomalous lower-tropospheric warming observed in the western Arctic during spring in the 1990s. 2. Datasets It is difficult to develop a consistent, unbiased long record of the thermal structure in regions where conventional observations are sparse in space and time. Here, we make use of two hemispheric datasets. The first is the NCEP–NCAR reanalysis (Kalnay et al. 1996; Kistler et al. 2001), which provides a full suite of atmospheric parameters on a 2.58 3 2.58 grid from 1948 to the present. There is good coverage of rawinsonde data along the Arctic coast for assimilation into the reanalysis. The second is the TOVS Path-P dataset (Francis and Schweiger 2000), which provides temperature and humidity analyses north of 608N on a 100 3 100 km 2 grid for the period 1979–98. The reanalysis uses a ‘‘frozen’’ data assimilation model system over the period of record and hence has temporal consistency, but includes relatively few observations from the central Arctic. The TOVS Path-P dataset is based on satellitemeasured radiances that provide relatively good horizontal resolution in temperature and humidity in the central Arctic, but with uncertainties in calibration. In an overall sense, the reanalysis is best suited for describing temporal changes and for diagnostic calculations, since it includes both thermodynamic and kinematic parameters in dynamical balance, while the TOVS Path-P is best suited for describing details in horizontal gradients in temperature. The TOVS Path-P dataset depends on measurements from a series of satellites, and the calibrations that need to be applied to the data prior to 1986 are unknown. We have adjusted the temperature from the TOVS Path-P for the purposes of the present
1703
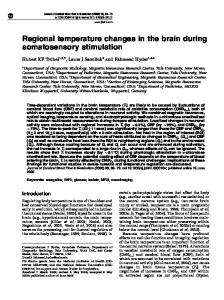
analysis; the details of this adjustment are covered in the appendix. Our analysis relies principally on the reanalysis dataset. This source is used to illustrate the changes in the climate of the western Arctic over the last half of the twentieth century, and for estimates of terms in the thermodynamic energy budget. The TOVS Path-P dataset is used to compare the details of the structure of the temperature anomalies of the 1990s with those in the 1980s. An important result of our analyses using the two datasets is that the temperature fields in the reanalysis were found to be similar to those in the TOVS Path-P, even though the former has relatively meager data available for the central Arctic. This result indicates that diagnostic calculations from the reanalysis for the Arctic are reasonably robust. 3. Decadal changes at Barrow and Eureka The decadal-scale variability in western Arctic temperatures is illustrated in Fig. 1 using data from the reanalysis at a grid point near Barrow, Alaska (72.58N, 157.58W), and Eureka, Canada (808N, 858W). Values are anomalies from the 1948–99 monthly means. Our base decade is 1989–98 because of a prominent shift in the AO in 1989, so that 1989 groups with the 1990s. We are most interested in documenting the changes accompanying the 1989 shift, rather than the more general problem of detecting shifts. Figures 1b and 1d show the decadal-averaged temperature anomalies for each month at the 925-hPa level for the 1950s through the 1990s. Figures 1a and 1c show their counterparts at the 200hPa level in the lower stratosphere. Values at 200 hPa are qualitatively similar to other stratospheric levels. Values at 925 hPa are similar, but stronger than anomalies at higher-tropospheric levels. At the 925-hPa level (Figs. 1b and 1d), prominent warm anomalies occurred during the 1990s at Barrow through the entire spring and at Eureka during April. The magnitudes of these anomalies for April in the 1990s are greater than the magnitude of the anomalies in any other month and any other decade. The springs of the 1960s through 1980s tended to be relatively cold at both stations. More detailed comparisons between the cool period of the 1980s and the warm period of the 1990s are presented in section 5. Note that the 925-hPa temperature records indicate that the western Arctic experienced a stronger response in spring than in winter to the 1989 shift in the AO (Thompson and Wallace 1998). In particular, the 925-hPa temperature anomalies at Barrow in the middle of winter (December–February), on the whole, were actually positive in the 1980s and near zero in the 1990s. Lower-stratospheric temperatures, as indicated by the 200-hPa temperature anomalies in Figs. 1a and 1c, were relatively cool during spring in the 1990s, especially in March. Spring temperatures were relatively warm in the 1970s, and to a lesser extent, in the 1980s. In the lower
1704
JOURNAL OF CLIMATE
VOLUME 15
FIG. 1. The monthly temperature anomaly averaged over each decade from the 1950s to 1990s at the closest grid point from (a), (b) Barrow, Alaska, and (c), (d) Eureka, Canada based on NCEP–NCAR reanalysis at (a), (c) 200 and (b), (d) 925 hPa.
stratosphere, at least at these two stations, the signature of the 1989 shift in the AO appears most prominent in March. This time of year is also when the zonal winds at Barrow had their greatest positive (westerly) anomalies at 200 and 925 hPa during the 1990s (not shown). Our results are consistent with the analysis of North American tropospheric and stratospheric temperature trends from radiosondes by Angell (1999) for the period of 1975–94. It is clear that spring, on the whole, was colder aloft and warmer near the surface in the 1990s than in previous decades. It is instructive to consider how individual years contribute to these composites. Figure 2 shows March and April temperature anomalies at 200 and 925 hPa for Barrow as a function of year beginning in 1948. Prominent cold anomalies occurred at 200 hPa in March of 1990, 1993, 1995, and 1997. The magni-
tudes of these anomalies are roughly equivalent to their counterparts in earlier cold years (1956, 1960, 1967). The 1990s were cold as a whole because of the increased frequency of cold years. Similarly, the warm period of the 1970s through the mid-1980s is largely due to a preponderance of warm years, rather than due to an increase in the magnitudes of the anomalies in the warm years. The interannual fluctuations at 925 hPa have the same nature as those aloft. In particular, in April during most years in the 1980s (1990s) the 925-hPa temperature anomalies were negative (positive). Again it is the frequencies of these anomalies of like sign, rather than their magnitudes, that account for the decadal signal in 925-hPa temperature. There is a tendency for recent years with significant 200-hPa temperature anomalies in March to be followed by 925-hPa temperature anomalies of opposite sign in April. The year of 1984 had
1 JULY 2002
OVERLAND ET AL.
1705
FIG. 2. The monthly temperature anomaly at Barrow for Mar (solid line with square) and Apr (gray line with triangle) at (a) 200 and (b) 925 hPa.
the coldest April of record at 925 hPa, and a substantial warm anomaly at 200 hPa in March. Of the six years in the 1990s with substantial warm anomalies at 925 hPa in April (1990, 1991, 1993, 1995, 1997, and 1998), four years had corresponding cold anomalies at 200 hPa in March (1990, 1993, 1995, and 1997). 4. Relation to hemispheric patterns We now examine how the decadal changes in the vicinity of Barrow and Eureka compare with those for the Arctic as a whole. Figure 3 shows the spatial pattern of decadal change for the 1990s (1989–98) minus the 1980s (1980–88) at two levels: 200 and 900 hPa. These fields are based on the TOVS Path-P temperature analyses with corrections, as discussed in the appendix. The months of January, March, April, and May are shown. January is used to illustrate the pattern of decadal change in the middle of winter; March–May are used to illustrate the evolution of these changes from the end of winter into spring. For the month of January, the 1990s as compared with the 1980s were actually slightly warmer aloft, and cooler near the surface, for the Arctic as a whole (here considered the region poleward of 608N) and Alaska in particular. It did warm at low levels over Scandinavia and the Barents Sea from the 1980s to the 1990s; this
change is consistent with a shift to a systematically positive phase in the North Atlantic Oscillation (NAO). A positive sense to the NAO includes positive zonal wind anomalies across the North Atlantic, and hence the anomalous advection of relatively warm, maritime air masses across Scandinavia and the Greenland–Iceland– Norwegian (GIN) Sea (e.g., Hurrell 1995). Much different results were found for the spring months. In March, the 1990s featured much colder (5 K) 200-hPa temperatures than the 1980s in a quasisymmetric pattern centered near the Pole. These cool conditions aloft in the 1990s persisted into April, but weakened, such that they were absent by May. These trends in springtime lower-stratosphere temperatures were followed by warm anomalies, for the most part, at 900 hPa. Here the most prominent decadal differences were in April, and in a less zonally symmetric pattern than aloft. Especially pronounced warming (3 K) occurred over Alaska, the Beaufort Sea, and northern Canada in the western Arctic, and the Kara Sea in the eastern Arctic. The decadal temperature changes at 900 hPa persisted into May. The decadal differences in temperature at 200 and 900 hPa (Fig. 3) over large areas of the Arctic are substantially greater than uncertainties in these temperatures, as gauged by differences between temperature fields calculated using different data sources and methods of analysis (Gaffen et al. 2000; Chelliah
FIG. 3. The decadal monthly mean temperature change between 1990s (1989–98) and 1980s (1980–88) at (top) 200 and (bottom) 900 hPa based on TOVS Path-P gridded satellite dataset. From left to right, the panels are for Jan, Mar, Apr, and May. Greenland is a data void.
1706 JOURNAL OF CLIMATE VOLUME 15
1 JULY 2002
OVERLAND ET AL.
FIG. 4. Decadal-averaged monthly AO index based on data provided by D. Thompson from his AO Web site (see text for address) for the 1960s–1990s.
and Ropelewski 2000). Similar conclusions are valid if we had considered data from 50 hPa in place of 200 hPa. Our maps for the temperature differences at 200 hPa between the 1990s and 1980s show that March had the clearest signature of the classic quasi-symmetric pattern associated with the AO. This result is consistent with the study of Pawson and Naujokat (1999), which found that the Arctic stratosphere was especially cold, and the polar vortex was especially strong, in the 1990s at the end of winter. The polar vortex has tended to persist longer into spring over the last decade (Waugh et al. 1999). March into April also seems to be the time of year in which lower-stratospheric conditions are most consistently related to those near the surface: temperature anomalies on monthly timescales in the troposphere tend to be out of phase with those in the lower stratosphere, with a crossover point near the 300-hPa level. The polar vortex weakens dramatically as spring progresses. By May the linkages between temperature anomalies in the lower stratosphere and troposphere are much less pronounced as the summertime circulation is usually in place in the stratosphere. The continuation of low-level warm anomalies into May in the 1990s might have been caused in part by reductions in snow and sea ice and hence surface albedo. To compare the seasonality of the western Arctic with the AO index, we obtained the monthly AO values online (http://www.atmos.colostate.edu/ao/Data/ao.index.html). We then computed the monthly means for each decade as we did for Fig. 1; results are presented in Fig. 4. Similar to the temperature anomalies shown in Fig. 1, the AO index has a large positive anomaly in late winter during the 1990s compared to the previous four decades, with a peak in February and large values in January and March. The AO index models the general character of
1707
the polar vortex temperatures (Figs. 1a and 1c), although it peaks earlier. It is interesting to examine how lower-stratospheric temperature anomalies in individual years compare with the decadal mean temperature signal presented above. Figure 5 shows the spatial distribution of temperature anomalies at 200 hPa for each March from 1990 to 1998. Anomalies are based on deviations from the 1980–98 mean formed from the corrected TOVS Path-P dataset. Three of the years, 1990, 1995, and 1997 featured zonally symmetric cold anomalies over virtually the entire Arctic. Three other years, 1993, 1994, and 1996 were also relatively cool near the Pole and for the Arctic as a whole, but in a less symmetric manner. The remaining three years, 1991, 1992, and 1998, were warmer, with decidedly asymmetric temperature anomaly patterns. Thus during the 1990s, the cold anomalies aloft, representing one of the principal signatures of the positive phase of the AO, were present strongly in 3 years, and modestly in 3 other years, of the 9-yr period. From a western Arctic perspective, substantial cold anomalies aloft occurred when the polar vortex was strongly enhanced, as in 1990, 1995, and 1997, and when the polar vortex was not as strong but displaced from the Pole to over the western Arctic, as in 1993. Temperature anomaly fields at 200 hPa for March of 1999–2001 are shown in Fig. 6. These fields are based on the NCEP reanalysis using the mean for 1948–99 in calculating anomalies. The year 2000 featured continued cold conditions in the lower stratosphere as shown by Manney and Sabutis (2000). The years 1999 and 2001 had warm anomalies. In particular, the AO was in a significantly negative phase during the late winter and spring of 2001, which resulted in relatively large amplitude standing waves in the high-latitude flow in the Northern Hemisphere (not shown). It is unknown whether this represents a shift to a multiyear regime favoring a negative AO, or just a temporary hiatus from the largely positive AO state of the last decade or so. 5. Low-level heat budget for warm and cold years In this section we investigate the processes important to the springtime heat budget for the lower troposphere (850 hPa) over northern Alaska and the southern Beaufort Sea. As noted in the discussion of Fig. 2, April had six warm years in the 1990s: 1990, 1991, 1993, 1995, 1997, and 1998. Heat budgets are evaluated for the four years (1990, 1993, 1995, and 1997) that had cold stratospheric temperature anomalies in March. For comparison we investigate four years from the 1980s with a relatively cold lower troposphere in April: 1980, 1982, 1984, and 1987. Of these years, 1980 and 1984 had warm anomalies in the Arctic stratosphere in March. The heat budget equation in pressure coordinates can be written as
1708
JOURNAL OF CLIMATE
VOLUME 15
FIG. 5. Mean temperature anomalies at 200 hPa in Mar for the 1990s, derived from gridded TOVS Path-P satellite temperature data.
]T Q 5 2V · =T 1 gv 1 , ]t CP
(1)
where T is temperature, V is the horizontal wind vector, v is the vertical velocity in pressure coordinates, and C p is the specific heat capacity. The diabatic heating rate Q will be treated as residual and is primarily related to longwave radiative processes, but does include the effects of shortwave radiation and sensible
and latent heating. The static stability parameter, g , is defined as RT ]T g5 2 , (2) Cp P ]P where R is the gas constant, and P is pressure. The temperature tendencies are calculated from daily values from the NCEP–NCAR reanalysis averaged over the five closest grid points to Barrow, Alaska. We chose
1 JULY 2002
OVERLAND ET AL.
1709
FIG. 6. Mean temperature anomalies at 200 hPa in Mar for (left) 1999, (middle) 2000, and (right) 2001 based on the NCEP–NCAR reanalysis. The climatology is based on 1948–99, as in Figs. 1 and 2.
850 hPa as a representative level for the lower troposphere. Results were qualitatively similar at other levels between 925 and 500 hPa. The results at 925 hPa are compromised, to a certain extent, because improper specification of the static stability at the 925-hPa level produces errors in the vertical advection term. Because we are interested in how the cumulative effects of the processes impacting the heat budget contribute to the monthly temperature anomalies, we have chosen to present time integrals of the terms in (1). Thus, a particular warming or cooling event is manifested as a change in slope of the traces on the plots. Units are in K, which provide a quantitative comparison of the influence of each term on the temperature record. The March–April time series of 850-hPa temperature, and the time integral of the horizontal advection, vertical advection, and residual terms of (1) during 1990, 1993, 1995, and 1997 for Barrow, are shown in Fig. 7. The time series of temperature show that the springtime warming can be more-or-less slow and steady for periods as long as a month, but is also punctuated by positive and negative temperature changes as large as 20 K over a few days. In large part, these fluctuations are attributable to day-to-day changes in horizontal heat advection. This term is more episodic than the other terms in most years, with 1993 representing an exception. For example, in 1990 there was one event, from 19 to 23 March, that produced roughly two-thirds of the total warming of 30 K due to horizontal advection. In 1995, there were two periods of enhanced warm advection, and two periods of substantial cold advection, each lasting roughly 4–7 days. Alternating cold and warm advection, with a near-neutral baseline, characterized the horizontal advection term in 1997. The magnitude of the horizontal advection term integrated over the 2-month period ranged from 30 K in 1990 and 1997 to 80 K in 1995. Strong warm advection events were often, but by no means universally, accompanied by upward motion and hence the compensating effects of the vertical advection term on the heat budget. Except for these occasional events, there was usually subsi-
dence, and hence a rather steady contribution from the vertical advection term toward the springtime warming. The range in magnitude of this term over the 2-month period is from 40 K in 1990 to 80 K in 1993. The residual term in each year showed more-or-less steady cooling, with occasional brief periods of slight warming. The rate of the cooling due to the residual (and mostly diabatic) term varied from year to year, ranging from about 2120 K in 1993 and 1995 to roughly 260 K in 1990 and 1997. We now examine the heat budgets at 850 hPa for the cold years in the 1980s (Fig. 8). The horizontal advection term in the 1980s, as in the 1990s, included substantial week-to-week variability. But the cold years in the 1980s also include periods of longer and stronger cooling due to horizontal advection. While net warming was found for this term in the 1990s, the March–April time integrals in the 1980s ranged from a cooling of 280 K in 1980 to near-zero values in 1982 and 1984. The vertical advection term in the 1980s was similar in its character in the 1990s in that it contributed toward warming at a fairly steady pace. The magnitudes of this term were larger in the 1980s (ranging from 60 K in 1982 to 140 K in 1980), because the subsidence tended to be stronger in the 1980s than the 1990s. Finally, the residual term contributed toward roughly three-quarters of the cooling in the 1980s (2100 K in 1984 to 250 K in 1980 and 1987) as it did in the 1990s. We note little temperature change from March to April in these years. The heat budget results for the Barrow region for the selected years in the 1980s and 1990s are summarized in Table 1. The amount of warming over the March– April period in the selected years of the 1990s was double that during the selected years in the 1980s. But this warming represents a relatively small difference between large terms. We are more struck by differences in the nature of the heat balance between the contributions in the 1980s versus the 1990s. In particular, the horizontal advection term acted to cool in the 1980s and to warm in the 1990s; this change was largely com-
1710
JOURNAL OF CLIMATE
VOLUME 15
FIG. 7. The heating terms at 850 hPa based on Eq. (1). (top) The daily temperature from 1 Mar to 30 Apr. (bottom) The time accumulated horizontal heat flux divergence (solid line with *), the time accumulated vertical heat flux divergence (solid line with square), and the residual term (solid line with triangle) that include diabatic heating due to radiation, sensible, and latent heat. From left to right, the years are 1990, 1993, 1995, and 1997.
pensated for by changes in the vertical advection term and to a lesser extent, the residual term. These results can be compared with those from the heat budget carried out by Tanaka and Milkovich (1990) for northern Alaska in the winter of 1988/89. They also found that prominent subseasonal changes in low-level temperature were associated with variations in horizontal advection, but that this contribution to the heat budget was largely compensated for by variations in radiative cooling, rather than due to variations in vertical motion. The fundamental difference between cold and warm years relates to the sense, number, and intensity of episodic horizontal temperature advection events. The preponderance of cold advection events during the selected years in the 1980s versus warm advection events in the 1990s in the vicinity of Barrow can be attributed to differences in the mean circulation during the two periods. As shown by the 925-hPa geopotential height anomaly maps for the two groups of years during March–April (Fig. 9), the 1980s included anomalously high pressure centered over the Barents Sea extending across the eastern Arctic, and hence also anomalous northeasterly low-level flow, while the 1990s included
relatively low pressures over the central Arctic and high pressures south of Bering Strait and hence a greater tendency for southwesterly low-level flow. From our inspection of individual horizontal advection events, it appears that strong warm advection in the spring near Barrow is most frequently associated with westerly lowlevel winds, while strong cold advection is typically accompanied by northerly winds. These overall changes in the low-level circulation in the western Arctic from the 1980s to the 1990s can be considered a near-surface signature of the AO. Previous work has revealed that geopotential height anomalies with the AO are closely coupled in an equivalent barotropic sense between the lower troposphere and stratosphere (Thompson and Wallace 1998, Black 2002). To extend these studies, we examine the degree of this coupling in spring on subseasonal timescales and for the subregion represented by the western Arctic. As a measure of this coupling, we evaluated spatial correlations of monthly 200- and 850-hPa height anomalies in the sector north of 708N and between 1408E and 908W during the 16 selected months for which heat budgets were estimated. The results are strong positive correlations for
1 JULY 2002
OVERLAND ET AL.
1711
FIG. 8. As in to Fig. 7, but for the ‘‘cold’’ years in the 1980s. From left to right, the years are 1980, 1982, 1984, and 1987.
14 of the 16 months, with values typically greater than 0.90. This leads to our conceptual model for the tropospheric temperature changes in the western Arctic from the 1980s to the 1990s. These changes occurred because the polar vortex persisted into March in the 1990s, with coincident low-level circulation anomalies. These lowlevel flow anomalies brought about more episodes of warming due to horizontal advection; the accumulated contribution of these warming events tended to cause lower-tropospheric temperature anomalies to peak in April. It bears noting that this effect of the AO on the climate of the western Arctic exists because the Beaufort Sea represents the location of a node in the EOF pattern for sea level pressure (SLP; Thompson and Wallace 1998); this node represents a region of variability in the SLP gradient, and hence lower-tropospheric winds. It is TABLE 1. Means and standard errors of the means for the heat budgets at 850 hPa for four notable years in the 1980s and 1990s. Term Amount of warming Horizontal advection Vertical advection Residual (diabatic)
1980s 7 228 102 266
6 6 6 6
4K 19 K 12 K 12 K
1990s 15 47 54 288
6 6 6 6
2K 10 K 8K 13 K
therefore no surprise that the AO substantially influences the climate of the western Arctic. 6. Interannual and intraseasonal variations in the relationships between lower-tropospheric and stratospheric patterns The lower-tropospheric heat budgets presented in the preceding section focused on how the warm years of the 1990s differed from the cool years of the 1980s, in an overall sense. But our results also show substantial interannual differences in the mean flow within each decade, even considering just the two subsets of years selected to illustrate decadal differences. Our limited objective is to examine the interannual variability in greater detail, in particular, the relationships between the mean structure of the stratosphere and lower troposphere. In essence, we seek to ascertain the degree to which different configurations of the flow resulted in similar lower-tropospheric conditions in the western Arctic during spring. This issue is addressed through compilation of spatial correlations between monthly mean anomalies in the lower stratosphere and lower troposphere. We have considered both the Arctic as a whole, that is, the entire polar region north of 708N,
1712
JOURNAL OF CLIMATE
VOLUME 15
FIG. 9. Geopotential height anomalies at 925 hPa averaged over Mar and Apr for the four cold years in the 1980s: (a) 1980, 1982, 1984, and 1987; and the four warm years in the 1990s: (b) 1990, 1993, 1995, and 1997. The data are from the NCEP–NCAR reanalysis. The ‘‘B’’ indicates the location of Barrow, Alaska.
and just the western Arctic, here defined as the sector north of 708N, between 1408E and 908W. The results for the two different regions are similar, and for the sake of brevity, we present the results for the western Arctic. Spatial correlations are summarized in Table 2 between pairs of monthly mean anomaly distributions for March and April for the four years in the 1980s and in the 1990s selected in section 5. The first set of correlations is for geopotential height and temperature at 200 hPa. When these two parameters are positively correlated, geopotential height anomalies increase with height in the stratosphere. The strong positive correlations in 7 of 8 years in March, and in 3 of the 8 years in April suggest a well-developed stratospheric vortex in the Arctic in late winter/early spring, but the period this vortex persists into spring is quite variable. The second and third sets of correlations in Table 2, which involve the 850-hPa temperature with the 200hPa geopotential height and temperature, respectively, are used to indicate the consistency in the nature of the TABLE 2. Spatial correlations between selected anomalies for geopotential height (Z ) and temperature (T ) for Mar and Apr. Z 200–T 200
Z 200–T 850
T 200–T 850
Year
Mar
Apr
Mar
Apr
Mar
Apr
1980 1982 1984 1987 1990 1993 1995 1997
0.88 0.84 0.97 0.90 0.94 0.84 0.91 0.47
0.60 20.46 0.00 20.51 0.90 20.06 20.80 0.95
0.96 0.52 20.45 20.75 20.54 0.93 0.78 0.28
0.09 0.97 0.68 0.87 20.23 0.92 0.98 0.21
0.78 0.09 20.62 20.91 20.77 0.59 0.49 20.60
20.65 20.54 20.59 20.43 20.60 20.23 20.79 20.08
influence of the lower stratosphere on the lower-tropospheric temperature. The correlations between 850hPa temperature anomalies and 200-hPa geopotential height anomalies provides an index of whether lowertropospheric temperatures are reinforcing height anomalies aloft. The values shown in Table 2 indicate that 12 of the 16 months considered had 200-hPa height anomalies positively correlated with the 850-hPa temperature anomalies, but with considerable variability. We interpret this result to be a consequence of the vagaries in the weather in the western Arctic in spring. The subseasonal variability responsible for the bulk of the horizontal advection of heat is also liable to significantly impact the monthly mean temperature distributions and hence their relationships with the circulation aloft. It may not be a coincidence, therefore, that the two years in the 1990s with the strongest net horizontal advection of heat, 1993 and 1995, were also the two years with the strongest positive correlations between 200-hPa height and 850-hPa temperature anomalies. The correlations between the temperature anomalies at the 200- and 850-hPa levels provide an indication of the direct radiative coupling between the lower stratosphere and lower troposphere. While the decadal averages presented earlier, and the trends documented by Angell (1999), show that the lower-stratospheric and lower-tropospheric temperature anomalies tend to be out of phase, the robustness of this relationship can be gauged by the spatial correlations between the temperature anomaly fields at 200 hPa and those at 850 hPa for individual months. These fields were negatively correlated in 12 of the 16 months investigated, and for these 12 months, 9 had correlations with magnitudes greater
1 JULY 2002
1713
OVERLAND ET AL.
than 0.5. Three of the months did feature significant positive correlations between the temperatures at 200 and 850 hPa, and in each case it was during March. Our interpretation of this final set of correlations is that the springtime lower troposphere in the western Arctic is insensitive, at least directly, to the temperature anomalies and hence downwelling longwave radiation from the lower stratosphere because the effective optical depth is several kilometers. Again, the month-to-month fluctuations in this set of correlations are suspected to be a reflection of how the synoptic variability impacts the details in the circulation anomalies aloft and near the surface. Our results are consistent with the idea that the principal low-frequency geopotential height anomalies in the Arctic occur in the stratosphere and they are also expressed below in the troposphere, but that tropospheric temperature anomalies result largely from anomalous horizontal temperature advection. The latter process is sensitive to the details in the distribution of the low-level winds and temperatures, which in turn are subject to midlatitude as well as to Arctic influences. 7. Summary The lower troposphere in the western Arctic during spring was considerably warmer in the 1990s than in the previous four decades. This warming is consistent with reductions in sea ice extent and snow cover, permafrost warming, and with the perceptions of residents. Our analysis has sought to elucidate the causes for the springtime warming, with a focus on comparisons between the cold decade of the 1980s and the warm decade of the 1990s. The analysis is based on two sources: the NCEP–NCAR reanalysis and the TOVS Path-P datasets. Time series of 925-hPa temperatures for March and April at Barrow, Alaska, and Eureka, Canada, show that the 1990s were warm, and the 1980s were cold, due to an increase in the frequency of warm and cold months, respectively, rather than due to an increase in the magnitude of the temperature anomalies. There was a tendency for springtime temperature anomalies to be out of phase between the lower troposphere and lower stratosphere; for example, out of the six years in the 1990s with a warm spring at Barrow at 925 hPa (1990, 1993, 1995, 1998, and to a lesser extent, 1991 and 1997), four of these years (1990, 1993, 1995, and 1997) also featured cold 200-hPa temperature anomalies. The mechanisms responsible for the warm springs of the 1990s relative to the cool springs of the 1980s were examined via thermodynamic energy budgets at the 850hPa level for the region of Barrow, Alaska. Budgets were estimated for March and April during four particularly cool years in the 1980s (1980, 1982, 1984, and 1987) and four particularly warm years in the 1990s (1990, 1993, 1995, and 1997). The amount of warming over the March–April period averaged 7 K for the selected years in the 1980s, and 15 K for the 1990s. The
primary difference in the heat budgets between the 1980s and 1990s was the sense of the horizontal advection of heat. This term was a cooling effect (228 K over the 2-month period) during the 1980s, but contributed toward warming (47 K) in the 1990s. The heat advection was found to be consistent with mean lowertropospheric circulation changes accompanying the AO, but also of a highly episodic nature. Because the western Arctic is a region of large sea level pressure gradient for the AO pattern, we expect northern Alaska to be influenced by AO variability. In essence, spring tended to come earlier to the western Arctic in the 1990s than in previous decades. Based on our analysis, the typical scenario can be described as follows. At the end of winter in the 1990s, that is, in March, relatively cold temperatures and low geopotential heights tended to be present in the stratosphere. These anomalies persisted into April, with associated geopotential height anomalies in the lower troposphere that promoted warm air advection. Subsequent warm anomalies near the surface lasted well into May. We interpret this scenario as a signature of the systematic shift of the AO that occurred at the end of the 1980s. We speculate that the springtime stratospheric manifestation of the AO may be separate from the decadal changes in the NAO that have occurred for the winter. A conjecture that the NAO and the stratospheric component of the AO are separable has been made previously by Kodera et al. (1999). Our results clearly show large changes occurred near the end of the 1980s in the western Arctic during spring, but this does not necessarily imply a permanent shift in the climate. The recent report on global climate change by the Intergovernmental Panel on Climate Change (IPCC) lists relatively cold stratospheric temperatures as one of the more robust examples of global change. Whether the results documented here represent more an interdecadal fluctuation, or a long-term trend, has yet to be determined. Since the stratospheric vortex and AO appear to at least partially influence surface conditions in the western Arctic during spring, they represent an important and perhaps crucial indicator of the local climate. Acknowledgments. We appreciate the support from the Arctic Research Initiative (ARI) and the North Pacific Marine Research (NPMR) Initiative. This publication was supported by the Joint Institute for the Study of the Atmosphere and Ocean (JISAO) under NOAA Cooperative Agreement NA67RJO155. APPENDIX The Correction of the TOVS Path-P Temperature Fields before 1987 The TOVS Polar Pathfinder (Path-P) satellite dataset (Francis and Schweiger 2000) consists of gridded daily
1714
JOURNAL OF CLIMATE
VOLUME 15
FIG. A1. Arctic basin average monthly mean temperature anomalies for the TOVS Path-P dataset at (top) 300 and (bottom) 850 hPa. The crosses in the figure are the monthly anomalies, while the curves are the 1-yr running mean. Each satellite period is separated by dashed vertical line. Figure is from http://psc.apl.washington.eud/pathp/html.
Arctic atmospheric data derived from various National Oceanic and Atmospheric Administration (NOAA) satellites. It covers the region north of 608 latitude on a 100 3 100 km 2 horizontal resolution. This dataset is the first of its kind that can diagnose atmospheric characteristics across the Arctic basin in a consistent manner and with good horizontal resolution. Designed to address the particular need of the polar research community, the dataset is centered on the North Pole, and available from July 1979 to December 1998. To our knowledge, the only published work regarding the accuracy of TOVS Path-P dataset is by Schweiger et al. (2002). They compared the TOVS Path-P data with the Surface Heat Budget of the Arctic (SHEBA) measurement, and concluded that uncertainties in temperature retrieval are below ‘‘within-season’’ variability during all times of the year. Figure A1 shows the monthly temperature anomalies for the TOVS Path-P dataset for each satellite period. The top panel shows the anomaly at 300 hPa, and the bottom one is at 850 hPa. These curves are obtained from
the Applied Physics Laboratory, University of Washington (available online at http://psc.apl.washington.edu/ pathp/html/validation/calibrationpframes.html). The crosses in the figure show the monthly departure from the entire period, while the curves are the 1-yr running mean. It is obvious from the figure that in the early 1980s at 300 hPa the temperature was dominated by positive anomalies, while at 850 hPa it was dominated by negative anomalies. However, we suspect that part of these anomalies shown in Fig. A1 are artificially introduced due to the application of incorrect calibrations. It is known that for any satellite data, changes in the instrumentation may introduce time-varying biases in time series. Consequently, corrections used in the calibration procedure need to be computed; they are termed ‘‘deltas’’ in the TOVS Path-P dataset. Deltas were specifically calculated only for NOAA-10, -11, and -12, which is valid for the period from 1 January 1987 to 31 December 1996. Before that period, the deltas from NOAA-10 were used for NOAA-6–NOAA-9 (12 July 1979–31 December 1986). To remove the possible un-
1 JULY 2002
OVERLAND ET AL.
1715
FIG. A2. (a), (c), (e) Mar 300-hPa and (b), (d), (f ) Apr 850-hPa monthly mean temperature differences between (a), (b) original TOVS Path-P data and NCEP–NCAR reanalysis for the period of 1980–86 and (c), (d) between the corrected TOVS Path-P and NCEP–NCAR reanalysis for the same period. (e), (f ) The differences for the period of 1987–96 using the original TOVS Path-P data.
realistic trend in the 1980s as shown in Fig. A1, which might be introduced due to the improper deltas, we adjusted the TOVS temperature data at each level in a conservative manner. We first determined the averages of temperature anomaly at each level for each satellite period before 1986 relative to the NOAA-10 period. Then we subtracted these averages from the original TOVS temperature field to generate a new temperature called TOVS-corrected [TOVS(cor)]. Figure A2 shows the differences in the mean March–April temperature between TOVS and NCEP–NCAR reanalysis during the 1980s. Figures A2a,c,e show the differences for March at 300 hPa, and Figs. A2b,d,f show the differences for April at 850 hPa. Figures A2a,b show the differences between the original TOVS data and the reanalysis for the period 1980–86, while Figs. A2c,d show the differences between the corrected TOVS data and the reanalysis for the same period. At 300 hPa (Fig. A2a) it can be seen that the TOVS analysis is warmer than reanalysis by 1.5 K over the Arctic Ocean, and more than 2 K over land. At 850 hPa (Fig. A2b), the TOVS data are colder by more than 2 K over most of the area, with maximum around 4 K over the Norway, Sweden, and Alaska areas. With our correction, the differences at 300 hPa have been reduced to less than 0.5 K over most of the Arctic Ocean, and less than 1 K over most of the land area with exception of the western Scan-
dinavian region (Fig. A2c). At 850 hPa, the differences have been reduced to less than 1 K over the most of the polar region, and less than 2 K over North America and the Scandinavian region (Fig. A2d). Figures A2e,f show the differences for the period 1987–96 when the deltas are specifically calculated for each satellite period. It can be seen that after the correction, the pattern and magnitude of the differences are similar (Figs. A2c,e and Figs. A2d,f) to the period when the deltas are valid. We also compared the monthly mean temperatures from TOVS with the reanalysis for the 1990s, and for the period of the NOAA-10, -11, and -12 satellites. For both periods, the differences in temperature between the two datasets are less than 2 K at 850 hPa and less than 2.5 K at 300 hPa over land areas, and less than 1 K at both levels over the central Arctic Ocean. These differences are similar to those found for the 1979–86 period using our corrected TOVS dataset. The decadal change in the temperature field in Fig. 3 shows a warming greater than 3 K over a large area at 900 hPa, and a cooling of more than 5 K at 200 hPa; both of these values are larger than the maximum 2 K differences we found between TOVS and the reanalysis. Because of our conservative approach to TOVS correction, the decadal differences we estimate using the corrected TOVS data are actually less than those based on the NCEP reanalysis alone. Since deltas are presently
1716
JOURNAL OF CLIMATE
unavailable for the period of NOAA-6, -7, and -9, our simple adjustment appears to represent a reasonable correction. Other users of TOVS data need to keep in mind the impact of deltas for periods outside of 1987–96; updating these deltas should be a priority for Arctic research. REFERENCES Angell, J. K., 1999: Variation with height and latitude of radiosonde temperature trends in North America, 1975–94. J. Climate, 12, 2551–2561. Black, R. X., 2002: Stratospheric forcing of surface climate in the Arctic Oscillation. J. Climate, 15, 268–277. Chelliah, M., and C. F. Ropelewski, 2000: Reanalyses-based tropospheric temperature estimates: Uncertainties in the context of global climate change detection. J. Climate, 13, 3187–3205. Francis, J., and A. Schweiger, 2000: A new window opens on the Arctic. Eos, Trans. Amer. Geophys. Union, 81, 77, 83. Gaffen, D. J., M. A. Sargent, R. E. Habermann, and J. R. Lanzante, 2000: Sensitivity of tropospheric temperature trends to radiosonde data quality. J. Climate, 13, 1776–1796. Hurrell, J. W., 1995: Decadal trends in the North Atlantic Oscillation: Regional temperatures and precipitation. Science, 269, 676–679. Kalnay, E., and Coauthors, 1996: The NCEP/NCAR 40-Year Reanalysis Project. Bull. Amer. Meteor. Soc., 77, 437–471. Kistler, R., and Coauthors, 2001: The NCEP–NCAR 50-year reanalysis: Monthly means CD-ROM and documentation. Bull. Amer. Meteor. Soc., 82, 247–267. Kodera, K., H. Koide, and H. Yoshimura, 1999: Northern Hemisphere winter circulation associated with the North Atlantic Oscillation and stratospheric polar-night jet. Geophys. Res. Lett., 26, 443– 446. Manney, G. L., and J. L. Sabutis, 2000: Development of the polar
VOLUME 15
vortex in the 1999–2000 Arctic winter stratosphere. Geophys. Res. Lett., 27, 2589–2592. Monahan, A. H., J. C. Fyfe, and G. M. Flato, 2000: A regime view of Northern Hemisphere atmospheric variability and change under global warming. Geophys. Res. Lett., 27, 1139–1142. Pawson, S., and B. Naujokat, 1999: The cold winters of the middle 1990s in the northern lower stratosphere. J. Geophys. Res., 104, 14 209–14 222. Riedlinger, D., and F. Berkes, 2001: Contributions of traditional knowledge to understanding climate change in the Canadian Arctic. Polar Rec., 37, 315–328. Schweiger, A., R. Lindsay, J. Francis, J. Key, J. Intrieri, and M. Shupe, 2002: Validation of TOVS Path-P data during SHEBA. J. Geophys. Res., in press. Shindell, D. T., G. A. Schmidt, R. L. Miller, and D. Rind, 2001: Northern Hemisphere winter climate response to greenhouse gas, ozone, solar and volcanic forcing. J. Geophys. Res., 106, 7193– 7211. Stabeno, P., and J. Overland, 2001: Bering sea shifts toward an earlier spring transition. Eos, Trans. Amer. Geophys. Union, 82, 317, 321. Stone, R. S., 1997: Variations in western Arctic temperatures in response to cloud radiative and synoptic-scale influences. J. Geophys. Res., 102, 21 769–21 776. ——, E. G. Dutton, J. M. Harris, and D. Longenecker, 2002: Earlier spring snow melt in northern Alaska as an indicator of climate change. J. Geophys. Res., in press. Tanaka, H. L., and M. F. Milkovich, 1990: A heat budget analysis of the polar troposphere in and around Alaska during the abnormal winter of 1988/89. Mon. Wea. Rev., 118, 1628–1639. Thompson, D. W. J., and J. M. Wallace, 1998: The Arctic oscillation signature in the wintertime geopotential height and temperature fields. Geophys. Res. Lett., 25, 1297–1300. Waugh, D. W., W. J. Randel, S. Pawson, P. A. Newman, and E. R. Nash, 1999: Persistence of the lower stratospheric polar vortices. J. Geophys. Res., 104, 27 191–27 201.