Recognising, knowing & naming: Can object picture processing models accommodate non-picture visuals? Richard Cox Monash Adaptive Visualisation Lab (MArVL) Monash University, Caulfield Victoria 3145, Australia
[email protected]
Abstract. This paper provides an overview of information processing accounts of pictures of objects and of non-picture visuals (NPVs) such as graphs and diagrams, including theories of graph comprehension. Compared to the study of objects, there appear to be rather few information processing studies of NPVs. An NPV corpus was developed and items were used as visual stimuli in four cognitive tasks. The tasks assessed perceptual level processing (NPV recognition), semantic knowledge and lexical production (naming). The results are discussed in relation to several questions: How well do models of object picture processing accommodate the findings from this study of NPV processing? To what extent can NPVs be considered to be another class of object pictures? Are wellestablished phenomena in the visual object domain such as frequency and age of acquisition effects observed for NPVs? How do patterns of performance on the perceptual, semantic and naming tasks differ across NPV item sub-classes? The results show that performance patterns across a range of cognitive tasks utilizing NPV stimuli are - to some degree similar to those seen in object picture processing. Age of acquisition effects were also observed. It is concluded that the use of experimental paradigms from studies of object picture processing are useful for understanding how people understand and use non-pictorial graphical representations such as diagrams. Keywords: information processing, cognitive processing, diagrams, external representations, graph comprehension, object recognition, picture naming, age of acquisition.
1
Introduction
Diagrams and pictures of objects are both forms of graphical external representation and both have been studied from cognitive information processing perspectives. A large body of research has shown that people can accurately categorise and name a wide variety of pictures of living things (animals, fruits, body parts, marine creatures,...) and non-living things (furniture, tools, vehicles,...). Object recognition researchers have developed comprehensive cognitive
processing models informed by experimental studies (e.g. [1]). They describe basic discrimination and feature analysis (perceptual level), various types of semantic processing through to the levels of processing required for naming the depicted item (e.g. lexical access). Information processing accounts of ‘non-picture’ stimuli such as diagrams, graphs, charts, and maps have also been developed (e.g. [2, 3]). These theories tend to focus on either bottom-up early feature analyses such as graph feature extraction or top-down processes (template or schema invocation). In [2], Shah et al. (2005) state, “...there are two major classes of models of graph interpretation. First, ...models provide detailed descriptions of simple graph..tasks.., such as the ability to retrieve simple facts.....or the ability to discriminate between two proportions....A second class of models ...focuses on more general process analyses...but is less precise in its predictions about specific processes...” (p. 429). Compared to the study of objects, there appear to be rather few studies about semantic and lexical processing of non-object picture visual (NPV)1 stimuli such as graphs, charts, network, tree, set diagrams, notations, lists, tables and text. Little is known about people’s ability to accurately categorise and name NPV stimuli. How is an individual’s ability to recognise diagrams related to their ability to name the diagrams or related to their knowledge or understanding of the diagram and its purpose? Are these processes similar or different to their counterparts in object knowledge? The answers to these questions have implications for how we understand NPVs as images and how we comprehend diagrams as a language of spatial relationships. At one level diagrams can be argued to be just another exemplar of pictorial images, yet at another level the rule constraints of diagrams, maps and tables (required for their comprehension) make them more akin to domains such as reading where decoding knowledge has to be brought to the comprehension process. In the next sections, the literature on object recognition models will be briefly summarised followed by a review of cognitive approaches to processing nonpicture visuals (e.g. models of graph comprehension). 1.1
Information processing models of object pictures
A widely-cited model of object picture recognition [1] includes linked perceptual and cognitive subsystems for processing visual input, controlling attention, allocating processing resources and controlling responses or output. The model is hierarchical and includes visual and verbal processing modalities. Object picture processing begins with sensory feature registration allowing ‘figure’ to be distinguished from ‘ground’ and the processing of basic object features such as size, colour, length, orientation and location. Next, the visual features are integrated and grouped on the basis of similarity, facilitating perception. 1
The term ‘non-picture visual’ is due to Cripwell [4]. It is a useful term because it includes linguistic forms of external representation (text, tables, notations) in addition to non-picture graphical forms such as diagrams, graphs, charts and maps.
Objects are recognised even if viewed from unusual angles. This is achieved by mapping perceptual descriptions built up in visuospatial working memory [5] to structural descriptions retrieved from LTM (picturecon). At still higher levels of processing, semantic information is also retrieved (e.g. is the object a tool, an animal?) to allow for comprehension of what is perceived. A naming (production) response is possible when lexical access occurs. Information processing models of object picture representations are evolved on the basis of empirical evidence provided by experimentation. A common paradigm in this research is to develop a large pool of normed stimuli such as pictures of objects like the Snodgrass & Vanderwart corpus [6]2 to enable experiments to test the independence of different types of knowledge about these objects. Information processing models allow us to investigate the independence of discrete cognitive processes and make fairly accurate predictions of performance based on our knowledge about how earlier or later processes operate. A process model of object picture analysis - such as the one presented in Figure 1 (right) provides testable hypotheses concerning whether or not being able to recognise an object is a necessary precursor to comprehending what it is and how it is used. According to that model, one cannot describe how a saucepan is used unless one recognises a saucepan in the first place. Similarly the model predicts that being able to name a saucepan is contingent upon having some knowledge of what the saucepan is for. The model also predicts that we might observe phenomena such as frequency effects or age of acquisition effects. Frequency of experience is correlated with the age at which the object was first encountered, hence effects such as ‘age of acquisition’ are known to significantly influence naming performance. Objects that have names learned early in life are responded to more quickly (e.g. [8]). The age of acquisition effect is specific to picture naming - object recognition does not show this effect (see [9] for a review). An interesting question concerns whether similar effects are found for NPV naming. The UK National Curriculum was analysed by Garcia Garcia & Cox [10] for all subjects taught in schooling years 1 to 9 (ages 5 to 14 years). The forms of representation that are introduced to students aged between 5 and 9 years old include illustrations, tables, lists, bar charts, maps, flow charts and Venn diagrams. Forms introduced later (9-14 years) include entity-relation diagrams, network diagrams, tree diagrams, pie charts and Cartesian coordinate forms such as line graphs. Responses to these two classes of item will be examined in this study in order to examine whether age of acquisition effects are observed for NPVs. 1.2
Cognitive models of non-picture visuals processing
Cognitive models of NPVs such as graphs and diagrams are less completely specified than object picture processing models. In the NPV area, studies tend to focus on cartesian (X-Y axis) charts and various kinds of graph [3, 11–18]. 2
See [7] for a review of sets of object-naming stimuli.
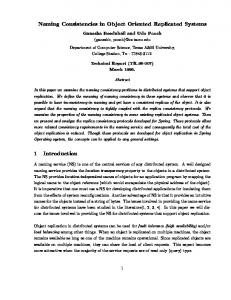
Fig. 1. Four examples of pseudo-diagrams (left) used in the recognition task. Cognitive model of visual object processing (right).
In general, the NPV models propose that bottom-up and top-down processes occur to some extent in parallel and involve three major cognitive subsystems - perceptual, short-term memory (STM) and long-term memory (LTM). First, low level visual features of, say, a bar chart are discriminated and encoded (XY axes, number of bars, their relative heights). These have been referred to as ‘elementary perceptual tasks’ [11] and as ‘visual primitives’ [15]. Examples include perceiving line lengths, areas, shading, curvature, position relative to a scale on an axis, angles, etc. Performance varies across these perceptual tasks. For example, position along a common scale is judged more accurately than the size of an enclosed area [19]. The relative lengths of bars in a bar chart are generally more accurately discerned than the relative areas of two circles in a set diagram or a comparison of ‘slice’ sizes in a pie chart. Features are believed to be chunked according to Gestalt perceptual features such as continuity, proximity and form [3]. Some features can be perceived in parallel but some require serial scanning. Cycles of scanning and rescanning build up a ‘visual description of the graph’ in STM, which has an approximately 7 second capacity for retention [15]. Visuospatial working memory is where visual descriptions in STM invoke schemas from LTM and where rehearsal and attentional resource allocation is managed via a central executive [5]. Trickett & Trafton [20] call for models of graph comprehension to incorporate more spatial processing in addition to visual feature processing. They argue that spatial processing occurs particularly when implicit information in a graph requires inferential processing in order for the required information to be extracted. They also observe gestures during communication of graph-derived information and they argue that this provides further evidence of the importance of spatial cognition.
Schemas are ‘standard, learned procedures for locating and decoding information presented in the graph’ ([15], p. 357). Schemas are used as the basis for mapping graph features to meaning (e.g. [12, 13]). They result from prior experience and contain domain knowledge, knowledge of representations and knowledge about which representations to use for particular tasks (i.e. ‘applicability conditions’ [17]; ‘decomposition’ [21]). Schema and semantic representations in LTM reflect an individual’s level of expertise. Cox & Grawemeyer [28] used an NPV card-sorting paradigm and cluster analyses to assess the mental organisation of semantic information. It was shown that people who performed well3 on diagrammatic tasks tended to sort graphs, charts, diagrams, etc into fewer, more cohesive and accurately-named categories than people who performed less well on diagrammatic reasoning tasks. Novices lack schema knowledge and are familiar only with a narrow range of graphical and diagrammatic forms. Errors such as the ‘graph-as-picture misconception’ (GAPm) have been observed in students [22, 23]. For example, a line graph of a quadratic function or relationship between two variables might be interpreted as as a picture of a mountain or a distance-time travel graph is interpreted as a map of an actual journey. Garcia Garcia & Cox [23] found that approximately 25% of children in a sample of 48 elementary school students manifested such misconceptions. Network graphs, pie charts and set diagrams were associated with higher rates of GAPm than bar charts, line graphs or tables. Leinhardt et al. [22] review GAPm phenomena but do not speculate on their origin in cognitive information processing terms. Information processing accounts offer a way of characterising graphical misconceptions such as the GAPm more theoretically. In terms of the model, a GAPm arises from visual errors at the recognition level - it is not a semantic error. 1.3
Ecological validity of information processing tasks using NPVs
Previous work has established that NPV tasks such as those used in the present study are useful for investigating perceptual, semantic and naming processes and that they correlate with real-world reasoning tasks, including diagrammatic reasoning. They therefore have a degree of criterion validity. Some of the tasks employed in this study were used in studies that also collected data on reasoning with external representations. Cox et al. [24] showed that computer science students’ functional knowledge of, and ability to name representations relevant to the software engineering domain4 correlated more highly with program debugging performance than years of previous programming experience (the next highest correlate). Garcia Garcia & Cox [23] developed a simplified version of the NPV recognition task for use with young students. It was administered to 45 3
4
i.e. who could assign an effective diagram to particular forms of information, or who could draw diagrams that were effective in aiding their problem solving. These were: lists, node and arrow (network) diagrams, tables, textual/linguistic representations (e.g. handwriting, typed text), trees and notations and formulae such as program code
students in grades 4,5 and 6 using an interactive, touch surface computer. The task identified students who had a ‘graph-as-picture’ misconception (validated against an independent external assessment). It was further shown that the socalled ‘graph as picture’ misconception should perhaps be renamed the ‘diagram as picture’ misconception since students were observed to misclassify as pictures NPVs other than graphs. Grawemeyer & Cox [25] administered the NPV tasks to subjects who also performed a demanding representation-selection task which required them to select data displays that matched both the information-to-bedisplayed and the requirements of the response task. The semantic NPV tasks were shown to be good predictors of display selection accuracy and reasoning performance.
1.4
Aims
At a theoretical level, questions about non-picture visuals include ‘are they just another category of picture visuals?’ and, if not, how are they represented and processed as a class of objects? This paper explores the extent to which NPVs function as a class of object pictures. Is accuracy greater on perceptual level tasks than on tasks involving more cognitive subsystems - i.e. ‘higher level’ semantic and naming tasks? To what extent do forms of NPV (graphical, linguistic) differ in terms of perceptual, semantic and naming task performance? How does performance differ at perceptual, semantic and naming levels of processing? Does performance on classifying NPVs correlate more highly with naming performance or with functional knowledge? Are ‘age of acquisition’ effects observed on NPV naming tasks? Answers to these questions will inform a model of NPV processing that would have potential practical use - e.g. as a basis for developing educational instruments for assessing graphical literacy and detecting representational misconceptions. To address these issues, a corpus of NPV images was used in four tasks.
2 2.1
Method Participants
Fifty-four participants took part in the study. They were recruited from a UK university and consisted of undergraduate and postgraduate students, research assistants and their friends. There were 38 males and 16 females. Nine males and two females were aged between 16-20 years, 9 males and 1 female were aged between 21-25 years, 8 males and 5 females were aged between 26 and 30 years, 4 males and 3 females were aged between 31 and 35 years, 4 males and 2 females were aged 36-40 years and 4 males and 3 females were aged over 40 years. Twenty-eight had undergraduate degrees (computer science, psychology, theology, or arts), 12 had masters degrees and 14 were qualified at PhD level.
2.2
The NPV corpus
The corpus consisted of 90 graphical representations of a wide variety of forms: Maps (street, topographic, weather, strip map (6 items)); Set diagrams (Venn, Euler (5 items)); Text items (newsprint, handwriting, email message, computer program,poem, telephone directory extract, questionnaire (8 items)); Lists (shopping, medical, recipe,telephone directory (5 items)); Tables (timetables, bi-directional matrix, truth table, contingency matrix (8 items)); Graphs & charts (lattice, X/Y function, scatter plot, pie chart, bar chart, box plot, bubble chart, candlestick. frequency histogram, PERT (16 items)); Tree diagrams (organisation chart, decision tree, genealogical, dendrogram (4 items)); Node & arrow (probability diagram, flow chart, Gantt, control, electrical circuit, entity-relation, UML, London underground (8 items)); Plans (building floor, house floor, dressmaking pattern, blueprint, seating (8 items)); Notations & symbols (logic notation, pictographic sequences, maths formulae, geometry, music, choreograpy (5 items)); Scientific Illustrations (exploded mechanical diagrams, engineering drawing,laboratory apparatus, physics, mechanics, geometry anatomy (7 items)); Icons (sport activity logos, commercial logos, packaging logos, road signs, audiovisual logos, Chinese logograph (10 items)). The categories and item examples within categories were derived from various taxonomic studies of external representations [26–29]) and from information visualisation sourcebooks [30, 31].
Fig. 2. Examples from the NPV corpus used in recognition, categorisation, functional knowledge & naming tasks.
Examples from each of the major categories are shown in Figure 2. In addition to the 90 NPVs, there were 22 ‘pseudo’ NPVs. These were designed for use as ‘fake’ items in the decision task (described below). Four examples are shown on the left side of Figure 1. There were also ‘fake’ non-graphical NPVs - a graph with tick marks and axis labels on the function curve instead of on the axes, invented math-like notations, an ill-formed syllogism, a ‘scrambled’ recipe (textual), etc.
These items were designed to be analogous to pictures of ‘unreal’ or ‘chimeric’ objects used in experimental neuropsychology (e.g. [32]). Care was taken to ensure that the fake items were not discriminable on the basis of spurious perceptual factors such as font or color. 2.3
The perceptual, semantic and lexical tasks
Assessing recognition knowledge via a decision task Decision tasks are used as a paradigm for establishing an individual’s recognition knowledge in a domain (e.g. picture decision). The task required respondents to indicate whether or not the non-picture visual stimulus was a valid and authentic example. The response mode was forced-choice, with response options ‘real’ or ‘fake’. Semantic knowledge tested via categorisation task A single NPV image was presented on each trial (presentation order randomised across tasks and subjects). Subjects were prompted How would you categorise this representation? Twelve response options were provided: 1. Graph or Chart; 2. Icon/Logo; 3. List; 4. Map; 5. Node & arc/network; 6. Notation system/formula; 7. Plan; 8. Maths or scientific figure/illustration; 9. Set diagram; 10. Table; 11. Text/linguistic and 12. Tree. Second Semantic task (knowledge of NPVs’ function) This task assessed subjects’ functional knowledge of each non-picture visual in the corpus. Each item was displayed and the subject instructed: “... What is its function? (select one). Note: if you think it may have more than one function, decide which is the most important or primary function.” The 12 response options were: 1. Shows patterns and/or relationships of data at a point in time; 2. Shows patterns and/or relationships of data over time; 3. Shows how/where things are distributed or located; 4. Relates time and activities; 5. Shows how things are organised, arranged, interconnected or interrelated; 6. Represents a procedure or algorithm; 7. Shows how things proceed, evolve or work; 8. Shows how to do things, instructions; 9. Language-based (linguistic) communication; 10. Formally expresses a mathematical, logical or scientific concept; 11. Aid to memory, and, 12. Symbolizes an idea or concept. The functional categories were derived from a sourcebook [30] and literature on the functional roles of diagrams [33, 17]. Production - assessed via a naming task One NPV item per trial was presented. Subjects were prompted “What is it? ”. Participants responded by choosing one name from 77 specific names for each of the 90 NPV items. The names were organised by category (maps, plans, notations, set diagrams, etc) in the response interface. Participants were instructed to select one name by clicking a response button adjacent to it. Examples of names provided include: ‘Venn diagram’, ‘music’, ‘simple list’, ‘timetable’, ‘truth table’, ‘box plot’, ‘scatterplot’, ‘Gantt chart’, ‘entity relation (ER) diagram’, ‘decision tree’, ‘syllogism’, ‘logo’, ‘anatomical illustration’, ‘logic’, ‘pictogram’, ‘engineering drawing’, ‘assembly instructions’, ‘floor plan’...etc. Participants were provided with 90 specific names and were
constrained to one selection per trial. The tasks were administered online and the order of presentation of NPVs was randomised across subjects. The first session (decision task) was of approximately 30 minutes duration. Participants performed the categorisation, functional knowledge and naming tasks in a second session of approximately 90 minutes duration. In each task, subjects were presented with the NPVs sequentially, one at a time. Each participant performed the four tasks in the order 1. decision, 2. categorisation, 3. functional knowledge, and 4. naming. The decision responses were scored by assigning 1 for correctly identified items (maximum score 112). For the categorisation, functional knowledge and naming tasks each correct response scored 1 (maximum 90). Proportion correct scores for each subject on each item on each task were computed. Mean proportion correct (mpc) across all NPV items within each task (recognition, semantic categorisation, semantic functional knowledge and naming) were computed for each subject (4 task mpc’s per subject, n=54).
3
Results & Discussion
Models of picture processing predict that to name an object an individual requires some conceptual understanding of the object - i.e. its category membership and meaning. To test this prediction with respect to NPVs, an initial analysis was conducted to determine the number of items correct in naming and in semantic categorisation of the NPVs. Table 1 presents the mpc scores for all subjects on each task. It was determined that the proportion scores were normally distributed with skewness within acceptable limits (+/- 2). Means rather than medians were therefore used. Task min max mpc sd skewness Recognition .36 .93 .77 .10 -1.856 SemCat .42 .82 .66 .09 -.175 SemFunc .32 .74 .50 .10 .202 Naming .30 .78 .57 .09 -.371 Table 1. Mean proportion correct (mpc) scores for each task (n=54).
Task SemCat SemFunc Naming Recognition .25 .38** .14 SemCat .53** .74** SemFunc .55** Table 2. Between-task correlations, (n=54, ** = p < 0.01, 2-tailed)
The mpc was greater for semantic categorisation than for naming (.66 vs .57, Table 1). This difference was statistically significant (t(related)=9.40, df=53, p